Differences in Roma and non‑Roma students’ ratings of their peers’ popularity: an inquiry into the oppositional culture in Hungarian schools with the use of a survey experiment
Tamás Keller1,2,3
© Springer Nature B.V. 2020
Abstract
Oppositional culture theory posits that students who belong to oppressed ethnic minor- ity groups define their ethnic identity in opposition to the majority of students. Minority students might restrict their achievements and effort in schools to gain popularity since they believe that their peers regard investing in pro-school attributes as a betrayal of their own culture and adaptation to the majority culture. Thus, peer pressure might explain why minority students’ performance lags behind that of their majority peers. We tested this theory among 584 seventh- and eighth grade (13–14-year-old) students in 38 ethni- cally diverse Hungarian classrooms. We conducted a vignette experiment in which students rated the “coolness” of fictive vignette persons whose attributes (GPA, effort, and school behavior) were randomly combined. Each student rated 12 randomly chosen vignettes. We found that Roma students rated their peers as less popular if the peers had a good GPA in classrooms with high ethnic diversity. We did not find a significant Roma/non-Roma gap in pro-school attributes in other domains such as effort and school behavior, or in non- pro-school attributes in any domain. Accordingly, we conclude that differences in eth- nic identity explain little of the Roma/non-Roma achievement gap in Hungarian schools.
Therefore, oppositional culture between Roma and non-Roma students appears to occur in context-specific and sporadic ways in Hungary.
Keywords Oppositional culture · Students’ popularity · Ethnic gap in school-related attitudes behavior · Roma students · Vignette survey
Electronic supplementary material The online version of this article (https ://doi.org/10.1007/s1113 5-020-00983 -x) contains supplementary material, which is available to authorized users.
* Tamás Keller
keller.tamas@krtk.mta.hu
1 Institute of Economics, Centre for Economic and Regional Studies, Tóth Kálmán utca 4., Budapest 1097, Hungary
2 Computational Social Science - Research Center for Educational and Network Studies, Centre for Social Sciences, Budapest, Hungary
3 TÁRKI Social Research Institute, Budapest, Hungary
1 Introduction
Determining the origin of the ethnic gap in students’ school achievement has vexed researchers for many decades. Anthropologists argue that discrimination against minority groups might not fully account for the ethnic achievement gap, since all minority groups experience discrimination to varying degrees, and some of them are academically success- ful (Ogbu 2003: 45).
Minority groups, however, can differ concerning how and why they came to a host country. While some groups of minorities arrive voluntarily, others are involuntarily incor- porated into society (Ogbu 1978). These historical differences can determine the sociocul- tural adaption of minorities to their host country. While voluntary minorities may accept the dominant culture, involuntary minorities might oppose it (Ogbu and Simons 1998).
Minority groups’ community forces, such as their dominant patterns of attitudes, beliefs, and behaviors in the domain of education (Ogbu 2008: 13) are hypothesized to hinder their schooling in Ogbu’s cultural-ecological model (Ogbu 1987, 1991, 2008; Ogbu and Simons 1998). One specific component of community forces (Ogbu 2008: xxiv) is the minority group’s cultural frame of reference (Fordham and Ogbu 1986), which expresses an ethnic group’s shared beliefs about how people should behave and act.
Cultural frames of reference may protect the ethnic group’s identity and maintain boundaries between them and members of the majority group (Fordham and Ogbu 1986:
181). Minorities might oppose those attitudes (like doing well in school) that they perceive as belonging to the majority group in response to the discriminatory treatment they face from the majority group (Fordham and Ogbu 1986: 179). Thus, minority students might not engage in activities that increase school performance because they associate good school performance with the majority group of students. Tension might thus arise between schools’ demands for behaving in ways that promote academic achievement and the demands of minority students’ peer group for behaving in ways that do not (Ogbu 2008:
3). This tension is referred to as the burden of ‘acting White’ (Fordham and Ogbu 1986).
Oppositional culture theory (OCT) argues that the burden of acting White leads minority students to withhold or camouflage their academic achievement to secure or maintain their (minority) peers’ acceptance (Fordham and Ogbu 1986: 201–202).
Several empirical analyses have tested how peer pressure prevents minority stu- dents from doing well in school. This vein of literature is based on popularity measures and assumes that minority students are sanctioned with decreasing popularity when they are doing well in school. Prior scholarship has deployed self-reported measures, such as
“respondent often feels put down by students in class” (Cook and Ludwig 1997); “do you think that other students see you as popular” (Ainsworth-Darnell and Downey 1998), and
“my friends make fun of people who try to do well” (Farkas, Lleras, and Maczuga 2002).
The wording of these measures ultimately reflects how students interpret their peers’ reac- tions. The empirical findings are, however, mixed; some support (Farkas, Lleras, and Mac- zuga 2002; Fryer and Torelli 2010) and others undermine (Cook and Ludwig 1997) OCT.
To overcome the constraints of self-reported measures, Fryer and Torelli (2010) employed an index that summarizes friends’ social status. The index shows how much high-achieving minority students are sanctioned with a loss of high-status, same-race friends for their achievements. The authors find that high-achieving African American stu- dents are sanctioned with the loss of their friends, which supports OCT.
OCT is limited in four respects, which prevents the generalization of related predictions.
First, OCT assumes clear and visible boundaries between majority and minority students,
and ignores the fact that ethnicity is a social construct (Hogg and Reid 2006; Telles and Paschel 2014) in which social relationships shape racial perceptions (Boda 2018). There is a need, therefore, to research how OCT can be applied to a context in which ethnic bounda- ries are not salient (Ladányi and Szelényi 2006; Boda 2019) due to obvious phenotypical features.
The majority1 of the empirical tests of OCT have concentrated on one particular group of involuntary migrants; namely, African Americans.2 OCT, however, acknowledges that other groups of involuntary migrants such as American Indians, Native Hawaiians, Basques, Catalans, or Koreans in Japan (Fordham and Ogbu 1986) might have developed an oppositional culture as well. Therefore, there is a need to examine how widespread OCT is by extending the focus to other groups of involuntary minorities.
Second, OCT assumes a general and homogeneous peer effect, which means that the theory is not specific to addressing how peer-composition alters the effect of oppositional culture. A growing literature in economics focuses on the relevance of social context in the formation of ethnic identity (Akerlof and Kranton 2000).
Bisin et al. (2011) point out the potential non-linearity of the relationship between the size of a minority group and the prevalence of oppositional culture. More specifically, there is a potential reverse-U-shaped relationship between the share of minority students within a classroom and the intensity of oppositional culture between minority and major- ity students. This reverse-U-shaped relationship speaks for weak oppositional culture in ethnically homogeneous classrooms (with a large share of Roma/non-Roma students), and intensive oppositional culture in ethnically diverse classrooms.
There are several explanations for why oppositional culture is more prevalent in eth- nically diverse classrooms (Bisin et al. 2011). First, in ethnically diverse classrooms, the size of the minority group is large enough to permit the selection of a minority role model whose attitude minority students can imitate. By contrast, in ethnically homogeneous classrooms students are less likely to meet peers from the oppositional ethnic group, and thus minority students are more likely to choose a role-model from their majority peers.
Second, in ethnically diverse classrooms the psychological cost of interacting with some- one from the majority group is higher, because there is greater peer pressure from minor- ity peers. Third, there is a more intense desire among minority students to define (defend) their own ethnic identity against the majority students in ethnically diverse classrooms, since greater polarization between ethnic identities leads to more intensive demand for strong ethnic boundaries.
For example, Fryer and Torelli (2010) find that minority students in ethnically diverse schools reject their minority peers more for having good grades than minority students in more segregated schools do. The reason is that if the proportion of minority students increases, the need for developing and maintaining an oppositional attitude begins to lose its relevance.
Third, OCT focuses only on attitudes and behavior that promote academic achievement (pro-school attributes) (Ainsworth-Darnell and Downey 1998; Fryer and Torelli 2010).
1 However, some prior work has investigated different ethnic minorities (Hajdu et al. 2019; Kisfalusi 2018;
van Tubergen and van Gaans 2016; Çelik 2015).
2 OCT uses the term ‘Black’ when it refers to the African American population, the latter which is a polit- ically more correct expression than the former. Since OCT uses metaphorical language (‘acting White’) which becomes imbued with meaning when opposed to the term ‘Black,’ we sporadically use the term Black without wishing to ignore the need to use more politically correct language.
The claim of OCT that minority students retain or camouflage their achievement hinges, however, on the assumption that minority students earn reputational benefits if they invest in attributes that do not promote academic achievement (non-pro-school attributes). The need for a wider definition of OCT has already emerged in the literature (Neal-Barnett 2001), but few empirical tests have satisfied this demand (Neal-Barnett 2001).
Peer acceptance of non-pro-school attributes could explain why minority students cam- ouflage and restrict their academic achievement, as OCT predicts. For example, ethnic minority students might be negatively sanctioned by their peers if they are diligent (a possi- ble pro-school variant of effort). However, this might or might not mean that minority stu- dents are regarded as more popular if they do not do their homework (a potential indication of less effort, and thus a non-pro-school variant of effort).
Fourth, OCT focuses on the issue of how minority students are perceived by their minority peers (passively). Responses say little, however, about how minority students (actively) perceive their peers, Students’ perceptions about their peers ultimately regulate the emergence of oppositional culture,3 a fact which calls for more research into students’
active perceptions (judgments) about their peers.
The present paper provides empirical evidence about the above-mentioned four limi- tations of OCT. Dealing with the limitations related to the assumption of visible ethnic boundaries, we extend OCT to another group of involuntary migrants; namely, the Roma in Hungary, for whom the phenotypical features of ethnicity are less visible.
In order to address the general and homogeneous peer effect, which is not influenced by peers’ ethnic composition, we test OCT in ethnically diverse classrooms.
We employ a wide definition of school-related attributes in response to the formerly narrow focus on pro-school attributes that promote academic achievement. We focus also on students’ effort and school behavior (not only on school achievement), and we extend the examination of oppositional culture to non-pro-school attributes that do not promote academic achievement.
We test how individual students sanction their peers if the peers’ academic achievement improves. We investigate how students perceive or judge their peers’ popularity (coolness) depending on peers’ academic achievement, behavior, and diligence.
We carried out a vignette survey experiment whereby seventh and eighth-grade students in ethnically mixed Hungarian school (N = 584) rated the popularity (coolness) of twelve randomly chosen fictive vignette persons, whose characteristics (such as grades, effort, school behavior, and gender) were randomly matched. Thus, our measure of the relation- ship between popularity and peers’ attributes relied on the (1) uncorrelated, (2) exogenous characteristics of vignette persons with, (3) considerable variation, and (4) without social desirability bias. The lack of these features has been mentioned as a limitation of prior measures (Fryer and Torelli 2010).
We find context-specific effects for OCT, which speaks for the conclusion that the Roma/non-Roma achievement gap is not strongly rooted in oppositional ethnic iden- tity. More specifically, Roma students rate their peers with good GPA as less popular in
3 Furthermore, OCT is “constructed” from the perspective of minority students. The theory makes pre- dictions only about how minority students perceive their minority peers. However, it is agnostic about how minority students perceive their majority peers (if the latter, for example, are doing well at school).
More specifically, OCT says little about whether minority students oppose doing well in school in general (regardless of peers’ ethnicity) or if they employ double standards (i.e. they oppose certain attitudes if their own kin also hold them, but accept them if majority peers do).
ethnically highly diverse classrooms (but not in all classrooms). Besides students’ GPA, oppositional culture is not prevalent in other domains such as with students’ effort and school behavior.
1.1 The theory of “acting White” and the Hungarian Roma
The Roma (also known as Gypsies, or Romani people) are a historically oppressed ethnic minority in Europe, including Hungary. Accordingly, the situation of Roma might resem- ble that of the African American population. Hungarian Roma may develop oppositional attitudes and behavior in school that reflects their resentment towards non-Roma Hungar- ians. The significant ethnic prejudice against Hungarian Roma (Váradi 2014; Simonovits et al. 2018) and the existence of segregated friendship networks (Boda and Néray 2015) in ethnically mixed Hungarian schools might justify this reasoning.
African Americans and Hungarian Roma are two different ethnic minorities with no racial similarity. However, some similar characteristics of these two minorities might explain why Hungarian Roma could have developed an oppositional culture similar to that developed by African Americans.
The mother tongue of many Roma in Hungary is Hungarian. Furthermore, Roma people do not have any specific national characteristics (Kemény et al. 2004). Similarly to Afri- can Americans who were involuntarily and permanently incorporated into society (Ford- ham and Ogbu 1986: 178), Hungarian Roma do not have any traditions or connections to the homeland of their ancestors. Hungarian Roma are also subject to ethnic stereotyp- ing (Simonovits and Kézdi 2016; Kisfalusi et al. 2018) due to a misinterpreted correlation between ethnicity, low social status, and crime, which lays the ground for over-generalized negative prejudice (Kende 2002).
Roma students’ level of education is on average lower than that of Hungarians (Kemény et al. 2004). According to official statistics, the proportion of early school leavers in 2017 was 65% among 18–24-year-old Roma, but 9% among non-Roma Hungarians (KSH 2018).
Roma are segregated on the labor market: 47% of them have temporary labor contracts (7% among non-Roma Hungarians); moreover, Roma are less likely (4%) to work in white- collar jobs than non-Roma (44%) (KSH 2018).
Since Fordham and Ogbu (1986) argue that prejudice, stereotypes, and segregation feed an oppositional culture, we conclude that Hungarian Roma might be alienated from an educational system defined by non-Roma Hungarians. Therefore, Roma students might invest less effort into education.
Prior empirical research has not verified the existence of an oppositional culture in Hun- garian schools. More specifically, Kisfalusi (2018) showed that high academic achievement does not lead to more frequent victimization among Roma students in Hungary. Further- more, Hajdu et al. (2019) found that high-achieving Roma students have more friends and fewer adversaries than their low-achieving Roma peers.
Both of the related studies, however, focused on one particular element of pro-school attributes (namely, school grades). Furthermore, they analyzed how students are (pas- sively) perceived by their peers and did not focus on how students (actively) rated their peers. Therefore, there is a need to expand our perspective by employing more compre- hensive measures to increase understanding of oppositional culture in Hungarian schools and see how students with a different ethnic background perceive their peers depending on those peers’ school-related attributes.
1.2 Assessment of the relationship between popularity and grades
We conducted a survey experiment to research how pro-school attributes (i.e. those attrib- utes that promote academic achievement) and non-pro-school attributes (those that do not promote academic achievement) influence popularity. Survey (vignette) experiments have been widely used in situations in which social norms are activated, since this method can give insight into the attitudes behind respondents’ appraisals (Jasso 2006).
In our survey experiments, respondents received a random set of vignettes in the form of short descriptions of fictive vignette persons. Respondents were asked to judge the cool- ness of each vignette person separately.
This design has various advantages in terms of our research question. First, it enabled us to observe how individuals judge their peers’ popularity depending on peer characteristics (as described in the vignettes). Similar judgments might take place in the real classroom context. In classrooms, however, it is difficult to observe how individuals’ judgments of their peers arise, since peers’ characteristics are often not salient and appraisals are usually not conscious.
Second, since the same respondent rated more than one vignette, we can make compari- sons within respondents’ answers.
Third, since vignettes were different, the same respondent rated the popularity of very different vignette persons, thereby increasing variance compared to a situation in which respondents judged the popularity of their classmates or friends, who are typically much more similar to each other.
Fourth, the random matching of the level of the main characteristics of vignette persons secures unbiased estimations, since there is neither correlation within the characteristics of the vignette person nor between the vignette persons’ and respondents’ characteristics.
Last, the main characteristics of the vignette persons were not predetermined by popu- larity. For example, in a real classroom context, students might withhold effort to gain pop- ularity (thus their observed effort might be influenced by their popularity a priori), thereby introducing endogeneity into the estimations.
2 The survey experiment
We originally contacted all primary schools in seven contiguous counties of central and eastern Hungary (where Roma minorities are overrepresented) via the heads of the local school districts for another field experiment4 in the spring of 2017. Primary education in Hungary is equivalent to primary and lower-secondary education according to interna- tional classification (ISCED 1 and ISCED 2 levels), or elementary and middle school in the United States.
We obtained initial participation agreements from 55 schools. From these 55 schools, 37 had eight-year classes in the academic year of 2018/19. These 37 schools are the sample for the current research. In Fall 2018, we contacted these schools again and asked for their permission to conduct new research among seventh- and eighth-grade students. Thirty-four schools agreed to participate.5
4 https ://www.socia lscie ncere gistr y.org/trial s/2610.
5 One school no longer exists, one school was flooded and the students distributed between other schools, and one school did not want to participate.
During a 1-month period (from November 6 to December 6, 2018), we conducted a paper-and-pencil survey experiment in 34 schools and 63 classrooms. Our sample is not a representative sample of seventh- and eighth-grade students in Hungary, since the geo- graphical area of study is a poor and economically less developed part of the country.
Our analytical sample contains ethnically mixed classrooms in which there was at least one student whose ethnicity differed from their classmates (we excluded classrooms with only Roma or non-Roma Hungarian students). Students who were absent on the day of the survey and those who had not obtained parental consent for participation in the survey6 were not part of the analytical sample. These restrictions led to an analytical sample of 584 students from 38 classrooms in 24 schools.
2.1 Respondents
We gathered baseline information about the respondents before the start of the fieldwork. Teach- ers reported students’ grades from the previous year (for mathematics, Hungarian language, Hungarian literature, history, and foreign languages) and birthdates. Students’ gender was coded according to first names. Table 1 summarizes the sample respondents’ characteristics.
2.2 The vignettes
The characteristics of the vignette persons are summarized in Table 2. Vignettes contained four main characteristics describing the vignette persons’ grades, behavior, effort, and gen- der. Each main characteristic had different levels corresponding to the quality or intensity of that characteristic. Every vignette contained only one level of the main characteristic.
The main characteristics of the vignette person did not include ethnicity.7 Table 1 Descriptive statistics
of respondents in the analytical sample
N = 584
Mean Standard
deviation Minimum Maximum
Girl 0.507 0.500 0 1
Age 13.70 0.753 12.28 16.96
GPA 3.264 0.950 1 5
Roma 0.284 0.451 0 1
6 Out of the 60 classrooms in the analytical sample, in 46 classrooms the survey response rate was more than 80%. The response rate was below 50% (38.5%) in one classroom.
7 Omitting ethnicity as one of the main characteristics of the vignette person was done for practical and theoretical reasons. The practical reason is that some classroom teachers would have refused to participate in the survey if we had included ethnicity as one of the vignette person’s main characteristics. These class- room teachers argued that mentioning ethnicity in the questionnaire would enhance preexisting prejudice within the classroom. The theoretical reason for the omission is that ethnic identity is a social construct (Hogg and Reid 2006; Telles and Paschel 2014) with fluid boundaries (Boda 2018, 2019). Therefore, including ethnicity as one of the vignette person’s main characteristics would have biased our measure- ment. In this case, individual stereotypes about Roma would have been activated. Furthermore, obtaining information about both students’ and vignette persons’ ethnicity would have resulted in the identification of a combination of same/mixed ethnic relationships. For modeling these combinations, OCT does not provide guidance. OCT is specific about the relationship between minority students and their (minority) peers and leaves aside the issue of potential double standards (the relationship between minority students and majority peers).
Across vignettes, we varied the order of the four main characteristics. In practice, we made sure that each main characteristic appeared in first place on each vignette. This was found to be necessary since we assumed that students might be influenced most by the first information they read about the vignette person.
The vignette persons’ main characteristics had different levels. The first level (indi- cated with an “a” in Table 2) is the pro-school attribute. This is an attribute of students that schools might find desirable and that might promote academic achievement. We also deployed several non-pro-school attributes. Non-pro-school attributes are those that schools might not find desirable and that might not promote academic achievement.
All the attributes of the vignette person refer to concrete attitudes, since prior research found large ethnic differences in concrete but not abstract attitudes (Mickelson 1990).
Corresponding to the number of levels within each main characteristic, the number of all possible vignettes was 120 (3 × 5×4 × 2). We randomly selected 48 vignettes, without replacement, from this vignette universe. A fully random set of vignettes was selected instead of employing a D-efficient sample which seeks to maintain the orthogonality of dimensions. Since the vignette universe was small and the selected sample of vignettes relatively large, the fully random selection of vignettes produced similar results to the D-efficient sampling (Auspurg and Hinz 2015).
The selected vignettes were randomly sorted into four different questionnaire versions, each containing 12 vignettes. A sample vignette is included in the “Appendix”.
We did not eliminate vignettes based on combinations of main characteristics that rarely occur among real students. Before carrying out the vignette survey, we tested how students (not included in our sample) rated the descriptions of the vignette persons. The results of the test revealed that students did not find rare combinations of vignette persons’ character- istics to be implausible.8
Table 2 Characteristics of vignette-persons
Characteristics Values
1. Grades (a) Good GPA [baseline category]
(b) Average GPA (c) Poor GPA
2. Behavior (a) Good school behavior [baseline category]
(b) Hinders others (by talking, laughing, letter-writing) (c) Talks out of turn (makes funny remarks aloud) (d) Gets out of the seat (without permission) (e) Disobedient (refuses to carry out instructions)
3. Effort (a) Diligent [baseline category]
(b) Does not do homework (c) Lacks/incomplete equipment (d) Idleness (is often off-task)
4. Gender • Girl
• Boy
8 For example, there were good students who did not do homework, and diligent students with weak aca- demic performance. The full set of the deployed 48 vignettes is available in the Online Appendix.
Questionnaire versions were equally and randomly distributed to respondents in each classroom, so versions of questionnaires varied within a single classroom.
3 Coding of main variables, hypotheses, and methods 3.1 Main variables
Our outcome variable is respondents’ ratings of the vignette persons’ popularity. We asked students to rate the popularity of vignette persons after reading the following: “Now you will read short descriptions about 12 students. You might recognize yourself or one of your classmates in these descriptions.” This prompt aimed to establish a connection between the fictive vignette persons and students’ real peers, corresponding to our aim of learning more about how students’ perceptions of their peers emerge.9
Before students read the description of the twelve vignette persons, they read the fol- lowing sentence: “How cool would you perceive your fellow student to be if they had the following attributes… (“Cool” describes a person who is popular and has an influence on others).” Students answered this question using a Likert scale ranging from 0 (“not at all cool”) to 10 (“very cool”).
Figure 1 shows the distribution of the dependent variable.
0 5 10 15 20 25 30
Percent of total answers
0 1 2 3 4 5 6 7 8 9 10
How cool would you perceive your fellow student to be if they had the following attributes ...
on a scale ranging from 0 (“not at all cool”) to 10 (“very cool”)?
Mean = 2.71; SD = 2.66
N of vignettes = 6969; N of respondents = 584
Fig. 1 Distribution of the dependent variable in the analytical sample
9 A possible contra-argument is that abstract scenarios can yield more generalizable results, since they lead to information equivalence concerning the background scenario (Dafoe et al. 2018).
The classroom teacher reported students’ ethnicity. In the analytical sample (N = 584 students) the number of non-Roma students was 418 (71.6%), and the number of Roma students 166 (28.4%).
All the classrooms in the analytical sample were ethnically mixed, containing at least one student whose ethnicity was different from their peers (i.e. there was at least one Roma student among non-Roma peers, or at least one non-Roma student among Roma peers).
We defined classrooms’ ethnic diversity based on the share of students with a different ethnicity. In classrooms with low ethnic diversity, the share of Roma students was below 20% or greater than 80%. This meant that in classrooms where ethnic diversity was low, there were usually 1–2 students with the oppositional ethnicity (Roma or non-Roma). In classrooms with high ethnic diversity, the share of students with the same ethnic identity was between 20% and 80%.
In the analytical sample there were 379 (64.9%) students in classrooms with low ethnic diversity in which the share of Roma students was smaller than 20% or greater than 80%.
The number of students in classrooms with high ethnic diversity was 205 (35.1%), where the share of Roma students was between 20% and 80%.
Figure 2 shows how classrooms were classified according to the share of Roma minority students.
3.2 Hypotheses
OCT posits that, due to peer pressure, students belonging to the oppressed ethnic minority will behave in ways that do not promote academic achievement (Ogbu 2008: 3). Therefore, we hypothesized that:
0 1 2 3
0% 20% 50% 80% 100% 0% 20% 50% 80% 100%
Classrooms with low ethnic diversity Classrooms with high ethnic diversity
Frequency
Share of Roma in the classroom
N of classrooms = 38
Fig. 2 The ethnic composition of the sample classrooms
1. Roma students would award lower scores to vignette persons with pro-school attributes (or they would perceive them as less cool) than non-Roma students.
Furthermore, OCT argues that minority students aim to secure their minority peers’
acceptance by restricting or camouflaging their academic achievement (Fordham and Ogbu 1986). Therefore we hypothesized that:
2. Roma students would award higher scores to vignette persons with non-pro-school attributes (or they would perceive them as cooler) than non-Roma students.
The economic literature on the formation of oppositional identity argues (Bisin et al. 2011) that oppositional culture is more intense in classrooms with high ethnic diversity relative to classrooms with low ethnic diversity (where there is a high share of only Roma or only non-Roma students). Therefore, we hypothesized that:
3. H1 and H2 would be more prevalent in classrooms with high ethnic diversity than in classrooms with low ethnic diversity. In other words, this means that:
a. in classrooms with low ethnic diversity, the Roma/non-Roma difference in pro- school attributes would be higher (less negative) than in classrooms with high ethnic diversity.
b. in classrooms with low ethnic diversity, the Roma/non-Roma difference in non-pro- school attributes would be lower (less positive) than in classrooms with high ethnic diversity.
In sum, while H1 and H2 test the Roma/non-Roma gap in general, H3 concerns the rela- tive difference in the Roma/non-Roma gap in classrooms with low ethnic diversity relative to classrooms with high ethnic diversity.
3.3 The empirical analysis
We estimated multilevel random effect models (Eq. 1). Random effect models are capable of handling unobserved heterogeneity by allowing each student and each classroom to have different intercepts. The vignette persons’ characteristics were randomly allocated; thus we assume no correlation between vignettes and respondents.10
We estimated the following model:
In Eq. 1, “Cool” is the i-th respondent’s (in classroom c) estimate of the v-th vignette person’s coolness.
(1) Coolv,i,c=𝛼v,i,c+𝛽1×VPv,i,c+𝜷2×Ri,c+𝛽3×Di,c+𝜷4×VPQv,i,c×Ri,c
+𝜷5×Ri,c×Di,c+𝛽6×VPQv,i,c×Di,c+𝜷7×VPQv,i,c×Ri,c×Di,c +𝛽8×Xi,c+𝛽9×Vi,c+𝜃i,c+𝜖v,i,c
10 Accordingly, we chose random-effect models instead of fixed-effect models. This choice was supported by the corresponding Hausman test which showed no difference between fixed- and random-effects models.
This is an indication that the more effective random-effects model should be chosen.
The vector VP contains the vignette person’s main characteristics (as described in the vignettes; namely, GPA, effort, behavior, and gender).
The Variable R denotes Roma students, and D indicates classrooms with high ethnic diversity.
Vector X represents the respondent’s baseline characteristics such as gender, age, and GPA.Vector V represents the characteristics of the vignette, such as the vignette’s rank order concerning the respondent’s 12 vignettes in the questionnaire, and the pattern of the vignette (the particular sequencing of the characteristics of the vignette person).
In VPQ we introduce the vignette person’s school-related main characteristics (GPA, effort, and behavior) separately to analyze the interaction between each main character- istic and students’ ethnicity. In practice, this means that while all the models contain all the main characteristics of the vignette persons (VP) as the main effect, the interaction effect is defined as the product of a given school-related main characteristic and stu- dents’ ethnicity. Therefore, we analyzed the interaction between students’ ethnicity and vignette persons’ GPA, diligence, and school behavior in different models.
There are two random effects in the model: θi,c,s is the random effect of i-th respond- ent, and μc is the classroom random effect. The idiosyncratic error term is εv,i,c.
The coefficient β2 shows the difference between Roma and non-Roma students in pro- school attributes (in classrooms with high ethnic diversity, since this is the reference category). We expected β2 to be negative, meaning that Roma students would regard their peers with pro-school attributes as less cool than non-Roma students.
The coefficient β4 shows the difference between Roma and non-Roma students in non-pro-school attributes (in classrooms with high ethnic diversity). We expected β4 to be positive. In other words, we expected that Roma students would find their peers with non-pro-school attributes more popular that non-Roma students.
Coefficient β5 shows the difference in the Roma/non-Roma gap in pro-school-attrib- utes between classrooms with high ethnic diversity versus low ethnic diversity. We expected β5 to be positive, meaning that compared to classrooms with high ethnic diver- sity (reference category), in classrooms with low ethnic diversity the Roma/non-Roma difference in pro-school attributes would be lower (less positive). Note that since the reference category is classrooms with high ethnic diversity, β5 shows the opposite of H3a.Coefficient β7 shows the difference between pro-school and non-pro-school attributes in relation to the difference in the Roma/non-Roma gap in classrooms with high/low eth- nic diversity. We expected β7 to be negative, meaning that the Roma/non-Roma difference in non-pro-school attributes (compared to pro-school attributes) would be less positive in
Table 3 The interpretation of coefficients about Roma/non-Roma differences in Eq. (1) In classrooms with high ethnic diver-
sity In classrooms with low ethnic diver-
sity relative to classrooms with high ethnic diversity
Pro-school attributes Coefficient: β2
Assumed sign: negative
Interpretation: Lower scores for Roma
Coefficient: β5
Assumed sign: positive Interpretation: β2 is less negative Non-pro-school attributes Coefficient: β4
Assumed sign: positive Interpretation: β2 is less negative
Coefficient: β7
Assumed sign: negative Interpretation: β5 is less positive
classrooms with low ethnic diversity. Table 3 summarizes the assumptions about Roma/
non-Roma differences made in Eq. 1.
4 Results
Based on Table 4 (main results), we can illustrate the Roma/non-Roma difference in sepa- rate figures corresponding to each model from the table. The interpretation of the Roma/
non-Roma difference using the figures is straightforward, since the estimated Roma/non- Roma gap is not significant if the confidence interval around the estimated coefficient crosses the straight line at zero.
Regarding the vignette persons’ GPA (column 1 in Table 4) we find that Roma students in classrooms with high ethnic diversity (reference category) appraise vignette persons with good GPA (pro-school attribute) as less cool (β2 = − 0.521; p = 0.032) than non-Roma students do.
The Roma/non-Roma gap is, however, much smaller on average (coef. = − 0.053;
p = 0.756) if we do not distinguish between the classrooms based on their ethnic diversity (Fig. 3). Therefore, we find no significant evidence for H1, which posits that Roma students rate their peers with good GPA as less popular than non-Roma students do. The Roma/non- Roma gap is only significant in classrooms with high ethnic diversity and is not significant in general in all classrooms.
Relative to pro-school attributes, the Roma/non-Roma gap is significantly higher (less negative) in non-pro-school attributes in classrooms with high ethnic diversity, both for vignette persons with average (β4 = 0.590; p = 0.003) and poor GPA (β4 = 0.786; p < 0.001).
If we do not distinguish classrooms based on their ethnic diversity (Fig. 3), the Roma/
non-Roma gap is 0.013 (p = 0.933) for vignette persons with an average GPA, and it is
− 0.063 (p = 0.698) for vignette persons with a poor GPA. Thus, the results do not support H2. Roma students (relative to non-Roma students) do not judge their peers as more popu- lar if they have non-pro-school attributes.
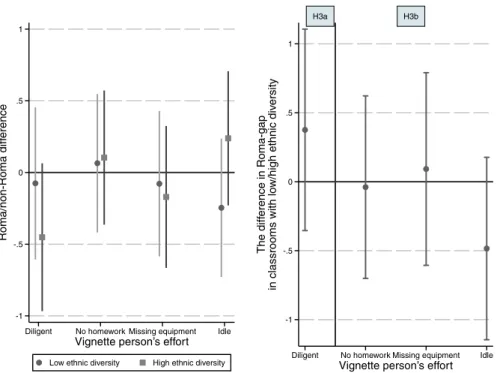
We find the Roma/non-Roma gap in the estimated popularity of a vignette person with good GPA (pro-school attributes) to be significantly higher (β5 = 0.826; p = 0.016) in class- rooms with low ethnic diversity relative to classrooms with high ethnic diversity (see the right-hand panel of Fig. 4). Therefore, our results support H3a. The positive interaction- coefficient (β5) shifts the Roma/non-Roma gap measured in ethnically highly diverse class- rooms (β2) in a positive direction. Nevertheless, in classrooms with low ethnic diversity, the Roma/non-Roma gap is not significant (coef. = 0.31; p = 0.221).
The relative difference in the Roma gap according to classrooms’ ethnic diversity is significantly less in terms of non-pro-school attributes than in pro-school attributes. For example, the difference in the Roma/non-Roma gap between classrooms with low ver- sus high ethnic diversity in the case of a vignette person with a poor GPA is significantly lower (β7 = − 1.480; p < 0.001) than the same relative difference in good GPA (β5 = 0.826;
p = 0.016).
We find partial support for H3b. Regarding non-pro-school attributes, the relative Roma- gap is smaller (less positive) in classrooms with low ethnic diversity relative to classrooms with high ethnic diversity (Fig. 4, right-hand panel). More specifically, in classrooms with low ethnic diversity, Roma students rate their peers as less popular (coef. = − 0.654 p < 0.05) if they have a poor GPA than in classrooms with high ethnic diversity. The Roma/
non-Roma gap is, however, not significant if the vignette person has an average GPA.
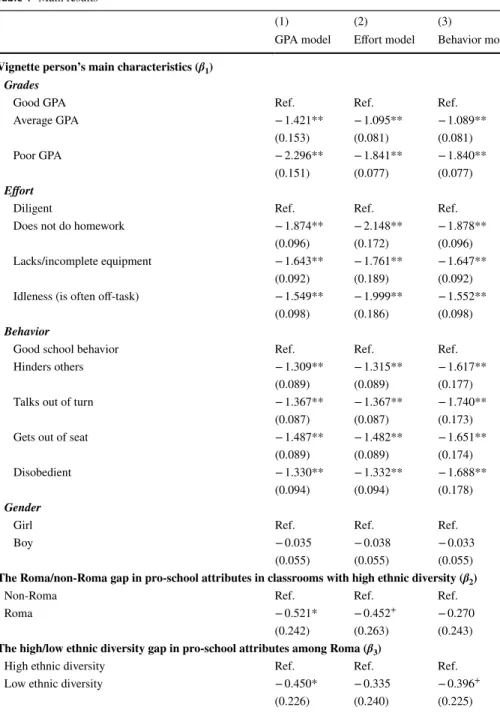
Table 4 Main results
(1) (2) (3)
GPA model Effort model Behavior model Vignette person’s main characteristics (β1)
Grades
Good GPA Ref. Ref. Ref.
Average GPA − 1.421** − 1.095** − 1.089**
(0.153) (0.081) (0.081)
Poor GPA − 2.296** − 1.841** − 1.840**
(0.151) (0.077) (0.077)
Effort
Diligent Ref. Ref. Ref.
Does not do homework − 1.874** − 2.148** − 1.878**
(0.096) (0.172) (0.096)
Lacks/incomplete equipment − 1.643** − 1.761** − 1.647**
(0.092) (0.189) (0.092)
Idleness (is often off-task) − 1.549** − 1.999** − 1.552**
(0.098) (0.186) (0.098)
Behavior
Good school behavior Ref. Ref. Ref.
Hinders others − 1.309** − 1.315** − 1.617**
(0.089) (0.089) (0.177)
Talks out of turn − 1.367** − 1.367** − 1.740**
(0.087) (0.087) (0.173)
Gets out of seat − 1.487** − 1.482** − 1.651**
(0.089) (0.089) (0.174)
Disobedient − 1.330** − 1.332** − 1.688**
(0.094) (0.094) (0.178)
Gender
Girl Ref. Ref. Ref.
Boy − 0.035 − 0.038 − 0.033
(0.055) (0.055) (0.055)
The Roma/non-Roma gap in pro-school attributes in classrooms with high ethnic diversity (β2)
Non-Roma Ref. Ref. Ref.
Roma − 0.521* − 0.452+ − 0.270
(0.242) (0.263) (0.243)
The high/low ethnic diversity gap in pro-school attributes among Roma (β3)
High ethnic diversity Ref. Ref. Ref.
Low ethnic diversity − 0.450* − 0.335 − 0.396+
(0.226) (0.240) (0.225)
Roma/non-Roma gap in non-pro-school attributes in classrooms with high ethnic diversity relative to the Roma/non-Roma gap in pro-school attributes in classrooms with high ethnic diversity (β4)
Good GPA × Roma Ref.
Average GPA × Roma 0.590**
(0.201)
Poor GPA × Roma 0.786**
(0.203)
Table 4 (continued)
(1) (2) (3)
GPA model Effort model Behavior model
Diligent × Roma Ref.
Does not do homework × Roma 0.556*
(0.227)
Lacks/incomplete equipment × Roma 0.281
(0.254)
Idleness (is often off-task) × Roma 0.690**
(0.244)
Good behavior × Roma Ref
Hinders others × Roma 0.248
(0.239)
Talks out of turn × Roma 0.505*
(0.232)
Gets out of seat × Roma 0.186
(0.233)
Disobedient × Roma 0.448*
(0.194) The Roma/non-Roma gap in pro-school attributes in classrooms with low ethnic diversity relative to
classrooms with high ethnic diversity (β5)
Roma × High ethnic diversity Ref. Ref. Ref.
Roma × Low ethnic diversity 0.826* 0.376 0.439
(0.343) (0.373) (0.343)
The pro-school/non-pro-school gap in classrooms with low ethnic diversity relative to classrooms with high ethnic diversity (β6)
Good GPA × Low ethnic diversity Ref.
Average GPA × Low ethnic diversity 0.413*
(0.164)
Poor GPA × Low ethnic diversity 0.611**
(0.165)
Diligent × Low ethnic diversity Ref.
Does not do homework × Low ethnic diversity 0.256 (0.182) Lacks/incomplete equipment × Low ethnic diversity 0.113
(0.209) Idleness (is often off-task) × Low ethnic diversity 0.538**
(0.199)
Good behavior × Low ethnic diversity Ref
Hinders others × Low ethnic diversity 0.448*
(0.194)
Talks out of turn × Low ethnic diversity 0.500**
(0.189)
Gets out of seat × Low ethnic diversity 0.261
(0.189)
Disobedient × Low ethnic diversity 0.527**
(0.193)
Results in relative differences are, therefore, consistent with the findings of Bisin et al. (2011). The relative Roma/non-Roma gap is greater in classrooms with high ethnic Table 4 (continued)
(1) (2) (3)
GPA model Effort model Behavior model The difference between pro-school and non-pro-school attributes in the difference in the Roma/non-
Roma gap in classrooms with low relative to high ethnic diversity (β7) Good GPA × Roma × Low ethnic diversity Ref.
Average GPA × Roma × Low ethnic diversity − 0.971**
(0.282) Poor GPA × Roma × Low ethnic diversity − 1.480**
(0.283)
Diligent × Roma × Low ethnic diversity Ref.
Does not do homework × Roma × Low e. div. − 0.415
(0.319) Lacks/incomplete equipment × Roma × Low e. div. − 0.284 (0.357) Idleness (is often off-task) × Roma × Low e. div. − 0.861*
(0.343)
Good behavior × Roma × Low ethnic diversity Ref.
Hinders others × Roma × Low ethnic diversity − 0.471
(0.333)
Talks out of turn × Roma × Low ethnic diversity − 0.826*
(0.325)
Gets out of seat × Roma × Low ethnic diversity − 0.493
(0.328)
Disobedient × Roma × Low ethnic diversity − 0.924**
(0.336) Respondent’s baseline characteristics (β8 coefficient)
Girl − 0.297* − 0.298* − 0.292*
(0.121) (0.121) (0.121)
Age − 0.018 − 0.018 − 0.018
(0.093) (0.093) (0.093)
GPA − 0.156* − 0.156* − 0.156*
(0.073) (0.073) (0.073)
Vignette characteristics Yes Yes Yes
Constant 7.766** 7.731** 7.713**
(1.391) (1.395) (1.392)
Number of vignettes 6969 6969 6969
Number of respondents 584 584 584
Number of classrooms 38 38 38
ll − 14,817 − 14,824 − 14,823
chi2 3356** 3336** 3337**
All models contain classroom and student random effects Standard errors in parentheses: **p < 0.01; *p < 0.05; +p < 0.1
diversity. Specifically, the Roma/non-Roma gap is smaller (more negative) in pro-school attributes, and higher (more positive) at least in some non-pro-school attributes. These findings support the assumption that oppositional culture serves to defend ethnic bound- aries in ethnically more heterogeneous classrooms. The absolute Roma/non-Roma gap is not significant, however, as the left-hand panel in Fig. 4 shows, either in class- rooms with low (coef. = − 0.389; p = 0.101) or in classrooms with high (coef. = 0.265;
p = 0.246) ethnic diversity.
In sum, our results do not confirm H1 and H2 about the negative Roma/non-Roma gap in pro-school (H1) and the positive Roma/non-Roma gap in non-pro-school attrib- utes (H2) in general (Fig. 3). Our findings do partially confirm the assumed relative differences in the Roma/non-Roma gap between classrooms with low and high ethnic diversity. Namely, we found the Roma/non-Roma gap to be higher (less negative) in pro-school attributes in classrooms with low ethnic diversity than in classrooms with high ethnic diversity (H3a). Furthermore, in some (poor GPA) but not all non-pro- school attributes we found (H3b) the Roma/non-Roma gap to be lower (less positive) in non-pro-school attributes in classrooms with low ethnic diversity than in classrooms with high ethnic diversity (H3b).
Notably, however, the relative differences (analyzed in H3a and H3b) are less impor- tant, since the Roma/non-Roma gap is only significant in pro-school attributes in class- rooms with high ethnic diversity. More specifically, Roma students estimate their peers in ethnically highly diverse classrooms as less popular if their peers have a good GPA than in classrooms with low ethnic diversity (Fig. 4 left-hand panel).
Figures 5 and 6 (the corresponding models are in Column 2 and 3 in Table 4, respectively) show qualitatively the same results for vignette persons’ effort (Fig. 5) and school behavior
H1 H2
-.6-.4 -.2.2.40
Good GPA Average GPA Poor GPA
Vignette person’s GPA
H1 H2
-.6-.4 -.2.2.40
Roma/non-Roma difference
Diligent No homework Missing equipment Idle
Vignette person’s effort
H1 H2
-.6-.4 -.2.2.40
Good behavior Hinders others Talks out of turn Gets out of seat Disobedient Vignette person’s school behavior
Fig. 3 Tests for H1 and H2 in terms of vignette person’s GPA, effort, and school behavior
-1 -.5 0 .5 1
Roma/non-Roma difference
Good GPA Average GPA Poor GPA
Vignette person’s GPA
Low ethnic diversity High ethnic diversity
H3a H3b
-2 -1 0 1 2
The difference in Roma-gap in classrooms with low/high ethnic diversity
Good GPA Average GPA Poor GPA
Vignette person’s GPA
Fig. 4 Roma/non-Roma gap according to vignette persons’ GPA and the ethnic diversity of students’ class- room
-1 -.5 0 .5 1
Roma/non-Roma difference
Diligent No homework Missing equipment Idle
Vignette person’s effort
Low ethnic diversity High ethnic diversity
H3a H3b
-1 -.5 0 .5 1
The difference in Roma-gap in classrooms with low/high ethnic diversity
Diligent No homework Missing equipment Idle
Vignette person’s effort
Fig. 5 Roma/non-Roma gap according to vignette person’s effort and the ethnic diversity of students’ class- rooms
(Fig. 6) to those we found for their GPA. Overall, Roma and non-Roma differences are not significant either in pro-school or in non-pro-school attributes. Furthermore, the differences in classrooms with low versus high ethnic diversity are also statistically not significant.
The data do not support H1 and H2 (see the corresponding charts in Fig. 3), and the relative differences assumed in H3a and H3b are also statistically not significant.
Based on these results, oppositional culture is not found to be prevalent in students’ effort and school behavior either in pro-school or in non-pro-school attributes, and differences between classrooms with low/high ethnic diversity are also statistically not significant.
5 Discussion
The research for this paper inquired into the emergence of oppositional culture in Hungar- ian primary education (lower-secondary level in international classification). OCT argues that peer pressure prevents minority students from doing well in schools (Ogbu 2003).
Minority students might restrict and camouflage their academic achievement to secure their peers’ acceptance (Fordham and Ogbu 1986).
The economic literature argues, furthermore, that oppositional culture is more preva- lent in classrooms with high ethnic diversity (Bisin et al. 2011) in which oppositional culture protects minority students’ ethnic identity by reinforcing the distinction between them and majority students.
We analyzed how Roma and non-Roma students judged their peers’ coolness in eth- nically diverse Hungarian classrooms. Thus, we extended OCT to a different ethnic
-1 -.5 0 .5 1
Roma/non-Roma difference
Good behavior Hinders others Talks out of turn Gets out of seat Disobedient
Vignette person’s school behavior
Low ethnic diversity High ethnic diversity
H3a H3b
-1 -.5 0 .5 1
The difference in Roma-gap in classrooms with low/high ethnic diversity
Good behavior Hinders others Talks out of turn Gets out of seat Disobedient
Vignette person’s school behavior Fig. 6 Roma/non-Roma gap according to vignette person’s school behavior and the ethnic diversity of stu- dents’ classrooms
group to the African American community, which is currently the most researched eth- nic minority in terms of OCT.
We conducted a survey experiment in which the characteristics of peers (vignette per- sons) varied randomly, so there was no correlation between the characteristics of students and vignette persons which could bias our estimations. We compared Roma and non- Roma students’ judgments about their peers’ coolness in classrooms with low/high ethnic diversity to find out how the ethnic composition of classrooms influences the emergence of oppositional culture. Our analysis targeted pro-school and non-pro-school attributes to assess how widespread oppositional culture is in ethnically mixed Hungarian schools.
Based on the related results we can at most claim that oppositional culture is sporadically prevalent among Roma/non-Roma students in Hungarian schools. Roma students judged their peers with good GPA as less popular in classrooms with high ethnic diversity. In other domains (students’ effort and school behavior), we were neither able to detect oppositional culture in general, nor to find differences in oppositional culture between classrooms with low/high ethnic diversity. The Roma and non-Roma differences are, furthermore, not preva- lent in any of the non-pro-school attributes. Roma students might not restrict or camouflage their school achievement, since they are not appraised positively for doing this by their peers.
In sum, in classrooms with high ethnic diversity, the need of minority students to define their ethnic identity in opposition to majority students is restricted to academic achievement, and it is not generally prevalent in different domains like students’ effort or school behavior.
Thus, oppositional culture is localized and it is not widespread, which might imply that the Roma/non-Roma achievement gap has predominantly non-cultural explanations.
Furthermore, our specific results for classrooms with high ethnic diversity speak for a non-linear relationship between the share of Roma in classrooms and the prevalence of an oppositional culture. Thus our results explain why linear approximation between the share of Roma and oppositional culture (Kisfalusi 2018) did not produce significant results.
Importantly, our results do not reveal that Roma students appraise their peers as more popular if they develop non-pro-school attributes. Thus, they do not support the claim of OCT that by restricting or camouflaging academic achievement minority students can become popular with their peers (Fordham and Ogbu 1986). We found that non-pro-school attributes are universally rejected by Roma, and also by non-Roma students.
Our results contradict, furthermore, prior research (Hajdu et al. 2019) showing that high- achieving Roma students are appreciated by their peers in Hungarian schools, since these students have more friends and fewer adversaries. Our findings point out important differ- ences in the peer environment, supporting the claim that a heterogeneous peer environment (Bisin et al. 2011) fuels an oppositional culture. In contrast to in classrooms with low ethnic diversity, in classrooms with high ethnic diversity the few inter-ethnic contacts and rare inter- ethnic friendship networks (Boda and Néray 2015) might foster the need for the development of oppositional attitudes which help defend and define minority students’ ethnic identity.
Nevertheless, belonging to the Roma minority is a much less objective and visible char- acteristic than belonging to the African American minority. Some surnames are common to Roma, but the phenotypical features of Roma people are sometimes not obvious. There- fore, irrespective of “objective” features, Roma identity is more likely to involve the inter- play between self-perception and peers’ attributions. Thus the fluid boundaries of Roma identity (Boda 2019) and the less visible phenotypical features of ethnicity among the Roma might restrict the extension of OCT to the Roma.
The causes of an ethnic achievement gap in Hungarian schools, therefore, are context specific. The latter is restricted to academic achievement and is specific for classrooms with high ethnic diversity. This very specific occurrence of oppositional culture in Hungary
means that the ethnic achievement gap, in general is not rooted in the fear of loss of pop- ularity for being an achiever. However Results imply, however, that mixing Roma and non-Roma students in the same classrooms can potentially induce oppositional attitudes between Roma and non-Roma students at least in terms of how they rate peers with good GPA. Future research should reveal how Roma students’ school performance is hindered by oppositional attitudes in classrooms with high ethnic diversity.
Acknowledgements This research is funded by a grant from the Hungarian National Research, Development and Innovation Office (NKFIH), Grant Number: FK 125358. The support from the János Bolyai Research Scholarship of the Hungarian Academy of Sciences and from the New National Excellence Program (ÚNKP) of the Ministry of Human Capacities are acknowledged (Grant Number: ÚNKP-19-4-BCE-07).
Appendix