ROCplot.org: Validating predictive biomarkers of
chemotherapy/hormonal therapy/anti-HER2 therapy using transcriptomic data of 3,104 breast cancer patients
János T. Fekete 1and Balázs Győrffy1,2
12ndDepartment of Pediatrics, Semmelweis University, Budapest, Hungary
2MTA TTK Lendület Cancer Biomarker Research Group, Institute of Enzymology, Hungarian Academy of Sciences, Budapest, Hungary
Systemic therapy of breast cancer can include chemotherapy, hormonal therapy and targeted therapy. Prognostic biomarkers are able to predict survival and predictive biomarkers are able to predict therapy response. In this report, we describe the initial release of thefirst available online tool able to identify gene expression-based predictive biomarkers using
transcriptomic data of a large set of breast cancer patients. Published gene expression data of36publicly available datasets were integrated with treatment data into a unified database. Response to therapy was determined using either author-reported pathological complete response data (n=1,775) or relapse-free survival status at5years (n=1,329). Treatment data includes chemotherapy (n=2,108), endocrine therapy (n=971) and anti-human epidermal growth factor receptor2(HER2) therapy (n=267). The transcriptomic database includes20,089unique genes and54,675probe sets. Gene expression and therapy response are compared using receiver operating characteristics and Mann–Whitney tests. We demonstrate the utility of the pipeline by cross-validating23paclitaxel resistance-associated genes in different molecular subtypes of breast cancer. An additional set of established biomarkers including TP53for chemotherapy in Luminal breast cancer (p=1.01E-19, AUC =0.769), HER2for trastuzumab therapy (p=8.4E-04, AUC =0.629) and PGR for hormonal therapy (p=8.6E-05, AUC =0.7), are also endorsed. The tool is designed to validate and rank new predictive biomarker candidates in real time. By analyzing the selected genes in a large set of independent patients, one can select the most robust candidates and quickly eliminate those that are most likely to fail in a clinical setting. The analysis tool is accessible at www.rocplot.org.
Key words:chemotherapy, hormonal therapy, targeted therapy, ROC, relapse-free survival, molecular subtypes
Abbreviations:ABCB1: ATP binding cassette subfamily B member 1; ABCB11: ATP binding cassette subfamily B member 11; AUC: area under the curve; BBC3: BCL2 binding component 3; BCAP29: B cell receptor-associated protein 29; BCL2: BCL2 apoptosis regulator; BCL2L1:
BCL2 like 1; BMF: BCL2 modifying factor; CMF: cyclophosphamide, methotrexate,fluorouracil; CNGA3: cyclic nucleotide gated channel alpha 3; CSAG2: CSAG family member 2; CYP2C8: cytochrome P450 family 2 subfamily C member 8; CYP3A4: cytochrome P450 family 3 subfamily A member 4; ERBB2: erb-b2 receptor tyrosine kinase 2; ESR1: estrogen receptor 1; FAC:fluorouracil, adriamycin, cytoxan; FDR: false discovery rate; FEC:fluorouracil, epirubicin, cyclophosphamide; FN1:fibronectin 1; GBP1: guanylate binding protein 1; GEO: Gene Expression Omnibus;
HER2: human epidermal growth factor receptor 2; MAP2: microtubule-associated protein 2; MAP4: microtubule-associated protein 4; MDR:
multiple drug resistance; MIAME: minimum information about a microarray experiment; MKI67: marker of proliferation Ki-67; OPRK1: opi- oid receptor kappa 1; pCR: pathological complete response; PGR: progesterone receptor; RFS: relapse-free survival; ROC: receiver operating characteristic; SLCO1B3: solute carrier organic anion transporter family member 1B3; TNBC: triple-negative breast cancer; TP53: tumor pro- tein p53; TUBB1: tubulin beta 1 class VI; TUBB4: tubulin beta 4A class IVa; TWIST1: twist family bHLH transcription factor 1
Additional Supporting Information may be found in the online version of this article.
Grant sponsor:National Research, Development and Innovation Office, Hungary;Grant numbers:KH-129581, NVKP_16-1-2016-0037, 2018-1.3.1-VKE-2018-00032
DOI:10.1002/ijc.32369
This is an open access article under the terms of the Creative Commons Attribution-NonCommercial-NoDerivs License, which permits use and distribution in any medium, provided the original work is properly cited, the use is non-commercial and no modifications or adaptations are made.
History:Received 9 Feb 2019; Accepted 17 Apr 2019; Online 24 Apr 2019.
Correspondence to:Balázs Győrffy, MD, PhD, DSc, Lendület Cancer Biomarker Research Group, MTA TTK, Institute of Enzymology, Magyar tudósok körútja 2, H-1117, Budapest, Hungary, E-mail: gyorffy.balazs@ttk.mta.hu
Tumor Markers and Signatures
What’s new?
While several online tools capable of delivering a prognostic prediction for breast cancer already exist, no such genome-wide biomarker validation tool is available to evaluate and compare predictive biomarker candidates. Here, the authors combine multiple datasets to establish a sufficiently large breast cancer cohort with transcriptomic, anticancer treatment, and clinical response data. Then, they establish a framework capable of studying new candidate genes by mining this database and demonstrate the robustness of the pipeline by cross-validating an established set of resistance-associated genes. The novel online platform provides an easily accessed resource for researchers to validate and rank future biomarker candidates.
Introduction
A biomarker is a scientifically supported analytical tool with a clinically useful significance. A biomarker can be measured in a test system and has a recognized characteristic that enables researchers to use it for support in making decisions in phar- macology, physiology or toxicology. Today, the Food and Drug Administration (FDA) encourages the use of biomarkers to increase the efficacy of new drugs.1 In cancer treatment, two major types of biomarkers can be implemented. Prognos- tic biomarkers are able to predict patient survival and predic- tive biomarkers are able to predict the response to a selected anticancer therapy.2
Depending on the molecular and pathological characteris- tics of a tumor and the projected survival of the patient, sys- temic therapy of breast cancer can include chemotherapy, hormonal therapy, and molecular targeted therapy. Each of these therapies is supported by prognostic and predictive bio- markers. Estrogen receptor and progesterone receptor are the most important predictive biomarkers to select those eligible for hormonal therapy.3Molecular targeted therapy is given to those whose tumors harbor an amplification or overexpression of the erb-b2 receptor tyrosine kinase 2 (ERBB2)/human epi- dermal growth factor receptor 2 (HER2) receptor.4Multigene tests can provide support to select those most benefiting from chemotherapy (for a comprehensive review, see Ref. 2).
Response to an anticancer agent depends on pharmacologi- cal (dose, pharmacokinetics and localization of the tumor) and cellular factors. This second group of cellular factors can be further subdivided according to three major mechanisms of action. First, the intracellular drug concentration can be decreased in cases where transmembrane transport systems are activated5 or when the agent is intracellularly metabo- lized.6 Second, an altered interaction between the drug and the target can lead to lower efficiency of a given drug.7Third, a change in the cellular response, including mutations and expression changes in genes related to cell cycle, DNA repair8 and apoptosis9can also allow cancer cells to evade the effects of systemic anticancer therapy.
In the last decade, several online tools capable of delivering a prognostic prediction were developed for breast cancer.
Almost all of these tools include a platform linking survival and gene expression (see KM-plotter,10 PROGgene,11 GenExMiner,12APPEX,13KMexpress14or PPISURV15). Other tools use miRNA expression (miRpower,16 BreastMark17) or
estimate survival for a given patient (RecurrenceOnline18).
However, to date, no such genome-wide biomarker validation tool has been made available to evaluate and compare predic- tive biomarker candidates.
In our study, we report an online platform enabling the identification of predictive biomarkers in breast cancer. Multi- ple transcriptome-level gene expression datasets were inte- grated into a single database containing 3,104 breast cancer patients with treatment and response data. Responder and nonresponder patients are comparedviatwo diverse statistical approaches. In the second part of the project, prediction results delivered by the pipeline are used to validate clinically used and previously proposed biomarker candidates.
Methods
Database construction
Breast cancer datasets were identified in Gene Expression Omnibus (GEO; http://www.ncbi.nlm.nih.gov/gds) using the GEO platform IDs“GPL96”(for HG-U133A),“GPL570”(for HG-U133 Plus 2.0), “GPL571” (for HG-U133A_2) and the keywords“breast,” “cancer”and “therapy.”Datasets with less than 30 samples were excluded at this stage (a few datasets included more than 30 specimens initially, but some of the samples dropped out because only a reduced amount of patient samples were actually useful for our study). We selected the above platforms because they are widely used and because they use the exact same probes to measure the same genes. For genes with multiple probes, we used Jetset19 to select the most reliable probe set (http://www.cbs.dtu.dk/
biotools/jetset/).
The raw CELfiles were MAS5 normalized in the R statisti- cal environment (http://www.r-project.org) using the Affy Bioconductor library. A second scaling normalization was per- formed to set the mean expression of the 22,277 identical probe sets in each array to 1,000 to reduce batch effects due to different mean targets during normalization of the three human genome arrays (Supporting Information Fig. S1).
Repeatedly published arrays (n= 46) were identified by searching for identical expression values. Of these arrays, only thefirst one was retained in thefinal database.
Quality control
Each included study fulfilled the Minimum Information About a Microarray Experiment (MIAME) criteria—description of
Tumor Markers and Signatures
extraction protocol, hybridization protocol, scan protocol and data processing.
Quality control of the gene chips was performed as described previously.18In brief, each array was examined for background intensity, scaling factor, percentage of present calls, bioB-, bioC-, bioD-, cre-, dap-, lys-, phe-, thr- and tryp- spikes, and glyceraldehyde-3-phosphate dehydrogenase (GAPDH) and beta-actin 30–50 ratio. Arrays with more than one parame- ter outside of the 95% range across all arrays were excluded from further analysis.
Some of the datasets used samples from randomized clini- cal trials. As the reliability of clinical data collected in these studies can be superior to those not from a clinical trial, we marked each of these studies.
Receptor status determination
Patients were assigned into molecular subtypes based on the expression of estrogen receptor 1 (ESR1), HER2 and marker of proliferation Ki-67 (MKI67). For ESR1, the probe set 205225_at was used with a cutoff value of 500, for the HER2 receptor, the probe set 216836_s_at was used with a cutoff value of 4,800 and for MKI67, the probe set 212021_s_at was used with a cutoff value of 470.18We compared the gene-array based receptor designations to the IHC-based receptor designa- tions in patients where IHC data was available and found sub- stantial agreement in both the RFS and pathological complete response (pCR) cohorts (Supporting Information Table S1).
Statistical methods
First, the patients are assigned to two cohorts (responder and nonresponder) based on their clinical characteristics. Patients with neoadjuvant chemotherapy were classified according to pathological response as published by the authors. In this, instead of four cohorts (progressive disease, stable disease, partial response and complete response), we have assigned all patients into two cohorts, including those where no residual histological evidence of the tumor remains after chemotherapy (responders) and all other patients with residual tumor tissue (nonresponders).
Patients with adjuvant therapy were classified into two cohorts based on survival status at 5-year follow-up. In this case, expression of the gene in patients relapsed before 5 years is compared to the expression of the gene in patients surviving over 5 years. Patients censored before 5 years are excluded.
The two cohorts are compared using Mann–Whitney test or Receiver Operating Characteristic test in the R statistical environ- ment (www.r-project.org) using Bioconductor libraries (www.
bioconductor.org). Statistical significance was set atp< 0.05.
Validation of established markers and discovery of new candidates
First, we evaluated a set of commonly referenced predictive biomarkers including progesterone receptor (PGR), HER2 and tumor protein p53 (TP53).
A more exciting validation analysis was executed to con- firm previously published paclitaxel resistance biomarkers.
To this end, we used an established set of 31 genes.20 From the 31-gene panel, we analyzed 29 genes because the Affymetrix chip does not have probes to CSAG family mem- ber 2 (CSAG2) and because the expression of tubulin beta 4A class IVa (TUBB4A) and TUBB4B are combined in the TUBB4 probe set. The study of Dorman et al. was selected because of two major advantages: first, they used support vector machines, an approach different from our analysis pipeline. Second, the genes identified in their analysis were independently validated using tumor blocks from a panel of 340 independent patients. In this instance, the receiver oper- ating characteristic (ROC) plotter was used to compute path- ological complete response (pCR) based classifications for each of the proposed genes in each of the molecular sub- types. To this end, we used all of the samples in which the clinical file confirmed the administration of paclitaxel as a chemotherapy agent.
Finally, we performed the analysis across all genes in triple-negative breast cancer (TNBC) patients to identify new biomarker candidates of chemotherapy resistance specifically in this cohort. For this, ESR1- and HER2-negative patients were designated as TNBC, HER2-positive and ESR1-negative patients were designated as HER2, ESR1-positive and MKI67-negative patients were designated as Luminal A, and all remaining samples were designated as Luminal B patients.
Results
Database—pCR dataset
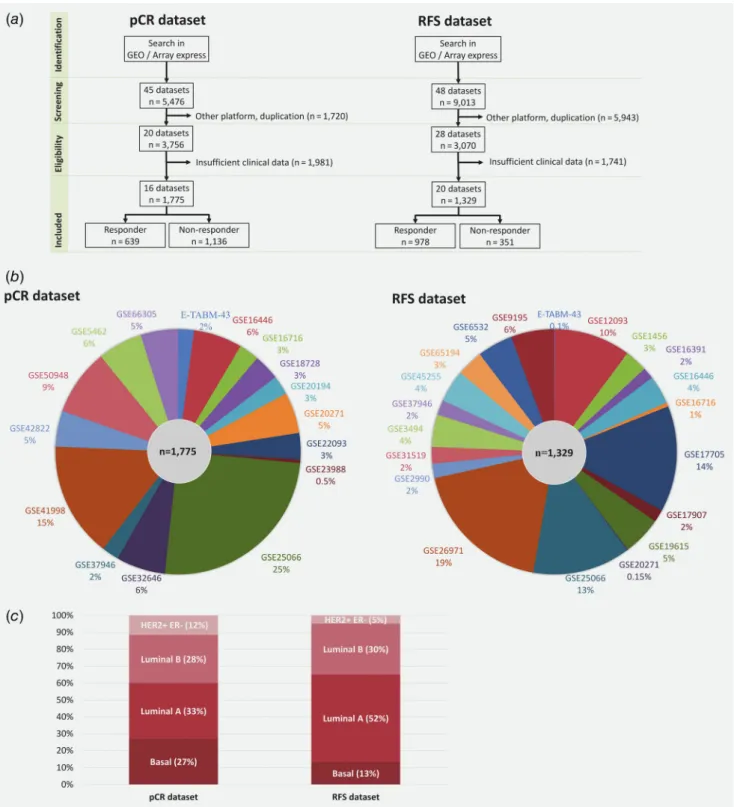
Processing of the GEO samples is summarized in Figure 1a.
Overall, 5,476 breast cancer patients were identified in GEO with relapse data. After exclusion of repeatedly published arrays and samples measured using a different platform, 3,756 patients from 20 datasets remained. Sufficient clinical data were available for 1,775 patients from 16 datasets (Fig. 1b).
Aggregate clinical characteristics of the pCR samples are pres- ented in Table 1aand Figure 1c.
Database—RFS dataset
Overall, 9,013 breast cancer patients with follow-up data were identified in GEO. Of these patients, 3,070 samples from 28 datasets represent unique samples measured by the Human Genome Arrays. Sufficient clinical data, including relapse-free survival (RFS) time and treatment data, were available for 1,329 patients from 20 datasets (Fig. 1b). Aggregate clinical characteristics of the RFS samples are presented in Table 1b and Figure 1c.
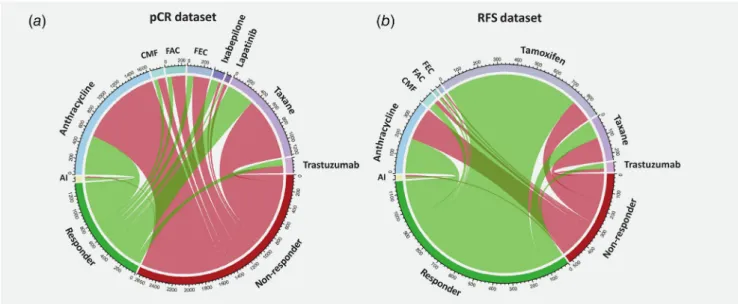
Treatment cohorts
Most patients in the pCR cohort have received cytotoxic che- motherapy, including a regimen containing an anthracycline (n= 1,626) or taxane (n= 1,213). Smaller cohorts comprise patients with cyclophosphamide, methotrexate, fluorouracil
Tumor Markers and Signatures
(CMF; n= 156), fluorouracil, epirubicin, cyclophosphamide (FEC; n= 303) or fluorouracil, adriamycin, cytoxan (FAC;
n= 248) protocols and patients with ixabepilone (n= 136), lapatinib (n= 65) and trastuzumab (n= 186) treatments. A
minor group of patients was administered hormonal therapy (aromatase inhibitors).
Two-thirds of patients in the RFS cohort have received a hormonal therapy (n= 907). The most common chemotherapy
Figure1.Overview of database setup. Pipeline used to select samples to be included in the pathological response (pCR dataset) and in the relapse-free survival (RFS dataset) cohorts (a), proportion of datasets included in each cohort (b) and distribution of molecular subtypes (c). [Colorfigure can be viewed at wileyonlinelibrary.com]
Tumor Markers and Signatures
Table1.Overviewofdatasetsincludedintheanalysiswithavailableresponsedata(a)andsurvivalandfollow-upat5years(b) (a) DatasetPlatformReference (PMID)YearSample sizeAgeOutcome(responder/ nonresponder)Grade (1/2/3)Nodal status(0/1)Molecularsubtype (Basal/LumA/LumB/HER2+) E-TABM-43HG-U133A17,388,66120073748.5112.511/26−/14/23–7/14/10/6 GSE5462HG-U133A17,885,6192007104–74/30––−/101/3/− GSE16716HG-U133A20,676,07420104754.3811.218/29−/13/342/64/6/24/13 GSE18728HG-U133_PLUS_220,012,355201061–23/38––14/35/10/2 GSE20194HG-U133A20,064,23520104551.9111.57/38−/8/269/279/10/19/7 GSE20271HG-U133A20,829,32920109650.7510.312/845/30/4138/5721/18/48/9 GSE16446HG-U133_PLUS_221,422,4182011114–16/982/20/8752/6283/3/4/24 GSE22093HG-U133A21,191,11620116250.0311.325/372/19/3918/1820/7/28/7 GSE23988HG-U133A21,191,1162011849.389.87/1−/3/41/72/2/4/− GSE25066HG-U133A21,558,518201144849.7210.585/36328/157/230151/294128/121/194/5 GSE32646HG-U133_PLUS_222,320,227201111551.4910.327/8816/78/2132/8323/49/30/13 GSE37946HG-U133A22,460,78920124047.9011.023/17−/10/2932/84/2/25/9 GSE42822HG-U133A23,158,47820128449.538.936/48−/20/4929/5218/36/13/17 GSE41998HG-U133A_223,340,299201327048.4110.6201/69––113/122/15/20 GSE50948HG-U133_PLUS_224,443,618201415651.679.953/103−/67/86–28/37/46/45 GSE66305HG-U133_PLUS_226,245,675201588–27/61––6/22/32/28 Total1,77550.0410.59639/113653/439/669364/612480/585/505/205 (b) DatasetPlatformReference (PMID)YearSample sizeAgeOutcome(responder/ nonresponder)Grade (1/2/3)Nodal status(0/1)Molecularsubtype (Basal/LumA/LumB/HER2+) GSE1456HG-U133A16,280,042200540–26/14−/7/30–16/2/21/1 GSE3494HG-U133A16,141,321200557–35/22––−/36/21/− GSE2990HG-U133A16,478,745200625–18/713/−/12–−/20/5/− E-TABM-43HG-U133A17,388,66120071–0/1––−/−/1/− GSE6532HG-U133A17,401,01220076260.7210.348/14−/41/−39/16−/47/13/2 GSE9195HG-U133_PLUS_218,498,62920087664.309.267/914/20/2440/361/65/10/− GSE12093HG-U133A18,821,0122009134–122/12––−/103/31/− GSE16391HG-U133_PLUS_219,573,22420092059.908.810/10−/11/99/11−/14/6/− GSE16716HG-U133A20,064,2352010754.439.75/2−/−/7−/71/−/2/4 GSE17705HG-U133A20,697,0682010186–158/28–105/765/95/86/− GSE17907HG-U133_PLUS_220,932,29220102253.9511.912/102/4/138/9−/−/5/17 GSE19615HG-U133_PLUS_220,098,42920106853.1811.457/1119/19/3034/3411/34/16/7 GSE20271HG-U133A20,829,3292010263.5013.4−/2−/1/1–−/−/1/1 (Continues)
Tumor Markers and Signatures
agents include anthracyclines (n= 383) and taxanes (n= 237).
Smaller groups of patients were treated with trastuzumab (n= 50) and CMF (n= 66). Treatment cohorts with less than 50 patients were excluded from further analysis. A sum- mary of the different treatment regimens, as well as the pro- portion of patients in each of these cohorts, is presented in Figure 2.
Server setup
We have established a webpage for automated analysis of future biomarker candidates. The PHP-based homepage runs an R server in the background and enables mining the data- base via Mann–Whitney or ROC analysis (Fig. 3a) using either the pathological response data or RFS at 5 years (Fig. 3b). Clinical variables (grade, nodal status, receptor sta- tus and molecular subtype) are implemented as filters when selecting any combination of these, then only samples with available information for each parameter are included in the analysis.
Samples collected in a clinical trial include the datasets GSE16446 (clinical trial ID: NCT00017095, NCT00336791), GSE41998 (NCT00455533), GSE50948 (ISRCTN86043495), GSE66305 (NCT00429299) and GSE16391 (NCT00004205).
An additional filter enables to run the analysis using these patients only (n= 628 for the pCR dataset).
ROC also gives a numerical representation of the classi- fier performance when providing the“area under the curve” (AUC) value. An AUC of 0.5 corresponds to no classifica- tion power at all, and an AUC value of 1 denotes a perfect biomarker. In addition to ap-value and an AUC value, the ROC analysis also enables researchers to determine the strongest cutoff capable of best discriminating between responder and nonresponder patients (Fig. 3c). In case, the user enters multiple genes, then false discovery rate (FDR) is computed for each of the genes and a table is displayed showing the results at the FDR cutoffs of 20, 10 and 5%.
The page is registration-free and can be accessed at www.
rocplot.org.
Validation analyses
First, we analyzed a set of established biomarkers, including TP53 for chemotherapy in Luminal breast cancer (p= 1.01E- 19, AUC = 0.769), HER2 for trastuzumab therapy (p= 8.4E-04, AUC = 0.629) and PGR for hormonal therapy (p= 8.6E-05, AUC = 0.7).
Second, we validated a set of paclitaxel-resistance markers.
In this step, each of the biomarker candidates was checked in the pCR cohort. Of the 29 total genes, 23 genes reached signif- icance (Table 2). We have uncovered 16 significant genes in Basal, 15 genes in Luminal A, 8 genes in Luminal B and 5 genes in HER2 + ER−subgroups.
The best-performing genes in the Basal samples were BCL2 modifying factor (BMF; p= 0.023, AUC = 0.688), B cell receptor-associated protein 29 (BCAP29; p= 0.028,
Table1.Overviewofdatasetsincludedintheanalysiswithavailableresponsedata(a)andsurvivalandfollow-upat5years(b)(Continued) (b) DatasetPlatformReference (PMID)YearSample sizeAgeOutcome(responder/ nonresponder)Grade (1/2/3)Nodal status(0/1)Molecularsubtype (Basal/LumA/LumB/HER2+) GSE25066HG-U133A21,558,518201117150.6211.161/1106/58/9445/12660/38/69/4 GSE26971HG-U133A21,807,6382011250–229/21–110/1005/201/43/1 GSE16446HG-U133_PLUS_221,422,418201150–27/23−/9/3624/2638/2/2/8 GSE31519HG-U133A22,220,191201129–9/20−/−/2119/918/−/9/2 GSE37946HG-U133A22,460,78920122647.8812.316/10––3/1/16/6 GSE45255HG-U133A23,618,38020135753.1211.137/205/23/2831/267/16/31/3 GSE65194HG-U133_PLUS_225,848,952201546–41/5––13/13/11/9 Total1,32954.9211.94978/35159/193/305464/476178/687/399/65
Tumor Markers and Signatures
Figure2.Treatment and response data. The circos plots summarize patient distribution for samples included in the pathological response dataset (pCR dataset—a) and in the relapse-free survival-based dataset (RFS dataset—b). The width of the connecting lines is proportional to the relative number of patients. [Colorfigure can be viewed at wileyonlinelibrary.com]
Figure3.Overview of the statistical analysis. The applied computational pipeline (a), the designation of patients into responder and nonresponder cohorts using relapse-free survival at5years (b) and a quick guide for the interpretation of the ROC analysis results (c). [Color figure can be viewed at wileyonlinelibrary.com]
Tumor Markers and Signatures
Table2.Of29previouslypublishedpaclitaxelresistance-relatedgenes21weresignificantwhenevaluatedinthedifferentmolecularsubtypesinthepathologicalcompleteresponse dataset BasalLuminalALuminalBHER2+ER- AffymetrixIDSymbolApprovednamenAUCROC p-valuenAUCROC p-valuenAUCROC p-valuenAUCROC p-value 209993_atABCB1ATPbindingcassettesubfamilyB member12560.5820.0243020.5110.7963780.5450.2081230.6523.73E-03 208288_atABCB11ATPbindingcassettesubfamilyB member112560.6475.81E-053020.5940.0253780.5170.6451230.5920.078 213485_s_atABCC10ATPbindingcassettesubfamilyC member102560.5160.6693020.5760.0693780.5957.91E-031230.5050.927 211692_s_atBBC3BCL2bindingcomponent32560.6092.88E-033020.6184.95E-033780.5650.0671230.6150.028 230150_atBCAP29Bcellreceptorassociatedprotein 29570.6820.0281030.6930.056980.6964.04E-03740.6430.039 207005_s_atBCL2BCL2,apoptosisregulator2560.5860.0183020.7999.61E-133780.5380.2911230.5710.173 215037_s_atBCL2L1BCL2like12560.6151.56E-033020.88.21E-133780.5060.8661230.5840.109 226530_atBMFBcl2modifyingfactor570.6880.0231030.6610.112980.5630.357740.5990.152 207261_atCNGA3Cyclicnucleotidegatedchannel alpha32560.6112.37E-033020.7541.41E-093780.5480.1801230.6681.41E-03 208147_s_atCYP2C8CytochromeP450family2 subfamilyCmember82560.5870.0183020.6146.75E-033780.6043.59E-031230.5890.089 205998_x_atCYP3A4CytochromeP450family3 subfamilyAmember42560.621.03E-033020.6753.19E-053780.5290.4251230.5970.064 212464_s_atFN1Fibronectin12560.5440.2283020.6924.84E-063780.5040.9021230.5910.082 202270_atGBP1Guanylatebindingprotein12560.6219.12E-043020.7896.06E-123780.65.35E-031230.5350.506 225540_atMAP2Microtubule-associatedprotein2570.6220.1421030.5990.329980.6440.034740.5850.217 200836_s_atMAP4Microtubule-associatedprotein42560.5410.2583020.6542.50E-043780.5110.7691230.5320.541 209636_atNFKB2NuclearfactorkappaBsubunit22560.5870.0183020.5680.1043780.5070.8461230.5790.131 207202_s_atNR1I2Nuclearreceptorsubfamily1 groupImember22560.6131.95E-033020.6611.27E-043780.5290.4181230.6220.020 229944_atOPRK1Opioidreceptorkappa1570.6400.0921030.6000.321980.6460.033740.5570.413 206354_atSLCO1B3Solutecarrierorganicanion transporterfamilymember1B32560.6313.30E-043020.7323.06E-083780.5220.5331230.5950.071 204215_atTMEM243Transmembraneprotein2432560.5959.12E-033020.6972.68E-063780.5810.0241230.5510.332 230690_atTUBB1Tubulinbeta1classVI570.5360.6621030.5350.716980.6460.032740.6120.105 212664_atTUBB4Tubulin,beta4classIV2560.6131.95E-033020.721.59E-073780.5220.5311230.5730.162 213943_atTWIST1TwistfamilybHLHtranscription factor12560.5280.4453020.653.60E-043780.5450.2051230.5450.388 Significantgenesaremarkedbyboldtext.
Tumor Markers and Signatures
AUC = 0.682) and ATP binding cassette subfamily B member 11 (ABCB11;p= 5.8E-05, AUC = 0.647). In Luminal A tumors, the most significant genes include BCL2 apoptosis regulator (BCL2; p= 9.6E-13, AUC = 0.799), BCL2 like 1 (BCL2L1;
p= 8.2E-13, AUC = 0.8) and guanylate binding protein 1 (GBP1;p= 6.1E-12, AUC = 0.789). In Luminal B, the stron- gest genes include BCAP29 (p= 4.04E-03, AUC = 0.695), tubulin beta 1 class VI (TUBB1; p= 0.032, AUC = 0.646) and
Figure4.ROC curves and box-plots of top genes validated for Paclitaxel resistance by molecular subtype: BMF in Basal (a), BCL2, BCL2L1and GBP1in Luminal A (b–d), BCAP29in Luminal B (e) and CNGA3in HER2-enriched (f). [Colorfigure can be viewed at wileyonlinelibrary.com]
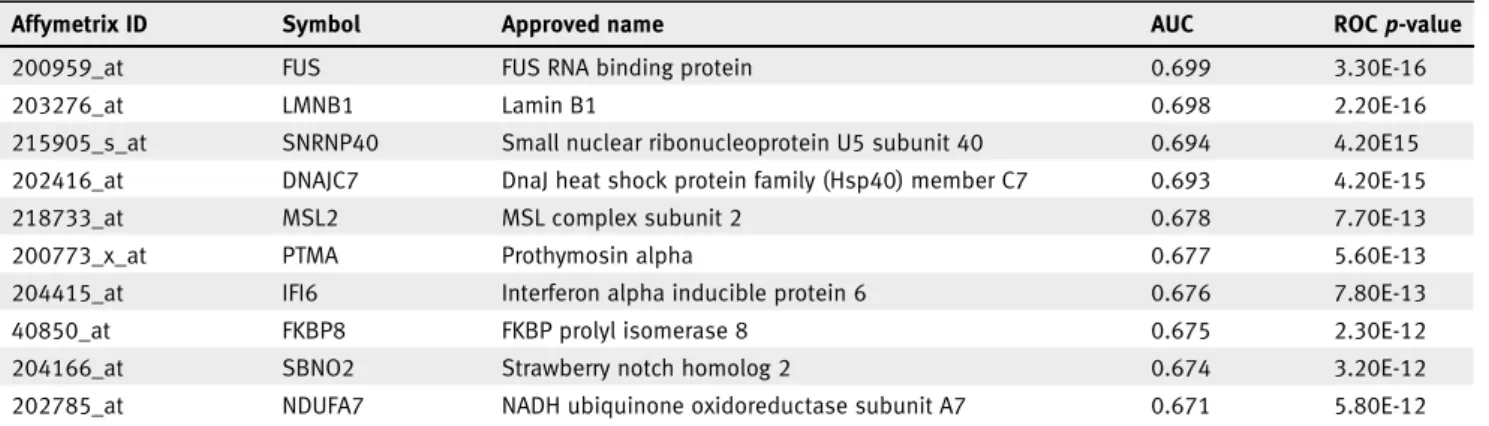
Table 3.Top 10 new biomarker candidates of chemotherapy response in the TNBC subtype (n= 473)
Affymetrix ID Symbol Approved name AUC ROCp-value
200959_at FUS FUS RNA binding protein 0.699 3.30E-16
203276_at LMNB1 Lamin B1 0.698 2.20E-16
215905_s_at SNRNP40 Small nuclear ribonucleoprotein U5 subunit 40 0.694 4.20E15
202416_at DNAJC7 DnaJ heat shock protein family (Hsp40) member C7 0.693 4.20E-15
218733_at MSL2 MSL complex subunit 2 0.678 7.70E-13
200773_x_at PTMA Prothymosin alpha 0.677 5.60E-13
204415_at IFI6 Interferon alpha inducible protein 6 0.676 7.80E-13
40850_at FKBP8 FKBP prolyl isomerase 8 0.675 2.30E-12
204166_at SBNO2 Strawberry notch homolog 2 0.674 3.20E-12
202785_at NDUFA7 NADH ubiquinone oxidoreductase subunit A7 0.671 5.80E-12
The analysis was performed across all genes in the pCR cohort.
Tumor Markers and Signatures
opioid receptor kappa 1 (OPRK1;p= 0.033, AUC = 0.646). In HER2-positive samples, the genes with the highest correla- tion to resistance include cyclic nucleotide gated channel alpha 3 (CNGA3; p= 1.4E-03, AUC = 0.668), the classical multiple drug resistance (MDR) gene ATP binding cassette subfamily B member 1 (ABCB1;p= 3.7E-03, AUC = 0.652) and BCAP29 (p= 0.039, AUC = 0.643). The ROC plots and the mean plots for the best performing genes are presented in Figure 4.
Finally, we run the analysis for all available samples desig- nated as TNBC (n= 473). This exploration was performed in the pCR cohort. The analysis was performed across all genes and the 10 strongest new biomarker candidates are presented in Table 3.
Discussion
In our study, we had two major aims:first, to combine avail- able datasets to establish a sufficiently large breast cancer cohort with transcriptomic and clinical response data, includ- ing information regarding the systemic anticancer therapy administered to these patients. Second, we aimed to establish a framework capable of validating and ranking new candidate genes by mining this database. We also performed a validation analysis for established biomarkers to corroborate the reliabil- ity of our approach.
First, we have executed the pipeline for the most widely used clinical biomarkers, including HER2 and PGR. In each setting, only patients who actually received targeted therapy (for HER2) and hormonal therapy (for PGR) were included.
For HER2, the results confirmed the predictive role of HER2 expression for RFS. Notably, most of the HER2-positive patients included in the database did not receive anti-HER2 therapy. This points to the still limited accessibility of samples with anti-HER2 therapy. Furthermore, the proportion of patients included in these therapies is also limited due to del- ayed administration, even in developed countries such as the US.21We have to note that the proportion of patients desig- nated as HER2-positive also depends on the used cutoff. Cur- rent ASCO recommendations are in favor of lowering the cutoff percentage for ESR1 positivity,22 and such a trend might also be feasible for HER2 status determination. How- ever, the limited number of patients in the trastuzumab- and lapatinib-treated cohorts did not enable us to investigate this hypothesis.
Progesterone receptor (PGR) is an estrogen-regulated gene,23 and its used to support the selection of patients for hormonal therapy has been questioned several times. A study of more than 155,000 women from the SEER registry has uncovered a declining trend of estrogen-negative, PGR- positive patients, possibly hinting at an improvement in recep- tor diagnosis accuracy.24In the United Kingdom, the National Institute for Health and Clinical Excellence recommendations do not have included PGR since 2009.25 In our pipeline, one of the reasons for setting the cutoff to 60 months to
discriminate responder and nonresponder patients was the StGallen/NCCN-recommended 5-year length of hormonal therapy.26 Thus, the used cutoff enables us to identify those who progress during these initial 5 years. As PGR delivered a high significance in our analysis, our results support the con- tinued utilization of PGR to select those who are eligible for hormonal therapy.
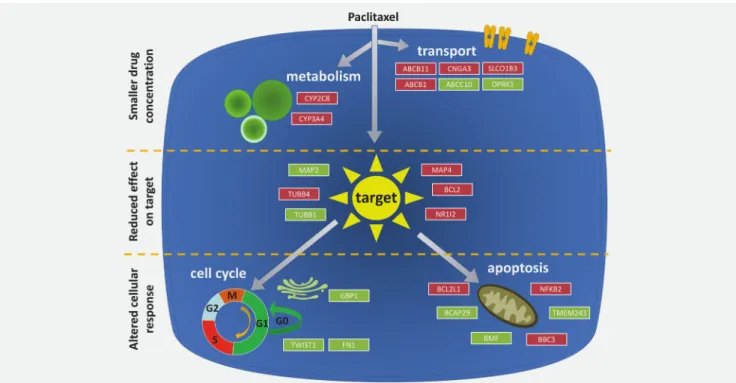
We also used the pipeline to validate previously published paclitaxel resistance biomarker candidates. In this analysis, multiple transport genes were upregulated including ABCB1, ABCB11, CNGA3 and SLCO183. ABCB1 (also called MDR1 or PGP) is one of the most widely investigated genes linked to multidrug resistance. ABCB11 encodes a sister gene of PGP, and ABCB11 transfectants display resistance against Taxol but no other chemotherapy agents.27Solute carrier organic anion transporter family member 1B3 (SLCO1B3) encodes a mem- ber of the organic anion transporter family. This gene’s over- expression confers an antiapoptotic advantage against chemotherapy treatments by blocking the transcription of TP53.28 Lessening the intracellularly available drug molecules is also the mechanism of action of the metabolic enzymes cytochrome P450 family 2 subfamily C member 8 (CYP2C8) and cytochrome P450 family 3 subfamily A member 4 (CYP3A4), both of which display higher expression in the resistant patients and have previously been linked to paclitaxel resistance.29,30
Taxenes disrupt microtubule function and genes involved in microtubule setup and assembly, including TUBB1, TUBB4, microtubule-associated protein 2 (MAP2)31 and microtubule-associated protein 4 (MAP4),32 therefore have a critical role in resistance. TUBB1 was recently described as the gene with the most frequently altered and amplified isoforms in breast cancer.33 TUBB4 had higher expression in an MCF7 cell line engineered to withstand paclitaxel treatment by administering gradually increasing concentra- tions of the drug.34Ultimately, the intent of any chemother- apy agent is to send the damaged cancer cell into apoptosis.
Thus, genes involved in the cell cycle (fibronectin 1 [FN1], twist family bHLH transcription factor 1 [TWIST1] and GBP1) and apoptosis (BCL2, BCL2L1, BCAP, BMF and BCL2 binding component 3 [BBC3]) play critical roles in resistance against these agents. We can confirm previous in vitroobservations showing lower expression of TWIST1 and FN1 in relation to paclitaxel resistance.35The BCL2 and BCL2L1 (BCL-xL) genes reached high significance in both Basal and Luminal A samples. Overexpression of BCL2 was recently linked to paclitaxel resistance in cell lines.36 Tumors with higher BCL2L1 expression had shorter RFS times.37 Previously, knockdown of BBC3 (PUMA) reduced paclitaxel-induced apoptosis in T47D cells.38 Overall, in our study, we can confirm multiple previous in vitro observa- tions linking different genes to paclitaxel resistance; we have summarized the mechanisms for the significant genes in Figure 5.
Tumor Markers and Signatures
We have to mention some limitations of our analysis. First, most patients included in the database have received multiple agents. Thisfinding makes it more complicated to link a given gene to a response against a selected agent. At the same time, today, almost no patients receive a monotherapy. Unfortu- nately, this limits the chance of unearthing a large-scale dataset with monotherapy in the near future.
A second limitation is the rather limited number of patients in some of the treatment arms. We plan to extend the database as new studies are published; thus, we will be able to gradually increase the validation power of the analysis tool.
Similarly, we can expect large RNA-seq datasets to be publi- shed in the near future. Unfortunately, the Cancer Genome Atlas, the largest cohort published until today, has neither pathological response data nor RFS data.
A third limitation is the different quality of the included studies. Although each study fulfilled the MIAME criteria and the array quality control, this only focus on the technical issues. Clinical trials provide high-quality patient records—
and here we took account of five datasets which used patients from different clinical trials. An additionalfilter was built into the online platform to enable the user to use exclusively these samples in the analysis.
In summary, we established a large transcriptomic database that includes treatment data and expression data of more than 20,000 genes from 3,104 samples. We used pathological response data or RFS time at 5 years to assign the patients into response cohorts. We demonstrated the robustness of the analysis pipeline by cross-validating an established set of resistance-associated genes. The online platform at www.
rocplot.org provides an easily accessed resource for researchers to mine the database and to validate and rank future biomarker candidates.
Acknowledgements
The use of the computational infrastructure of Pázmány Péter University, provided within the National Bionics Program, is gratefully acknowledged.
References
1. Khleif SN, Doroshow JH, Hait WN, et al. AACR- FDA-NCI cancer biomarkers collaborative con- sensus report: advancing the use of biomarkers in cancer drug development.Clin Cancer Res2010;
16:3299–318.
2. Gyorffy B, Hatzis C, Sanft T, et al.
Multigene prognostic tests in breast cancer:
past, present, future.Breast Cancer Res2015;
17:11.
3. Early Breast Cancer Trialists’Collaborative Group. Systemic treatment of early breast cancer by hormonal, cytotoxic, or immune therapy.
133 randomised trials involving 31,000 recur- rences and 24,000 deaths among 75,000 women.
Lancet1992;339:71–85.
4. Hortobagyi GN. Trastuzumab in the treatment of breast cancer.N Engl J Med2005;
353:1734–6.
5. Gottesman MM, Fojo T, Bates SE. Multidrug resistance in cancer: role of ATP-dependent transporters.Nat Rev Cancer2002;2:48–58.
6. van Kuilenburg AB. Dihydropyrimidine dehydrogenase and the efficacy and toxicity of 5-fluorouracil.Eur J Cancer2004;40:939–50.
7. Pommier Y. Topoisomerase I inhibitors: cam- ptothecins and beyond.Nat Rev Cancer2006;6:
789–802.
Figure5.Summary of the biological functions of the validated paclitaxel resistance-associated genes. Genes highlighted with red were upregulated, whereas genes highlighted with green were downregulated in resistant patient samples. [Colorfigure can be viewed at wileyonlinelibrary.com]