Former
Yugoslavian Republic of Macedonia
Country report
Authors:
REKK: László Szabó, András Mezősi, Zsuzsanna Pató, Ágnes Kelemen (external expert), Ákos Beöthy, Enikő Kácsor and Péter Kaderják
TU Wien: Gustav Resch, Lukas Liebmann and Albert Hiesl OG Research: Mihály Kovács and Csaba Köber
EKC: Slobodan Marković and Danka Todorović
We would like to thank József Feiler and Dries Acke (ECF), Christian Redl and Matthias Buck (Agora Energiewende), Dragana Mileusnić (CAN Europe), Dimitri Lalas (FACETS), Todor Galev and Martin Vladimorov (CSD) and Radu Dudau (EPG) and Jasminka Kapac (MACEF) for their valuable insights and contributions to the SEERMAP reports.
ISBN 978-615-80814-1-2
tenegro, Romania and Serbia. The implications of different investment strategies in the electricity sector are assessed for affordability, energy security, sustainability and security of supply. In addition to analytical work, the project focuses on trainings, capacity building and enhancing dialogue and cooperation within the SEE region.
* This designation is without prejudice to positions on status, and it is in line with UNSCR 1244 and the ICJ Opinion on the Kosovo declaration of independence.
Further information about the project is available at: www.seermap.rekk.hu
Funding for the project was provided by the Austrian Federal Ministry of Agriculture, Forestry, Environment and Water Management and the European Climate Foundation.
The Regional Centre for Energy Policy Research (REKK) is a Budapest based think tank, and consortium leader of the SEERMAP project. The aim of REKK is to provide pro- fessional analysis and advice on networked energy markets that are both commercially and environmentally sustainable. REKK has performed comprehensive research, consult- ing and teaching activities in the fields of electricity, gas and carbon-dioxide markets since 2004, with analyses ranging from the impact assessments of regulatory measures to the preparation of individual companies' investment decisions.
The Energy Economics Group (EEG), part of the Institute of Energy Systems and Electrical Drives at the Technische Universität Wien (TU Wien), conducts research in the core areas of renewable energy, energy modelling, sustainable energy systems, and energy markets.
EEG has managed and carried out many international as well as national research projects funded by the European Commission, national governments, public and private clients in several fields of research, especially focusing on renewable and new energy systems. EEG is based in Vienna and was originally founded as research institute at TU Wien.
The Electricity Coordination Centre (EKC) provides a full range of strategic business and technical consultancy and engineering leading models and methodologies in the area of electric power systems, transmission and distribution systems, power genera- tion and electricity markets. EKC was founded in 1993 and provides consultant services from 1997 in the region of South-East Europe, Europe as well as in the regions of Middle East, Eastern Africa and Central Asia. EKC also organises educational and professional trainings.
The work of OG Research focuses on macroeconomic research and state of the art macroeconomic modelling, identification of key risks and prediction of macroeconomic variables in emerging and frontier markets, assessment of economic developments, and advice on modern macroeconomic modelling and monetary policy. The company was founded in 2006 and is based in Prague and Budapest.
The Energy Regulators Regional Association (ERRA) is a voluntary organisation comprised of independent energy regulatory bodies primarily from Europe, Asia, Africa, the Middle East and the United States of America. There are now 30 full and 6 associate members working together in ERRA. The Association’s main objective is to increase exchange of information and experience among its members and to expand access to energy regulatory experience around the world.
management support services in the energy and environmental fields nationally and worldwide. MACEF holds stake in the design of the energy policy and energy sector and energy resources development planning process, in the promotion of scientific achievements on efficient use of resources and develops strategies and implements action plans for EE in the local self-government unit and wider.
POLIS University (U_Polis, Albania) is young, yet ambitious institution, quality research-led university, sup- porting a focused range of core disciplines in the field of architecture, engineering, urban planning, design, environmental management and VET in Energy Efficiency.
ENOVA (Bosnia and Herzegovina) is a multi-disciplinary consultancy with more than 15 years of experi- ence in energy, environment and economic development sectors. The organization develops and implements projects and solutions of national and regional importance applying sound knowledge, stakeholder engage- ment and policy dialogue with the mission to contributing to sustainable development in South East Europe.
The Center for the Study of Democracy (CSD, Bulgaria) is a European-based interdisciplinary non-par- tisan public policy research institute. CSD provides independent research and policy advocacy expertise in analysing regional and European energy policies, energy sector governance and the social and economic implications of major national and international energy projects.
FACETS (Greece) specialises in issues of energy, environment and climate, and their complex interdepend- ence and interaction. Founded in 2006, it has carried out a wide range of projects including: environmen- tal impact assessment, emissions trading, sustainability planning at regional/municipal level, assessment of weather and climate-change induced impacts and associated risks, forecasting energy production and demand, and RES and energy conservation development.
Institute for Development Policy (INDEP, Kosovo*) is a Prishtina based think tank established in 2011 with the mission of strengthening democratic governance and playing the role of public policy watchdog.
INDEP is focused on researching about and providing policy recommendations on sustainable energy options, climate change and environment protection.
Institute for Entrepreneurship and Economic Development (IPER, Montenegro) is an economic thing tank with the mission to promote and implement the ideas of free market, entrepreneurship, private property in an open, responsible and democratic society in accordance with the rule of law in Montenegro. Core policy areas of IPER’s research work include: Regional Policy and Regional Development, Social Policy, Economic Reforms, Business Environment and Job Creation and Energy Sector.
The Energy Policy Group (EPG, Romania) is a Bucharest-based independent, non-profit think-tank grounded in 2014, specializing in energy policy, markets, and strategy. EPG seeks to facilitate an informed dialogue between decision-makers, energy companies, and the broader public on the economic, social, and environ- mental impact of energy policies and regulations, as well as energy significant projects. To this purpose, EPG partners with reputed think-tanks, academic institutions, energy companies, and media platforms.
RES Foundation (Serbia) engages, facilitates and empowers efficient networks of relationships among key stakeholders in order to provide public goods and services for resilience. RES stands for public goods, sustain- ability and participatory policy making with focus on climate change and energy.
List of figures 6
List of tables 7
1 Executive summary 8
2 Introduction 10
2.1 Policy context 10
2.2 The SEERMAP project at a glance 11
2.3 Scope of this report 12
3 Methodology 12
4 Scenario descriptions and main assumptions 14
4.1 Scenarios 14
4.2 Main assumptions 15
5 Results 17
5.1 Main electricity system trends 17
5.2 Security of supply 20
5.3 Sustainability 20
5.4 Affordability and competitiveness 22
5.5 Sensitivity analysis 26
5.6 Network 27
5.7 Macroeconomic impacts 29
6 Policy conclusions 33
6.1 Main electricity system trends 34
6.2 Security of supply 35
6.3 Sustainability 35
6.4 Affordability and competitiveness 35
7 References 38
Annex 1: Model output tables 42
Annex 2: Assumptions 50
Assumed technology investment cost trajectories: RES and fossil 50
Infrastructure 50
Generation units and their inclusion in the core scenarios 52
Figure 1: The five models used for the analysis 13
Figure 2: The core scenarios 15
Figure 3: Installed capacity in the 3 core scenarios until 2050 (GW) in Macedonia, 2020-2050 18 Figure 4: Electricity generation and demand (TWh) and RES share (% of demand) in Macedonia,
2020-2050 18 Figure 5: Utilisation rates of conventional generation in Macedonia, 2020-2050 (%) 19 Figure 6: Generation and system adequacy margin for Macedonia, 2020-2050 (% of load) 21 Figure 7: CO₂ emissions under the 3 core scenarios in Macedonia, 2020-2050 (mt) 21 Figure 8: Wholesale electricity price in Macedonia, 2020-2050 (€/MWh) 23 Figure 9: Cumulative investment cost for 4 and 10 year periods, 2016-2050 (bn€) 23 Figure 10: Long term cost of renewable technologies in Macedonia (€/MWh) 24 Figure 11: Average RES support per MWh of total electricity consumption and average wholesale
price, 2016-2050 (€/MWh) 25
Figure 12: Cumulative RES support and auction revenues for 4 and 10 year periods, 2016-2050 (m€) 25 Figure 13: Generation mix (TWh) and RES share (% of demand) in the sensitivity runs in 2030 and 2050 27 Figure 14: NTC value changes in 2030 and 2050 in the ’delayed’ and ’decarbonisation’ scenarios
compared to the ’base case’ scenario 28
Figure 15: Loss variation compared to the base case in the ’delayed’ and ’decarbonisation’ scenarios (MW) 29 Figure 16: GDP and employment impacts compared with the ‘baseline’ scenario 30 Figure 17: Public and external balances and debt impacts compared with the ‘baseline’ scenario 31
Figure 18: Household electricity expenditure 2017-2050 32
Figure A1: New gas infrastructure investment assumed to take place in all scenarios 51
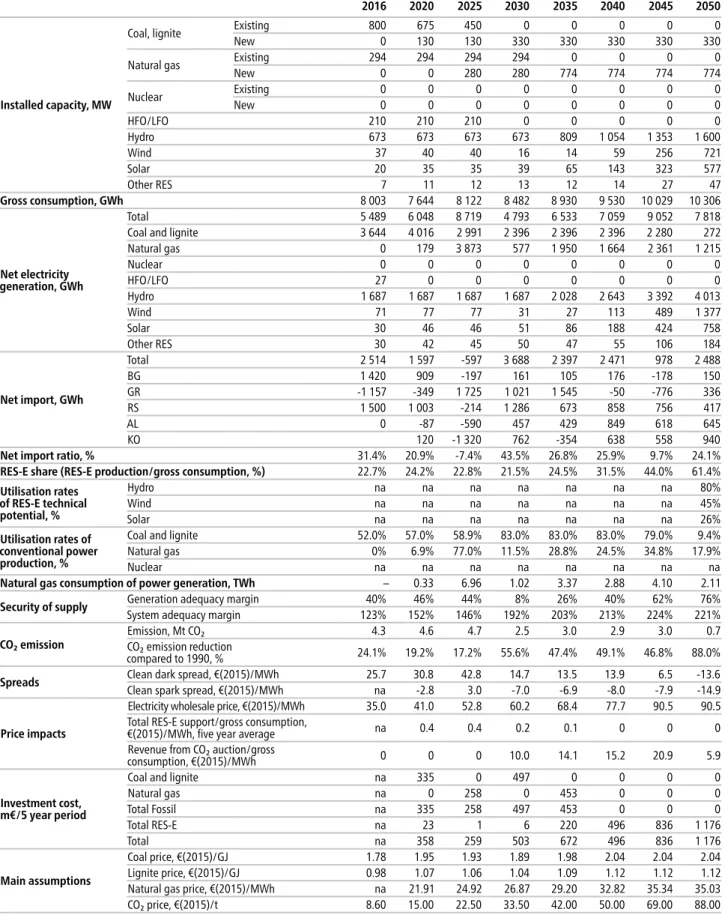
Table A1: ‘No target’ scenario 42
Table A2: ‘Delayed’ scenario 43
Table A3: ‘Decarbonisation’ scenario 44
Table A4: Sensitivity analysis – Low carbon price 45
Table A5: Sensitivity analysis – Low demand 46
Table A6: Sensitivity analysis – High demand 47
Table A7: Sensitivity analysis – Low renewable potential 48
Table A8: Break down of cumulative capital expenditure by RES technology (m€) 49 Table A9: Development of support expenditures (for RES total) over time (5-year time periods) 49 Table A10: Assumed specific cost trajectories for RES technologies (2016 €/kW) 50
Table A11: New gas infrastructure in the Region 50
Table A12: Cross border transmission network capacities 51
Table A13: List of generation units included exogenously in the model in the core scenarios 52
1 | Executive summary
South East Europe is a diverse region with respect to energy policy and legislation, with a mix of EU member states, candidate and potential candidate countries. Despite this diversity, shared challenges and opportunities exist among the countries of the region. The electricity network of the South East Europe region is highly intercon- nected, energy policies are increasingly harmonised and the electricity market is increasingly integrated as a result of the EU accession process, the Energy Community Treaty and more recently the Energy Union initiative warranting a regional perspective on policy development.
A model-based assessment of different long term electricity investment strategies was carried out for the region within the scope of the SEERMAP project. The project builds on previous work in the region, in particular IRENA (2017), the DiaCore and BETTER EU research projects and the SLED project, as well as on EU level analysis, in particular the EU Reference Scenario 2013 and 2016. The current assessment shows that alternative solutions exist to replace current generation capacity by 2050, with different implications for affordability, sustainability and security of supply.
In Macedonia all current fossil fuel generation capacity is expected to be decommis- sioned before 2035, providing both a challenge and opportunity to shape the electricity in the long run with a policy framework that incentivises new investment, and provides an opportunity to shape the electricity sector over the long term in-line with a broader energy transition unconstrained by the current generation portfolio.
A set of five models covering the electricity and gas markets, the transmission network and macro-economic system were used to assess the impact of 3 core scenarios:
•
The ‘no target’ scenario reflects the implementation of current energy policy (including implementation of renewable energy targets for 2020 and completion of all power plants listed in official planning documents) combined with a CO₂ price (applied from 2030 onwards for non-EU states), but no 2050 CO₂ target in the EU or Western Balkans;•
The ‘decarbonisation’ scenario reflects a long-term strategy to significantly reduce CO₂ emissions according to indicative EU emission reduction goals for the electricity sector as a whole by 2050, driven by the CO₂ price and strong, continuous RES support;•
The ‘delayed’ scenario envisages an initial implementation of current national investment plans followed by a change in policy from 2035 onwards that leads to the same emission reduction target by 2050 as the ‘decarbonisation’ scenario. The attainment of the target is driven by the CO₂ price and increased RES support from 2035 onwards.The modelling work carried out under the SEERMAP project identifies the following key findings with respect to the different electricity strategy approaches that Macedonia can take:
•
With a long term planned effort supportive of renewable electricity, Macedonia can meet the decarbonisation target for the EU28+Western Balkans by 2050. However, with delayed action or without a reduction target it will fall short of the EU emission reduction target.•
If planned appropriately, RES support needed to achieve complete decarbonisation is moderate, staying below 2 EUR/MWh throughout the modelled time horizon.•
Delayed action on renewables also has disadvantages compared with long term planned action, in addition to falling short of targeted emission levels. With the ‘decarbonisation’scenario there are zero stranded fossil fuel generation costs while they amount to 287 mEUR in the ‘delayed’ scenario. Expressed as a surcharge on consumed electricity, stranded costs are equivalent to 2.9 EUR/MWh, which is higher than the required RES support in the
‘decarbonisation’ scenario. If action is delayed, the disproportionate effort needed towards the end of the modelled period to reach the CO₂ emission reduction target requires a sig- nificant increase in RES support.
•
Lignite based power generation is phased out in all scenarios. There is a complete phase-out in the ‘decarbonisation’ scenario; in the other two scenarios lignite only accounts for an insignificant share, less than 4%, of total generation by 2050, despite the fact that 330 MW of new lignite power plants are added in both of these scenarios. With a competitive electricity market and strong interconnections between Macedonia and its neighbours, the power plants in Macedonia compete with other power plants in the region and the EU. The wholesale price and carbon price have a major influence on which power plants come online to meet demand. In scenarios where lignite based new power plants are built according to national plans, these new power plants are idle for most of the year by 2050 due to high carbon costs. National policymakers therefore have a limited ability to influence the electricity mix over the long term with investment decisions.•
Gas has a transitional role in generation, reaching more than 40% of electricity generation at its peak by 2040 if no decarbonisation target is set. However, gas has a more limited role as a bridging fuel in a scenario with a long term planned RES support policy, and is phased out by 2035.•
Installed domestic generation capacity enables Macedonia to satisfy domestic demand in all hours of the year across all scenarios using domestic generation. Its system adequacy margin is also positive throughout the entire period.•
Compared to a scenario with no emission reduction target, decarbonisation policies do not drive up wholesale electricity prices. The price of electricity follows a similar trajectory in all scenarios, only diverging after 2045 when prices are lower as a result of the low marginal cost of RES electricity production.•
Under all scenarios there is a significant increase in the wholesale electricity price compared with current (albeit historically low) price levels. This is the trend across the entire EU as a result of the rising price of carbon and natural gas. Household electricity expenditure as a share of disposable income increases at a lower rate than electricity prices in all scenarios.Higher wholesale prices also have positive implications, attracting needed investment in electricity generation, thereby addressing the current underinvestment in the sector.
•
Investment levels are higher in the ‘decarbonisation’ scenario than the ‘no target’ scenario, but only by 17%. In contrast, delayed action would lead to 46% higher investment levels.•
With the realization of current TYNDP infrastructure plan the network model does not forecast congestion. But this does not include modelling of investment for the develop- ment of the distribution network, which may be significant due to the increase in solar generation capacity in particular.A number of no regret policy recommendations can be provided based on robust results across all scenarios:
•
The high penetration of RES in all scenarios suggests a policy focus on enabling RES integration; investing in transmission and distribution networks, enabling demandside management and RES production through a combination of technical solutions and appropriate regulatory practices, and promoting investment in storage solutions including hydro and small-scale storage.
•
RES potential can be maximized with the help of policies reducing barriers to RES invest- ment. De-risking policies reducing high financing and high capital costs are especially important to allow for cost-efficient renewable energy investments.•
Co-benefits of investing in renewable electricity generation can strengthen the case for increased RES investment. Co-benefits include increased GDP as a result of increased investment in generation capacity. Additional co-benefits include health and environ- mental benefits from reduced emissions to air, however, these benefits are not addressed in this report.•
Policymakers must address trade-offs concerning fossil fuel investments. Both lignite and gas based capacities are expected to be priced out of the market before the end of their lifetime in all scenarios with the lowest stranded costs in the ‘decarbonisation’scenario.
•
Regional level planning improves system adequacy compared with national plans emphasizing reliance on domestic production capacities.2 | Introduction
2.1 Policy context
Over the past decades EU energy policy has focused on a number of shifting priorities.
Beginning in the 1990s, the EU started a process of market liberalisation in order to ensure that the energy market is competitive, providing cleaner and cheaper energy to consumers. Three so-called energy packages were adopted between 1996 and 2009 addressing market access, transparency, regulation, consumer protection, interconnec- tion, and adequate levels of supply. The integration of the EU electricity market was linked to the goal of increasing competitiveness by opening up national electricity markets to competition from other EU countries. Market integration also contributes to energy security, which had always been a priority but gained renewed importance again during the first decade of the 2000s due to gas supply interruptions from the dominant supplier, Russia. Energy security policy addresses short and long term security of supply challenges and promotes the strengthening of solidarity between member states, completing the internal market, diversification of energy sources, and energy efficiency.
The Energy Community Treaty and related legal framework translates EU commitments on internal energy market rules and principles into commitments for the candidate and potential candidate countries. Other regional processes and initiatives, such as CESEC and the Western Balkan 6 initiative, also known as the Berlin Process, also have implica- tions for regional energy policy and legislation, infrastructure and markets.
Climate mitigation policy is inextricably linked to EU energy policy. Climate and energy were first addressed jointly via the so-called ‘2020 Climate and energy package’
initially proposed by the European Commission in 2008. This was followed by the ‘2030
Climate and energy framework’, and more recently by the new package of proposed rules for a consumer centred clean energy transition, referred to as the ‘winter package’
or ‘Clean energy for all Europeans’. The EU has repeatedly stated that it is in line with the EU objective, in the context of necessary reductions according to the IPCC by developed countries as a group, to reduce its emissions by 80-95% by 2050 compared to 1990, in order to contribute to keeping global average temperature rise below 2°C compared with pre-industrial levels. The EU formally committed to this target in the
‘INDC of the European Union and its 28 Member States’. The 2050 Low Carbon and Energy Roadmaps reflect this economy-wide target. The impact assessment of the Low Carbon Roadmap shows that the cost-effective sectoral distribution of the economy- wide emission reduction target translates into a 93-99% emission reduction target for the electricity sector (EC 2011a). The European Commission is in the process of updating the 2050 roadmap to match the objectives of the Paris Agreement, possibly reflecting a higher level of ambition than the roadmap published in 2011.
2.2 The SEERMAP project at a glance
The South East Europe Electricity Roadmap (SEERMAP) project develops electricity sector scenarios until 2050 for the South East Europe region. Geographically the SEERMAP project focuses on 9 countries in South East Europe: Albania, Bosnia and Herzegovina, Kosovo* (in line with UNSCR 1244 and the ICJ Opinion on the Kosovo declaration of independence), former Yugoslav Republic of Macedonia (Macedonia), Montenegro and Serbia (WB6) and Bulgaria, Greece and Romania (EU3). The SEERMAP region consists of EU member states, as well as candidate and potential candidate countries. For non-member states some elements of EU energy policy are translated into obligations via the Energy Community Treaty, while member states must transpose and implement the full spectrum of commit- ments under the EU climate and energy acquis.
Despite the different legislative contexts, the countries in the region have a number of shared challenges. These include an aged electricity generation fleet in need of investment to ensure replacement capacity, consumers sensitive to high end user prices, and challenging fiscal conditions. At the same time, the region shares opportunity in the form of large potential for renewables, large potential of hydro generation which can be a valuable asset for system balancing, a high level of interconnectivity, and high fossil fuel reserves, in particular lignite, which is an important asset in securing electricity supply.
Taking into account the above policy and socio-economic context, and assuming that the candidate and potential candidate countries will eventually become member states, the SEERMAP project provides an assessment of what the joint processes of market liberalisation, market integration and decarbonisation mean for the electric- ity sector of the South East Europe region. The project looks at the implications of different investment strategies in the electricity sector for affordability, sustainability and security of supply.
The aim of the analysis is to show the challenges and opportunities ahead and the trade-offs between different policy goals. The project can also contribute to a better under- standing of the benefits that regional cooperation can provide for all involved countries.
Although ultimately energy policy decisions will need to be taken by national policy makers, these decisions must recognise the interdependence of investment and regula- tory decisions of neighbouring countries. Rather than outline specific policy advise in such
a complex and important topic, our aim is to support an informed dialogue at the national and regional level so that policymakers can work together to find optimal solutions.
2.3 Scope of this report
This report summarises the contribution of the SEERMAP project to the ongoing policy debate on how to enhance the decarbonisation of the electricity sector in South East Europe. We inform on the work undertaken, present key results gained and offer a summary of key findings and recommendations on the way forward.
This report summarises the contribution of the SEERMAP project to the ongoing policy debate on how to enhance the decarbonisation of the electricity sector in Macedonia.
We inform on the work undertaken, present key results gained and offer a summary of key findings and recommendations on the way forward. Please note that further infor- mation on the analysis conducted on other SEERMAP countries can be found in the indi- vidual SEERMAP country reports, and a Regional Report is also produced.
3 | Methodology
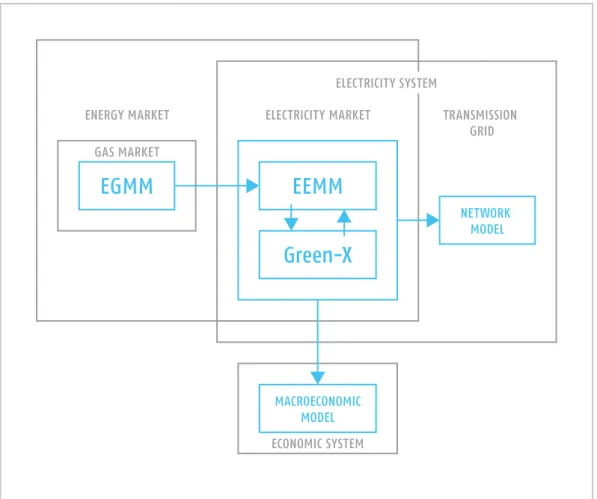
Electricity sector futures are explored using a set of five high resolution models incor- porating the crucial factors which influence electricity policy and investment decisions.
The European Electricity Market Model (EEMM) and the Green-X model together assess the impact of different scenario assumptions on power generation investment and dispatch decisions. The EEMM is a partial equilibrium microeconomic model. It assumes that the electricity market is fully liberalised and perfectly competitive. In the model, electricity generation as well as cross border capacities are allocated on a market basis without gaming or withholding capacity: the cheapest available genera- tion will be used, and if imports are cheaper than producing electricity domestically demand will be satisfied with imports. Both production and trade are constrained by the available installed capacity and net transfer capacity (NTC) of cross border trans- mission networks respectively. Due to these capacity constraints, prices across borders are not always equalised. Investment in new generation capacity is either exogenous in the model (based on official policy documents), or endogenous. Endogenous invest- ment is market-driven; power plant operators anticipate costs over the upcoming 10 years and make investment decisions based exclusively on profitability. If framework conditions (e.g. fuel prices, carbon price, available generation capacities) change beyond this timeframe then the utilisation of these capacities may change and profit- ability is not guaranteed.
The EEMM models 3400 power plant units in a total of 40 countries, including the EU, Western Balkans, and countries bordering the EU. Power flow is ensured by 104 interconnectors between the countries, where each country is treated as a single node.
The fact that the model includes countries beyond the SEERMAP region incorporates the impact of EU market developments on the SEERMAP region.
The EEMM model has an hourly time step, modelling 90 representative hours with respect to load, covering all four seasons and all daily variations in electricity demand.
The selection of these hours ensures that both peak and base load hours are represented,
and that the impact of volatility in the generation of intermittent RES technologies on wholesale price levels is captured by the model. The model is conservative with respect to technological developments and thus no significant technological breakthrough is assumed (e.g. battery storage, fusion, etc.).
The Green-X model complements the EEMM with a more detailed view of renewable electricity potential, policies and capacities. The model includes a detailed and harmo- nised methodology for calculating long-term renewable energy potential for each tech- nology using GIS-based information, technology characteristics, as well as land use and power grid constraints. It considers the limits to scaling up renewables through a technology diffusion curve which accounts for non-market barriers to renewables but also assumes that the cost of these technologies decrease over time, in line with global deployment (learning curves). The model also considers the different cost of capital in each country and for each technology by using country and technology specific weighted average cost of capital (WACC) values.
An iteration of EEMM and Green-X model results ensures that wholesale electric- ity prices, profile based RES market values and capacities converge between the two models.
In addition to the two market models, three other models are used:
•
the European Gas Market Model (EGMM) to provide gas prices for each country up to 2050 used as inputs for EEMM;FIGURE 1 THE FIVE MODELS USED FOR THE ANALYSIS A detailed description of the models is provided in a separate document (“Models used in SEERMAP”)
•
the network model is used to assess whether and how the transmission grid needs to be developed due to generation capacity investments, including higher RES penetration;•
macroeconomic models for each country are used to assess the impact of the different scenarios on macroeconomic indicators such as GDP, employment, and the fiscal and external balances.4 | Scenario descriptions and main assumptions
4.1 Scenarios
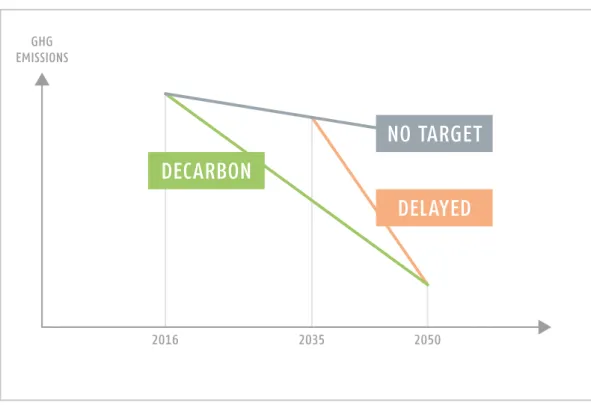
From a policy perspective, the main challenge in the SEE region in the coming years is to ensure sufficient replacement of aging power plants within increasingly liberalised markets, while at the same time ensuring affordability, security of supply and a significant reduction of greenhouse gas emissions. There are several potential long-term capacity development strategies which can ensure a functioning electricity system. The roadmap assesses 3 core scenarios:
•
The ‘no target’ scenario reflects the implementation of current energy policy and no CO₂ target in the EU and Western Balkans for 2050;•
The ‘decarbonisation’ scenario reflects a continuous effort to reach significant reductions of CO₂ emissions, in line with long term indicative EU emission reduction goal of 93-99%emission reduction for the electricity sector as a whole by 2050;
•
The ‘delayed’ scenario involves an initial implementation of current investment plans followed by a change in policy direction from 2035 onwards, resulting in the realisation of the same emission reduction target in 2050 as the ‘decarbonisation’ scenario.The modelling work does not take into account the impacts of the new Large Combus- tion Plant BREF (Commission Implementing Decision of 2017/1442), as it entered into force in July 2017.
The same 94% emission reduction target was set for the EU28+WB6 region in the
‘delayed’ and ‘decarbonisation’ scenarios. This implies that the emission reductions will be higher in some countries and lower in others depending on where emissions reduc- tions are most cost-efficiently.
The mix of new technologies are entered in the model in two ways that result in different generation mixes : (i) the new power plants entered exogenously into the model based on policy documents, and (ii) the different levels and timing of RES support resulting in different endogenous RES investment decisions. The assumptions of the three core scenarios are the following:
•
In the ‘no target’ scenario all currently planned fossil fuel power plants are entered exoge- nously. Information on planned power plants is taken from official national strategies/plansand information received from the local partners involved in the project. We have assumed the continuation of current renewable support policies up to 2020 and the gradual phasing out of support between 2021 and 2025. The scenario assumes countries meet their 2020 renewable target but do not set a CO₂ emission reduction target for 2050. Although a CO₂ target is not imposed, producers face CO₂ prices in this scenario, as well as in the others.
•
In the ‘decarbonisation’ scenario, only those planned investments which had a final investment decision in 2016 were considered, resulting in lower exogenous fossil fuel capacity. With a 94% CO₂ reduction target, RES support in the model was calculated endogenously to enable countries to reach their decarbonisation target by 2050 with the necessary renewable investment. RES targets are not fulfilled nationally in the model, but are set at a regional level, with separate targets for the SEERMAP region and for the rest of the EU.•
The ‘delayed’ scenario considers that currently planned power plants are built according to national plans, similarly to the ‘no target’ scenario. It assumes the continuation of current RES support policies up to 2020 with a slight increase until 2035. This RES support is higher than in the ‘no target’ scenario, but lower than the ‘decarbonisation’ scenario. Support is increased from 2035 to reach the same CO₂ emission reduction target as the ‘decarbonisa- tion’ scenario by 2050.Due to the divergent generation capacities, the scenarios result in different generation mixes and corresponding levels of CO₂ emissions, but also in different investment needs, wholesale price levels, patterns of trade, and macroeconomic impact.
4.2 Main assumptions
All scenarios share common framework assumptions to ensure the comparability of scenarios with respect to the impact of the different investment strategies over the next few decades. The common assumptions across all scenarios are described below.
FIGURE 2 THE CORE SCENARIOS
Demand:
•
Projected electricity demand is based – to the extent possible – on data from official national strategies. Where official projections do not exist for the entire period until 2050, electricity demand growth rates were extrapolated based on the EU Reference scenario for 2013 or 2016 (for non-MS and MS respectively). The PRIMES EU Reference scenarios assume low levels of energy efficiency and low levels of electrification of transport and space heating compared with a decarbonisation scenario. The average annual electricity growth rate for the SEERMAP region as a whole is 0.74% over the period 2015 and 2050. The annual demand growth rate for countries within the region is varies significantly, with the value for Greece as low as 0.2%, and for Bosnia and Herzegovina as high as 1.7%. Whereas the growth rate in all EU3 countries is below 0.7%, Macedonia is the only country in the WB6 where the growth rate is below 1%a year. For Macedonia, an annual demand growth rate of 0.76% between 2015 and 2030 was provided by our local partner, and than PRIMES demand growth rates were used.
•
Demand side management (DSM) measures were assumed to shift 3.5% of total daily demand from peak load to base load hours by 2050. The 3.5% assumption is a conserva- tive estimate compared to other projections from McKinsey (2010) or TECHNOFI (2013).No demand side measures were assumed to be implemented before 2035.
Factors affecting the cost of investment and generation:
•
Fossil fuel prices: Gas prices are derived from the EGMM model. The price of oil and coal were taken from IEA (2016) and EIA (2017) respectively. The price of coal is expected to increase by approximately 15% between 2016 and 2050; gas prices by 60% (differenti- ated by country according to EGMM) and oil prices by 250%. Compared to 2012-2013 levels, the oil price increases only 15-20% by 2050.•
Cost of different technologies: Information on the investment cost of new generation tech- nologies is taken from EIA (2017).•
Weighted average cost of capital (WACC): The WACC has a significant impact on the cost of investment, with a higher WACC implying a lower net present value and therefore a more limited scope for profitable investment. The WACCs used in the modelling are country- specific, these values are modified by technology-specific and policy instrument-specific risk factors. The country-specific WACC values in the region are assumed to be between 10 and 15% in 2016, decreasing to between 9.6 and 11.2% by 2050. The value is highest for Greece in 2016, and remains one of the highest by 2050. In contrast, the WACC values for the other two EU member states, Romania and Bulgaria, are on the lower end of the spectrum, as are the values for Kosovo* and Macedonia. The WACC used for Macedonia is 10.5% in 2015 and 9.9% in 2050. Other studies estimating WACC values for the region verify high levels.•
Carbon price: a price for carbon is applied for the entire modelling period for EU member states and from 2030 onwards in non-member states, under the assumption that all candidate and potential candidate countries will implement the EU Emissions Trading Scheme or a corresponding scheme by 2030. The carbon price is assumed to increase from 33.5 EUR/tCO₂ in 2030 to 88 EUR/tCO₂ by 2050, in line with the EU Reference Scenario 2016. This Reference Scenario reflects the impacts of the full implementation of existing legally binding 2020 targets and EU legislation, but does not result in the ambitious emission reduction targeted by the EU as a whole by 2050. The corresponding carbon price, although significantly higher than the current price, is therefore a medium level estimatecompared with other estimates of EU ETS carbon prices by 2050. For example, the Impact Assessment of the Energy Roadmap 2050 projected carbon prices as high as 310 EUR under various scenarios by 2050 (EC 2011b). The EU ETS carbon price is determined by the marginal abatement cost of the most expensive abatement option, which means that the last reduction units required by the EU climate targets will be costly, resulting in steeply increasing carbon price in the post 2030 period.
Infrastructure:
•
Cross-border capacities: Data for 2015 was available from ENTSO-E with future NTC values based on the ENTSO-E TYNDP 2016 (ENTSO-E 2016) and the 100% RES scenario of the E-Highway projection (ENTSO-E 2015b).•
New gas infrastructure: In accordance with the ENTSO-G TYNDP 2017 both the Transadri- atic (TAP) and Transanatolian (TANAP) gas pipelines (see Annex II) are built between 2016 and 2021, and the expansion of the Revithoussa and the establishment of the Krk LNG terminals are taken into account. No further gas transmission infrastructure development was assumed in the period to 2050.Renewable energy sources and technologies:
•
Long-term technical RES potential is estimated based on several factors including the effi- ciency of conversion technologies and GIS-based data on wind speed and solar irradia- tion, and is reduced by land use and power system constraints. It is also assumed that the long term potential can only be achieved gradually, with renewable capacity increase restricted over the short term. A sensitivity analysis measured the reduced potential of the most contentious RES capacities, wind and hydro. The results of the sensitivity analysis are discussed in section 5.5.•
Capacity factors of RES technologies were based on historical data over the last 5 to 8 years depending on the technology.Annex 2 contains detailed information on the assumptions.
5 | Results
5.1 Main electricity system trends
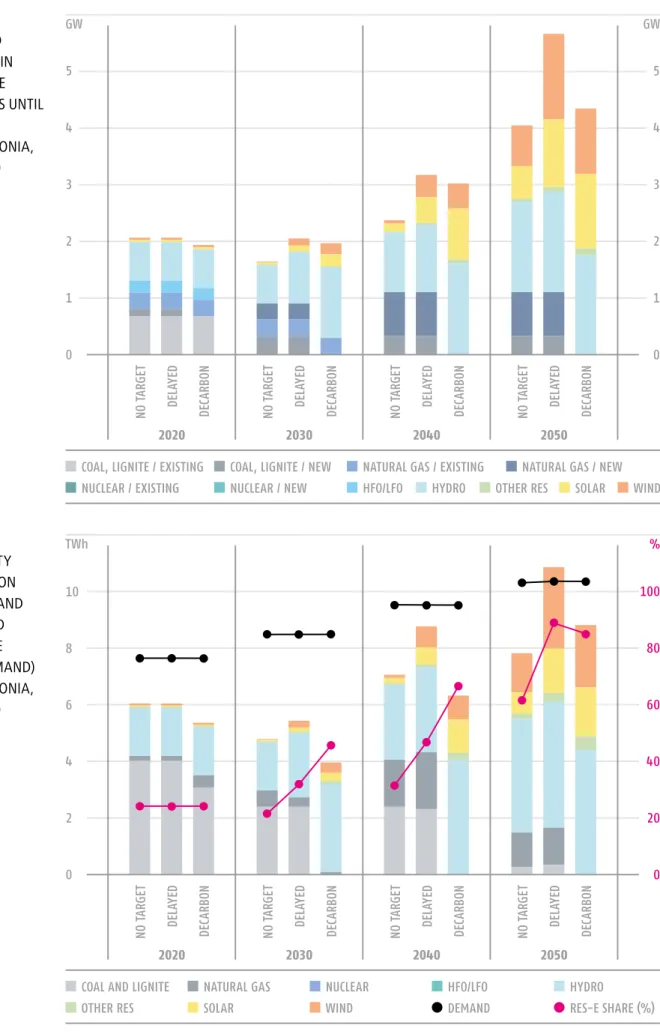
Macedonia will significantly increase its current share of RES generation in all scenarios by 2050, reaching 61% of consumption in the ‘no target’ scenario and 85-89% in the other two scenarios with a decarbonisation target. At the same time, the share of fossil fuels will be reduced significantly by 2050, falling to 19% in the ‘no target’ and zero in the ‘decar- bonisation’ scenario.
According to national plans, Macedonia will decommission its existing lignite power plants by 2030 and add 330 MW of new capacity. This is accounted for in the
‘no target’ and ‘delayed’ scenarios. Despite the installation of this new capacity, the
FIGURE 3 INSTALLED CAPACITY IN THE 3 CORE SCENARIOS UNTIL 2050 (GW)
IN MACEDONIA, 2020-2050
FIGURE 4 ELECTRICITY GENERATION AND DEMAND (TWh) AND RES SHARE (% OF DEMAND) IN MACEDONIA, 2020-2050
contribution of lignite to total electricity generation is only slightly more than 3% of total generation by 2050. The decrease in the share of lignite is driven by the increas- ing price of carbon, which prices out coal by the end of the period. With the rising price of carbon, the share of lignite based generation falls continously from 2020, with a particularly large drop between 2045 and 2050 in the ‘no target’ and ‘delayed’
scenarios. In the ‘decarbonisation’ scenario, coal disappears from the electricity mix by 2030.
The role of gas in the electricity mix is transitory. In accordance with current national plans, gas capacity is expected to increase to 774 MW in both the ‘no target’ and
‘delayed’ scenarios by 2035. Gas generation peaks in 2040-2045 in both scenarios, reaching nearly a quarter of total generation. However, by 2050 the share of gas in total generation is only 15.5% in the ‘no target’ and 12.1% in the ‘delayed’ scenario.
The initial growth in gas based electricity generation is driven by the rising price of carbon which prices out coal before RES capacity becomes competitive. The subse- quent decline is a result of increasing carbon and natural gas prices that erode its competitiveness. In the ‘decarbonisation’ scenario gas disappears from the electricity mix before 2035 and no new capacities are added.
In all scenarios hydro emerges as the dominant RES technology in Macedonia, reaching 40-50% of total generation by 2050. In the two decarbonisation target scenarios, the contribution of wind and solar is also significant. In the ‘decarbonisa- tion’ scenario, wind is responsible for 25% of total generation and solar adds almost 20% by 2050. This represents a 30-fold increase in wind generation and more than 50-fold increase in solar generation by 2050 compared with current levels. Biomass remains insignificant (under 6%) in all scenarios.
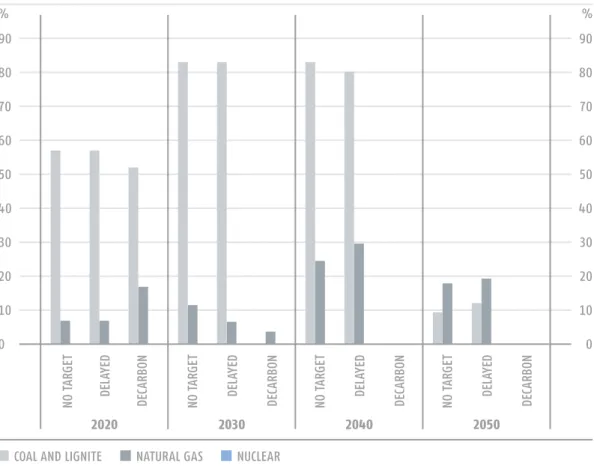
FIGURE 5 UTILISATION RATES OF CONVENTIONAL GENERATION IN MACEDONIA, 2020-2050 (%)
The evolution of fossil fuel utilisation rates reflect its relative competitiveness in power generation. Lignite utilization remains high until 2040 when it falls precipitously and the plants become uneconomical to run. Prior to that, from 2030 onwards, utilisation rates are above 80% in the ‘no target’ and ‘delayed’ scenarios. Gas utilisation rates are relatively low throughout the modelled period, with utilisation rates remaining below 35% after 2025 in both the ‘no target’ and ‘delayed’ scenarios. In the ‘decarbonisation’ scenario gas and coal exit from the electricity mix before 2035, indicating that RES support with a carbon price make RES more competitive than fossil fuels. With low utilisation rates for gas and only temporarily high rates for lignite, these investments will be stranded and unable to recover investment costs. This issue is discussed further in section 5.4.
5.2 Security of supply
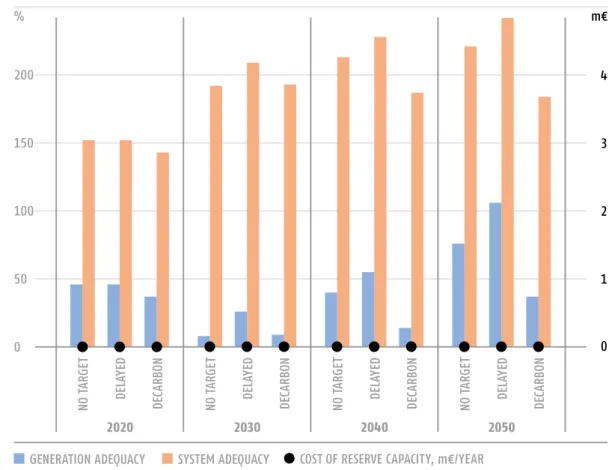
Even though the physical and commercial integration of national electricity markets improves security of supply, concerns of decision makers often remain regarding the extent and robustness of this improvement, particularly in the context of a high share of renewables. In order to assess the validity of such concerns three security of supply indices were calculated for all countries and scenarios: the generation capacity margin, the system adequacy margin, and the cost of increasing the generation adequacy margin to zero.
The generation adequacy margin is defined as the difference between available capacity and hourly load as a percentage of hourly load. If the resulting value is negative then the load cannot be satisfied with domestic generation capacities alone in a given hour, and imports are needed. The value of the generation adequacy margin was cal- culated for all of the modelled 90 representative hours, and of the 90 calculated values, the lowest generation adequacy margin value was taken into account in the generation adequacy margin indicator. For this calculation, assumptions were made with respect to the maximum availability of different technologies: fossil fuel based power plants are assumed to be available 95% of the time, hydro storage 100% and for other RES technologies historical availability data was used. System adequacy was defined in a similar way, but net transfer capacity available for imports was considered in addition to available domestic capacity. This is a simplified version of the methodology formerly used by ENTSO-E. (See e.g. ENTSO-E, 2015, and previous SOAF reports)
For Macedonia, the generation adequacy margin is positive throughout the modelling period in all scenarios, meaning that domestic generation capacity is sufficient to satisfy domestic demand in all hours of the year. The system adequacy margin is even higher.
In addition to the adequacy margin indicators, the cost of increasing the genera- tion adequacy margin to zero was calculated for countries with negative initial values.
The cost of the required capacity is defined as the annual fixed cost of an open cycle gas turbine (OCGT) with the capacity to ensure that the generation adequacy margin reaches zero. This can be interpreted as a capacity fee, provided that payments are only made to new generation with the goal of improving the generation adequacy margin to zero. Since the generation adequacy margin for Macedonia was positive to begin with for all years across all scenarios, this cost for Macedonia is zero.
5.3 Sustainability
The CO₂ emissions of the three core scenarios were calculated based on representative emission factors for the region. Due to data limitations this calculation did not account
FIGURE 6 GENERATION AND SYSTEM ADEqUACY MARGIN
FOR MACEDONIA, 2020-2050
(% OF LOAD)
FIGURE 7 CO₂ EMISSIONS UNDER THE 3 CORE SCENARIOS IN MACEDONIA, 2020-2050 (mt)
for greenhouse gases other than CO₂ and does not include emissions related to heat production from cogeneration.
The EU28+Western Balkans 94% decarbonisation target translates into a higher than average level of decarbonisation in the Macedonian electricity sector with the ‘decar- bonisation’ scenario reaching 100% emission reduction, but in the ‘delayed’ scenario it only reaches 86%. This clearly demonstrates the importance of early planned action in Macedonia, as delayed action endangers the achievement of emission reduction targets.
The share of renewable generation as a percentage of gross domestic consump- tion in the ‘no target’ scenario is 21.5% in 2030 and more than 61% by 2050. The RES share increases more steadily in the ‘decarbonisation’ scenario, reaching 45% by 2030 and over 85% by 2050 in the ‘decarbonisation’ scenario. The utilisation of technical potential for hydro and wind is highest in the ‘delayed’ scenario in 2050, at 88% for hydro and 95% for wind. The utilisation rate for solar is the highest in the ‘decarbonisa- tion’ scenario, 59% in 2050.
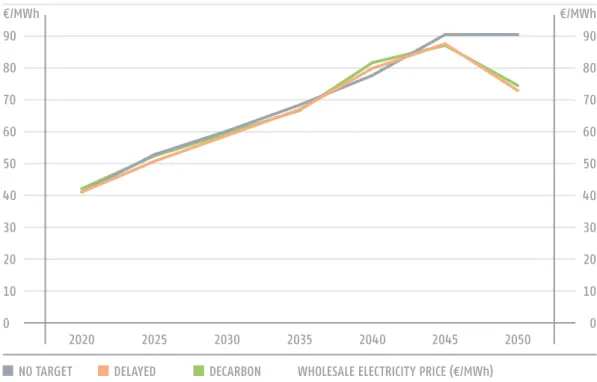
5.4 Affordability and competitiveness
In the market model (EEMM) the wholesale electricity price is determined by the highest marginal cost of the power plants needed to satisfy demand. The price trajectories are independent of the level of decarbonisation and similar in all scenarios, only diverging after 2045 when the two scenarios with decarbonisation targets result in lower wholesale prices. This is due to the fact that towards 2050 the share of renewables is high enough to satisfy demand in most hours at a low cost, driving the average annual price down.
The price development has several implications for policy makers. Retail prices depend on the wholesale price as well as taxes, fees and network costs. It is therefore difficult to project retail price evolution based on wholesale price information alone, but it is an important determinant of end user prices and could affect affordability for consumers. The average annual price increase over the entire period is 2.83% in the ‘no target’, 2.18% in the ‘delayed’ and 2.25% in the ‘decarbonisation’ scenario. The lower growth in the latter two scenarios are a consequence of the fall in wholesale prices in the last five years of the modelled time period. Although the price increase is high, prices in Europe were at historical lows in 2016 for the starting point of the analysis and will rise to approximately 60 EUR/MWh by 2030, similar to price levels 10 years ago. Still, macroeconomic analysis in Section 5.7 shows that if affordability is measured as the share of household electricity expenditure in disposable income, electricity expenditure remains relatively stable even with the significant increase in wholesale electricity prices. The price increase also has three positive implications, incentivising investment for new capacities, incentivising energy efficiency and reducing the need for RES support.
The investment required for new capacities is only 17% higher in the ‘decarbonisation’
scenario than the ‘no target’ scenario. Investment needs are greatest in the ‘delayed’
scenario, 46% higher than the ‘no target’ scenario. Investment needs increase over time in all three scenarios.
Investments are financed by private actors based on a profitability requirement (apart from the capacities planned in the national strategies), factoring in the different cost structure of renewables, i.e. higher capital cost and low operating expenditure in their investment decisions. From a social perspective, the investment impacts on the GDP and the external balance and debt are discussed in more detail in section 5.7.
FIGURE 8 WHOLESALE ELECTRICITY PRICE IN MACE- DONIA, 2020-2050
(€/MWh)
FIGURE 9 CUMULATIVE INVESTMENT COST FOR 4 AND 10 YEAR PERIODS, 2016-2050 (bn€)
Despite the significant investment needs associated with the ‘decarbonisation’
scenario, the renewables support required to incentivise these investments remains low, beginning at 0.4 EUR/MWh and rising to 2 EUR/MWh towards the end of the modelled time horizon. The RES support relative to electricity cost (wholesale price plus RES support) is only 2.6% at its highest level in the ‘decarbonisation’ scenario.
In the ‘delayed’ scenario, however, the rapid deployment of additional capacities towards the end of the modelled time horizon that are needed to achieve 2050 decar- bonisation targets will require substantial support, estimated at around 26% of total electricity cost.
Although with falling costs RES technologies are already at grid parity in some locations, support is still needed in 2050 to incentivise new investment. This is partly a locational effect, as the best locations with highest potential are used first and costs of the subsequent RES capacities might increase over time. The relationship between the cost of RES technologies and generation level is shown in Figure 10; the figure does not account for the learning curve impacts which were also considered in the Green-X model.
In the ‘no target’ scenario, RES-support is completely phased out by 2026. The rising support requirement in the two decarbonisation target scenarios is partly explained by the locational impact caused by the relatively high technical RES potential utilisation at the end of the period. This is stronger than the effect of the increasing wholesale elec- tricity price, which reduces the need for additional support.
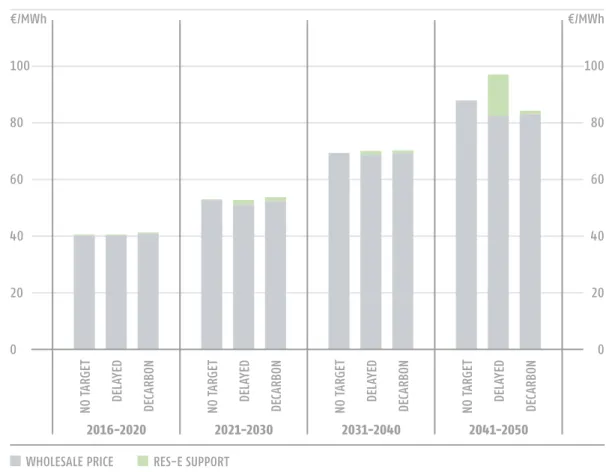
Renewable energy investments may be incentivised with a number of support schemes using funding from different sources; in the model sliding feed-in premium equivalent values are calculated. Revenue from the auction of carbon allowances under the EU ETS is a potential source of financing for renewable investment. Figure 12 contrasts cumu- lative RES support needs with ETS auction revenues, assuming 100% auctioning, and taking into account only allowances to be allocated to the electricity sector.
With more reliance on both gas and lignite fired generation, auction revenues are expected to be higher in Macedonia in the ‘no target’ and ‘delayed’ scenarios than in FIGURE 10
LONG TERM COST OF RENEWABLE TECHNOLOGIES IN MACEDONIA (€/MWh)
FIGURE 11 AVERAGE RES SUPPORT PER MWh OF TOTAL ELECTRICITY CONSUMPTION AND AVERAGE WHOLESALE PRICE, 2016-2050
(€/MWh)
FIGURE 12 CUMULATIVE RES SUPPORT AND AUCTION REVENUES FOR 4 AND 10 YEAR PERIODS, 2016-2050 (m€)
the ‘decarbonisation’ scenario. From a budgetary perspective, the ‘no target’ scenario is the most advantageous, with a combination of insignificant RES support (zero after 2025) and auction revenues above 100 mEUR in the 2031-40 and 2041-50 periods. On the other hand, the budgetary balance is especially unfavourable in the 2040s in the
‘delayed’ scenario, when support needs are expected to exceed auction revenues.
A financial calculation was carried out on the stranded costs of fossil based genera- tion plants that are expected to be built in the period 2017-2050. New fossil genera- tion capacities included in the scenarios are defined either by national energy strategy documents and entered into the model exogenously, or are built by the investment algorithm of the EEMM. The model’s investment module assumes 10 year foresight, meaning that investors have limited knowledge of the policies applied in the distant future. The utilisation rate of fossil fuel generation assets drops below 15% in most SEERMAP countries after 2040; this means that capacities which generally need to have a 30-55 year lifetime (30 for CCGT, 40 for OCGT and 55 for coal and lignite plants) with a sufficiently high utilisation rate in order to ensure a positive return on investment will face stranded costs.
Large stranded capacities might call for public intervention with all the associated cost borne by society/electricity consumers. For this reason we have estimated the stranded costs of fossil based generation assets that were built in the period 2017- 2050. The calculation is based on the assumption that stranded costs will be collected as a surcharge on the consumed electricity (as is the case for RES surcharges) for over a period of 10 years after the these lignite based capacities become unprofitable.
According to this calculation, unprofitable lignite and gas-fired plants would receive 2.9 EUR/MWh in the ‘no target’ and ‘delayed’ scenarios, financed by a surcharge on consumption. There are no stranded costs in the ‘decarbonisation’ scenario. These costs are not included in the wholesale price values shown in this report. In absolute terms, stranded costs are expected to be 287 mEUR in the ‘no target’ and ‘delayed’ scenarios.
5.5 Sensitivity analysis
In order to assess the robustness of the results, a sensitivity analysis was carried out with respect to assumptions that were deemed most controversial by stakeholders during con- sultations and tested for the following assumptions:
•
Carbon price: to test the impact of a lower CO₂ price, a scenario was run which assumed that CO₂ prices would be half of the value used for the three core scenarios for the entire period until 2050;•
Demand: the impact of higher and lower demand growth was tested, with a +/-0.25%change in the growth rate for each year in all the modelled countries (EU28+WB6), resulting in a 8-9% deviation from the core trajectory by 2050;
•
RES potential: the potential for large-scale hydropower and onshore wind power were assumed to be 25% lower than in the core scenarios; this is where the NIMBY effect is strongest and where capacity increase is least socially acceptable.The changes in assumptions were only applied to the ‘decarbonisation’ scenario since it represents a significant departure from the current policy for many countries, and it was important to test the robustness of results in order to convincingly demonstrate that the scenario could realistically be implemented under different framework conditions.
The most important conclusions of the sensitivity analysis are the following:
•
The CO₂ price is a key determinant of wholesale price, with a 50% reduction in carbon price resulting in an approximately 33% decline in the wholesale price over the long term. However, to ensure that the same decarbonisation target is met in the ‘delayed’ scenario, the RES support needed together with the wholesale price is higher than in the ‘decarbonisation’ scenario.•
A low CO₂ price does not change the outlook for coal and gas, which are phased out by 2030 and 2035 respectively, similarly to the ‘decarbonisation’ scenario.•
Wind and solar generation more closely follows demand than hydro, with more than 35%difference compared to the ‘decarbonisation’ scenario in the high and low demand sensi- tivity assessments.
•
Lower hydro and wind potential lead to 8% less electricity generation in 2050. Still, solar generation is expected to increase by 50%. Solar is a more expensive technology than hydro or wind, and adds significantly to RES support requirement in this sensitivity assess- ment compared to the ‘decarbonisation’ scenario; the required RES support in 2050 is com- mensurate with the wholesale price.5.6 Network
Macedonia’s transmission system is well-connected with the neighbouring countries but additional network investments in high voltage transmission lines and the distribution system are needed to accommodate greater RES deployment in the future. The network FIGURE 13
GENERATION MIX (TWh) AND RES SHARE (% OF DEMAND) IN THE SENSITIVITY RUNS IN 2030 AND 2050
will have to cope with higher RES integration and cross-border electricity trade. Contrary to other countries in the region peak load is expected to decrease significantly from 1457 MW in 2016 (ENTSO-E DataBase) to 1160 MW in 2030 (SECI DataBase) and 1400 MW in 2050.
For the comparative assessment, a ‘base case’ network scenario was constructed using the SECI baseline topology and trade flow assumptions to test the network effect of the higher RES deployment in the ‘delayed’ and ‘decarbonisation’ scenarios.
The network analysis covered the following ENTSO-E impact categories:
•
Contingency analysis: Contingencies are not identified in the analysis of the network constraints for Macedonia if the planned transmission network developments included in the ENTSO-E TYNDP are realised.•
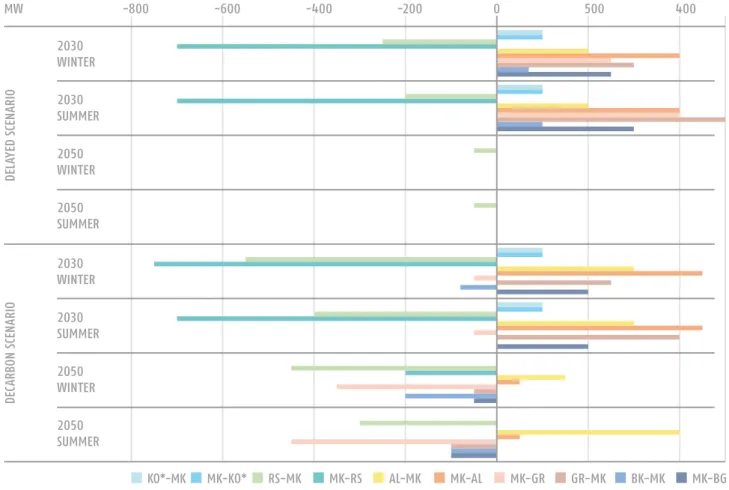
TTC and NTC assessment: Total and Net Transfer Capacity (TTC/NTC) changes were evaluated between Macedonia and its neighbours for all scenarios relative to the ‘base case’. The production pattern (including the production level and its geographic distribu- tion), and load pattern (load level and its geographical distribution, the latter of which is not known) have a significant influence on NTC values between Macedonia’s neighbour- ing electricity systems. Figure 14 presents the changes in NTC values for 2030 and 2050 reveals two countervailing effects caused by higher RES deployment. First, the high con- centration of RES in a geographic area may cause congestion in the transmission network, reducing NTCs and requiring further investment. Second, if RES generation replaces imported electricity it may increase NTC for a given direction.FIGURE 14 NTC VALUE CHANGES IN 2030 AND 2050
IN THE ’DELAYED’
AND ’DECAR- BONISATION’
SCENARIOS COMPARED TO THE ’BASE CASE’
SCENARIO
As the results show, values increase in general in 2030 in both scenarios, with the exception of the neighbouring Serbian system. In general, the impacts do not exceed 400 MW, with the exception of the Serbia-Macedonia direction. In 2050 in the 'decar- bonisation' scenario more direction suffer NTC reduction but to a limited extent. This shows that the ‘congestion’ impact of RES is unlikely to seriously hinder the projected increase of electricity trade.
•
Network losses: Transmission network losses are affected in different ways. On the one hand losses are reduced as renewables, especially PV, are connected mostly to the distribution network and as a result the distance between production and consump- tion decreases. On the other hand, high levels of electricity trade, in particular in 2050, will increase transmission network losses.As the figure illustrates, the higher RES deployment in the two scenarios have no sig- nificant impact on losses in 2030. By 2050 the variation in losses are more pronounced, but still do not exceed 20 MW. In addition, the winter and summer seasonal impacts to losses are different, with a limited 11-14 GWh loss variation in the year 2030. In 2050, the amount of avoided loss is insignificant in the ‘decarbonisation’ scenario, and losses might increase for the ‘delayed’ scenario (28 GWh).
Overall, the network modelling does not show any congestion in the Macedonian transmission network, if the planned TYNDP developments are realised in the future.
The network modelling does not include investment needs related to the development of the distribution network, which may be significant due to growth in solar genera- tion capacity in particular.
5.7 Macroeconomic impacts
A ‘baseline’ scenario differing from the three core scenarios was constructed for the macroeconomic analysis to serve as a basis for comparison whereby only power plants with a final investment decision by 2016 are built, investment rates in the sector remain FIGURE 15
LOSS VARIATION COMPARED TO THE BASE CASE IN THE ’DELAYED’
AND ’DECAR- BONISATION’
SCENARIOS (MW, NEGATIVE VALUES INDICATE LOSS REDUCTION)
unchanged for the remaining period, no ‘decarbonisation’ targets are set and no addi- tional renewable support is included beyond existing policies. The ‘baseline’ scenario assumes lower levels of investment than the three core scenarios.
The ‘baseline’ scenario suggests that Macedonia will experience economic growth of around 4% per annum until 2025, slowing down to around 3% from 2026 to 2030.
This latter tendency could mostly be explained by fiscal consolidation efforts to stabilize public debt. Later on, as the country approaches the EU average, real convergence slows down further and GDP growth could be around 2%. Gross government debt is projected to stabilize around 45% of GDP, while gross external debt will be around 50% of GDP over the longer term.
Household electricity expenditure to income is at 4%, which is higher than the regional average of 2.5% and projected to increase to around 6% by 2050. This mostly reflects the rise of real wholesale electricity prices which is only partially offset by improving energy intensity, while the effect of renewable support is foreseen to remain roughly constant.
The three core scenarios represent a moderate investment effort compared to the
‘baseline’ scenario and even in the most intensive periods additional investment is below 1% of GDP. In the ‘no target’ scenario, the investment is concentrated in two periods: before 2020 and 2026-2035. In the ‘decarbonisation’ scenario the intensive investment period begins after 2020, and remains relatively persistent. The investment in the ‘delayed’ scenario remains in the 0.4-0.6% range of GDP.
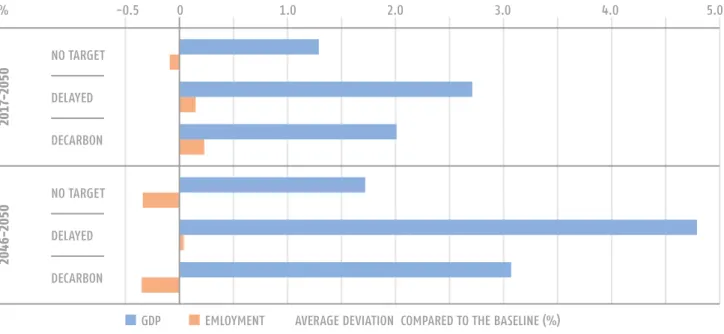
The macroeconomic results were evaluated along three dimensions: macroeconomic gain, macroeconomic vulnerability and affordability. Macroeconomic gain explains the extent to which the scenarios contribute to greater overall economic activity, measured by GDP and employment across two time dimensions. First, the average difference over the whole time horizon (2016-2050) is compared with the baseline. Then the long term effect is determined by the deviation from the baseline in the period 2046-2050. It is important to note that because the population remains the same across scenarios GDP gains also reflect GDP per capita effects.
FIGURE 16 GDP AND EMPLOYMENT IMPACTS COMPARED WITH THE ‘BASELINE’
SCENARIO
Results from the three core scenarios suggest moderate macroeconomic gains. In the ‘decarbonisation’ scenario the GDP level is expected to increase by 2% on average until 2050 compared to the ‘baseline’ scenario. The long-term GDP effect is somewhat higher at 3%. Gains are slightly more significant in the ‘delayed’ scenario, about 2.5%
on average for the whole horizon and almost 5% in the long term. The ‘no target’
scenario has the lowest GDP impact at around 1% on average. Employment effects are very small, and even slightly negative in the longer term.
Long term GDP gains in the ‘decarbonisation’ and ‘delayed’ scenarios emerge from two sources. The additional investment raises the level of productive capital in the economy and the newly installed, mostly foreign technologies increase overall produc- tivity. The lower employment gains compared to the GDP effect are explained by two factors: (i) the energy investments are relatively capital intensive and (ii) the initial employment gains are translated into higher wages in the longer term, as labour supply remains the same across scenarios.
The macroeconomic vulnerability calculation captures how the additional invest- ments contribute to the sustainability of the fiscal and external positions of the country measured by the fiscal and external balances and the public and external debt indica- tors. While the fiscal and external balances are compared to the ‘baseline’ scenario over the whole projection horizon (2017-2050), the debt indicators focus on the long term effects, with the difference from the baseline only calculated at the end of the modelled period. This approach is consistent with the fact that debt is accumulated from past imbalances.
Each of the three core scenarios improve the macroeconomic vulnerability of Macedonia as a result of lower energy imports. Long term external debt declines by around 15% of GDP in the ‘no target’, 20% ‘delayed’ and 8% in the ‘decarbonisation’
scenarios. These results reflect the improvement in the current account due to lower FIGURE 17
PUBLIC AND EXTERNAL BALANCES AND DEBT IMPACTS COMPARED WITH THE ‘BASELINE’
SCENARIO