Methodologies to evaluate ecosystem services focusing on Hungarian case studies
Budapest, 2011
Published by CEEweb for Biodiversity,
1021 Budapest, Széher út 40., Hungary, www.ceeweb.org
This publication may be reproduced for educational or non-profi t purpose without special per- mission from the copyright holders,
provided acknowledgement of source is made.
© CEEweb for Biodiversity ISBN 978-963-87218-7-7
Editors: Gergő Gábor Nagy, Veronika Kiss Authors:
Zsófia Bakacsi, Borbála Balázs, Marianna Biró, Zoltán Botta-Dukát, Bálint Czúcz, Miklós Dombos, Zsuzsanna Flachner†, Ferenc Horváth, Eszter Kele- men, Sándor Kerekes, Miklós Kertész, Márton Kiss, Éva Konkoly-Gyuró, An- drás Donát Kovács, Edit Kovács-Láng, György Kröel-Dulay, Péter László, Zsu- zsanna Marjainé Szerényi, Katalin Mázsa, Simon Milton, Zsolt Molnár, Gergő Gábor Nagy, Gábor Ónodi, László Pásztor, Andrea Samu, József Szabó, Eszter Tanács
English lectors: Julie Teresa Shapiro, Mátyás Prommer We would like to thank for the very kind contribution of Orsolya Haas,
Dóra Kispál, Nóra Lovas, Zsófi a Vágvölgyi and Szilvia Veréb to realize this publication.
Typeset and design: Tímea Tóth Printed by Media-Press ’91 Kft.
Published with the fi nancial support of the European Commission. The contents of this publica- tion do not necessarily refl ect the position or opinion of the European Commission.
An interpreter between people and landscapes –
Zsuzsanna Flachner (1965 – 2010) 5
Introduction 7
Éva Konkoly-Gyuró
Conceptual evolvement of the landscape functions assessment 10 Ferenc Horváth, Zsolt Molnár, Bálint Czúcz, Katalin Mázsa, Borbála Balázs, Gábor Ónodi, Miklós Kertész
The inventory state and assessment of Hungary’s natural habitats 26 in terms of ecosystem services
Bálint Czúcz, Zsolt Molnár, Ferenc Horváth, Zoltán Botta-Dukát
Vegetation-based natural capital index: an easy to understand, 44 policy relevant ecosystem state indicator
László Pásztor, József Szabó, Zsófi a Bakacsi, Miklós Dombos, Péter László Functional soil mapping to regionalise certain natural services of soils 52 Zsuzsanna Marjainé Szerényi, Sándor Kerekes, Zsuzsanna Flachner†,
Simon Milton
The possibility of the economic evaluation of ecosystem services 64 described through a domestic case study
Márton Kiss, Andrea Samu, Eszter Tanács
Possibilities of model-based evaluation of ecosystem services, on the example of a case study using a Bayesian network for examining eutrophication 76 Miklós Kertész, Eszter Kelemen, Marianna Biró, Edit Kovács-Láng,
György Kröel-Dulay
Ecosystem services and disturbance regime as linkages between 92 environment and society in the Kiskunság region
Gergő Gábor Nagy, Zsuzsanna Flachner†
Potential land use changes in fl oodplain areas for enhancing 112 the provision of ecosystem services
András Donát Kovács
Primal statements and some empirical results related to the environmental consciousness in the Great Hungarian Plain 126
AN INTERPRETER
BETWEEN PEOPLE AND LANDSCAPES – Zsuzsanna Flachner (1965 – 2010)
©Csaba Lóki
Zsuzsanna Flachner was a senior research associate of the Research Institute for Soil Science and Agricultural Chemistry (RISSAC) at the Hungarian Academy of Sciences.She spoke not only English, Russian and Dutch, beside her native Hun- garian language; but also the language of waters, living landscapes, the river Tisza and the local people. Everyone with whom she worked appreciated her professional knowledge. She understood also the language of scientists NGOs, politicians, busi- ness professionals, teachers and students. She translated for those who did not get along well with or misunderstood each other, helped man and man, man and land- scape to fi nd each other again.
It is diffi cult even to list the fi elds she was familiar with. One of her most imported projects was mapping social, economic and environmental interactions.
Economists had long advocated for the research of ecosystem services, which she carried out, but it was harder for scientists to accept it. However, she always had an idea how to use research fi ndings to achieve our common goals for building a better world for man and nature.
In addition to all of these, Zsuzsanna Flachner was an activist and com- munity organizer too. She was a woman who loved and made profi t of knowledge and cognition, not only for themselves, but always for an additional good cause.
She was among the founders of Alliance for the Living Tisza Association (ALT) and she was a member of the organization’s advisory board. Moreover, until her death she was the president of CEEweb for Biodiversity as well as a member of other professional organizations. She was awarded Pro Natura Award posthumously in 2011 for coordinating NGOs in nature protection and for her activities in biodiver- sity conservation in the Tisza region.
She was full of vitality, cheerfulness, creativity, and possessed perfect or- ganizational skills throughout her life. She managed to carry out fi ve to six projects at a time with an incredible working capacity and enthusiasm. She never accepted the obstacles emerged along the way, and thus she made those around her solve seemingly impossible tasks as well. She lived with incredible energy and she was always ready to give greatest human or professional help.
Zsuzsa retained her cheerfulness, hope, vitality throughout her whole life.
Until the last moments we never heard any complaints from her. On the contrary, she always talked about the way how she would recover from her long illness.
She passed away with dignity, but her life does not remain unfi nished. We all pain- fully miss her, but her thoughts, results, hope and dynamism keep living in us.
Initiatives, organizations, and programs she started will continue, led by her fellow workers and friends. Her life remains a part of all of our lives.
Loving friends of her
INTRODUCTION
©Gergő Gábor Nagy
In the modern societies humans are largely managing the world’s natural resources such as soil, fresh water, food, or timber, as limitless, never-ending resources, although once used, their renewal requires time.
Over the past few decades, our demand for these resources has grown considerably due to exponential economic growth and population boom.
This has put pressure on Earth’s ecosystems on an unprecedented scale, including habitat loss and degradation, climate change, biological inva- sions, overexploitation and pollution. Humankind consumed the ecologi- cal resources available for the whole year during less than the first nine months of 2011. The balance of demand-supply collapsed more than one month earlier than it had in 2009.
This excessive demand for natural resources and land result in im- mense loss of biodiversity, one which is 100-1000 times higher than the background rate. Since all ecosystem services obtained from nature, such as food, fresh water, disaster prevention, soil formation, directly or indi- rectly depend on biodiversity, halting biodiversity loss has become a cen- trepiece of environmental policies at all levels. In 2001 the European Union set the target on halting biodiversity loss by 2010, which was translated into global commitment one year later to significantly reduce the rate of biodiversity loss by the same time. But these targets were not met and thus they were revised at global as well as at EU levels.
Reducing pressures that threaten natural systems requires a change in our approach. This change must take place simultaneously at all social and political levels, since it depends on communities of all sizes (settle- ment, regional, national, EU, UN) in order to protect and maintain biogeo- graphic space in a harmonized way and in cooperation with one other.
Among the drivers behind biodiversity loss, values of society (being cultural drivers) are significant and largely determine the current unsus- tainable consumption and production patterns. Attitudes towards ecosys- tem services influence many of our actions, several of which are currently harm the environment directly or indirectly. Therefore, we must balance our values so that we appreciate services provided by nature more and put less emphasis on consumption and material wealth. In this vein, criticism of GDP has been emerging, since this indicator measures only economic growth and does not consider human well-being and the maintenance of natural conditions.
Attitudes towards ecosystems affect not only environmental, but also socio-economic decisions. The main challenge to develop proper policies is to dig down to the bottom of the problems and tackle the driv- ers behind them, instead of implementing end-of-pipe solutions. Policies should aim to reduce the total human pressure on ecosystems, including the unsustainable use of land and the overuse of natural resources and ecological space. In addition to changing the current harmful practices, political efforts should also aim at restoring degraded ecosystems to im- prove spatial structures and enhance ecosystem functions.
During formulating and implementing policies, it should be fully considered that natural and socio-economic systems work together in- separably. Each ecosystem on any scale is multifunctional; it provides nu- merous services to sustain nature as well as human society. Therefore, policies should aim to maintain and harmonize the diversity of ecosystem functions, especially in planning and management. Bearing cultural, in- stitutional and structural drivers of biodiversity loss in mind, even the mi- nor daily decisions of individuals may impact the state of the surrounding landscape, not to mention decisions arising from local and regional spatial planning and development decisions.
In environmental sciences, descriptive and analytical research is increasingly being replaced by systematic-approach, which concentrates rather on the analysis of interactions and cause-effect relationships. This publication aims to show good examples of proper measures and models to evaluate natural values and to integrate them properly into policies.
Methods presented in the articles could play fundamental role in decision making, by presenting possible environmental and social consequences of particular policies.
INTRODUCTION
OF THE LANDSCAPE
FUNCTIONS ASSESSMENT
Éva Konkoly-Gyuró
University of West Hungary, Faculty of Forestry, Institute of Forest Management and Rural Develop- ment
9400 Sopron, Cházár András tér 1.
E-mail: egyuro@emk.nyme.hu
1. Introduction
In environmental sciences, descriptive and analytical research is increasingly being replaced by the system-approach, concentrating on the analysis of interactions; and cause and effect relationships. That is especially true for studies focusing on spatial systems. Both natural units (habitats, eco- systems) and administrative units (land, region, county) have various functions.
Every landscape, natural or transformed, provides many services for both nature and for human society. Research dealing with the assessment of the territorial functions and services focuses on the interactions of the natural and human sys- tems. These studies could play a fundamental role in decision making, by repre- senting the possible environmental and the social consequences of policies.
Based on a survey of the literature, this paper gives an overview of the evolution of the concept of landscape functions and proposes a new, coherent classifi cation system for its assessment. This can offer a suitable base to sur- vey multifunctionality and to measure each function and be used in landscape/
regional impact assessments and planning.
2. The roots of the landscape function concept
The roots of the landscape function concept go back to the recogni- tion of the multifunctionality of forests and green spaces. The idea of the positive environmental and social impacts and direct and indirect services of vegetated areas emerged in connection with the rapid expansion of built-up areas and the degradation and the endangerment of the natural systems.
It became clear that beyond economic welfare, the physiological and psycho- logical services that ecosystems provide are important for our well-being.
The fi rst papers on the environmental role and the benefi cial func- tions of forests are originated from the 1960s. They pointed out the medical and recreational benefi ts of forests and their positive impact on climate, air quality, water management and soil protection (Héder and Mészöly 1969;
Keresztesi 1968; Mészöly 1981). Hungarian foresters defi ned three basic functions (economic, environmental and recreational) of forests and proposed to acknowledge them as a basic concern in forest management planning.
That proposal was accepted at the World Forestry Congress organized in Buenos Aires, in 1972 (FAO 1972; Lett 2007).
The description of the functions and services of green spaces can be found in the literature of landscape architecture (Jámbor et al. 1982; Radó 1981; 2001), from the 1980s. Based on these sources, the multiple functions of green spaces was presented in an extended form in the book Environmen- tal Planning (Konkolyné-Gyuró 2003) explaining the special ecological condi- tions of settlements and their various demands for use of green spaces.
The three main function groups of green spaces are: environmental regulation, recreation and provision of information, and aesthetic qualities.
- Environmental regulation: A vegetated surface positively affects the eco- logical conditions of all living creatures in the settlements (local climate, noise prevention, air and water quality, water management, prevention of qualitative and quantitative soil degradation). The extent of these benefi ts depends on the extent of the vegetated surface and the quantity of the photosynthesizing leaves.
- Recreation: Another important function of green areas is the provision of adequate space and facilities for outdoor recreation (playing, sports, hik- ing, relaxing, hunting, fi shing, bathing, and healing) in parks, gardens and in urban forests. Nowadays ecotourism has an increasingly important role in providing natural, semi-natural areas away from human settlements.
- Information, aesthetics: Gardens, parks, cemeteries, arboretums, botani- cal and historical gardens, forests, greenways and study trails along wa- ters and across different habitats play an important role in education, sci- entifi c research, dissemination, and perception of landscapes as well as in preservation of the cultural heritage and traditions. The aesthetic role is also signifi cant in all of the green spaces. The aesthetic role is gener- ally understood as an embellishment of the environment, although it has a much broader sense. Aesthetics means a cognitive process through the perception and understanding the place that results in getting information about the place and the whole landscape. It also refers to a positive psy- chological effect, provided by the pleasant scenery of the vegetation and water, the soft sounds, the climate comfort, and the spiritual associations (Konkolyné-Gyuró 2003).
The third precedent has been the concept of agricultural multifunc- tionality, originated from the fi rst reform of the Common Agricultural Policy of the European Union in 1992 (Ángyán et. al. 1999). In this approach (similarly to the three basic functions of the forests) the production, the social/cultural and the landscape/nature-conservation role of agriculture was acknowledged (EEC 1992). The European Charter of Rural Areas is an important document, which emphasises the importance of multifunctionality in agriculture. Aside from food production, the document points out the signifi cant role of agriculture in land- scape management, in the preservation of rural traditions, heritage and cultural properties as well as in social cohesion (Szakál 1996).
A further series of papers has been recently published on this topic.
Huylenbroeck’s article, published in 2007, gives a comprehensive overview of them. It mentions two main approaches for interpreting and defi ning agricul- tural functions. One describes the opportunities and the services that agricul- ture provides and the other shows its functions from the point of view of social demand.
The author outlines four main function groups of opportunities and services.
- The fi rst one is the „green function” including habitat and biodiversity pres- ervation, the carbon- and nutrient cycle regulation and landscape manage- ment.
- The second is the “blue function” comprising the benefi ts related to waters and energy generation. The most important are: water retention, water qual- ity control, and fl ood-prevention, as well as generation of hydropower and wind energy.
- The third group is the “yellow function”, the cultivation, contributing to the rural areas vitality and cohesion, the utilization and maintenance of rural cul- tural heritage and traditions as well as the preservation of regional identity.
The “yellow function” includes hunting, agro-tourism, and other forms of recreation.
- Finally several authors mention the “white function”, which means food safety.
Looking at the multifunctionality of forests, green spaces and agriculture, their common ground becomes evident. All three are vegetated spatial units and ecosystems even if they are not all natural. Diversity within and between habitat types of a region plays an important role in multifunctionality. The more ele- ments the system has, the more functions it can provide. Therefore attention should be turned towards ecosystem services and landscape functions.
3. Ecosystem services and functions of rural areas
Recommendations for the survey and evaluation of ecosystem functions and services were published in the Millennium Ecosystem Assessment (MEA 2003). The core idea of this report is the recognition of the strong connection be- tween the condition of ecosystems and human well-being. Based on several previ- ous studies, it summarizes the functions and services that ecosystems can provide for humans. These include the role of sustaining biophysical systems on Earth that create suitable living conditions for all living creatures and provide natural and so- cial benefi ts for humanity. All these goods and services are called natural capital (e.g. Costanza et al., 1997; de Groot et al. 2002).
The existence of human society is inherently linked to landscapes or re- gions. Therefore, the investigation of ecosystem functions has to address all serv- ices provided by both natural and transformed ecosystems in a certain landscape or region. This idea led to the assessment of landscape functions. At the begin- ning, landscape multifunctionality studies focused on rural areas and applied un- changed function groups formerly used for assessing ecosystem services. In rural landscapes, where land cover is mostly semi-natural, ecosystem and landscape functions are highly similar to the services provided by natural areas.
A wide range of goods and services are reviewed in publications concerned with ecosystem and landscape functions (de Groot 1992; 2000; Bastian 1996; Cos- tanza et al. 1997; Daily et al. 2000; MEA 2003). Despite some differences, the clas- sifi cations distinguish three main function groups: regulation and conservation (environmental regulation, habitat protection); production and provision (primary biomass production and provision of territory for different human activities); and recreation, information (mental and physical recreation, aesthetic values and infor- mation about the cultural and natural heritage). Based on his former publications (de Groot 1992; de Groot et al. 2002) de Groot describes fi ve function groups:
- Regulation functions: This group of functions relates to the capacity of natu- ral and semi-natural ecosystems to regulate essential ecological processes and life support systems through biogeochemical cycles and other biospheric processes. Regulation functions maintain a ‘healthy’ ecosystem at differ- ent levels and, at the biosphere level, provide and maintain the conditions for life on Earth. In many ways, these regulation functions provide the necessary pre-conditions for all other functions. Thus, care should be taken not to dou- ble count their value in economic analysis. In theory, the number of regula- tion functions would be almost infi nite. But for landscape planning, only those
regulation functions, which have direct and indirect benefi ts to humans (such as maintenance of clean air, water and soil, prevention of soil erosion and bio- logical control services) are considered to provide services,
- Habitat functions: Natural ecosystems provide refuge and reproduction-habi- tats for wild plants and animals and thereby contribute to the (in situ) conserva- tion of biological and genetic diversity and evolutionary processes. As the term implies, habitat functions relate to the spatial conditions needed to maintain biological (and genetic) diversity and evolutionary processes. The availability, or condition, of this function is based on the physical aspects of the ecologi- cal niche within the biosphere. These requirements differ for different species groups, but can be described in terms of the carrying capacity and spatial needs (minimum critical ecosystem size) of the natural ecosystems.
- Production functions: Photosynthesis and nutrient uptake by autotrophs converts energy, carbon dioxide, water and nutrients into a wide variety of car- bohydrate structures, which are then used by secondary producers to create an even larger variety of living biomass. That biomass provides many resources for human use, ranging from food and raw materials (fi ber, timber, etc.) to en- ergy resources and genetic material.
- Information functions: Because most of human evolution took place within the context of undomesticated habitat, natural ecosystems provide an essen- tial ‘reference function’ and contribute to the maintenance of human health by providing opportunities for refl ection, spiritual enrichment, cognitive develop- ment, re-creation and aesthetic experience.
- Carrier functions: Most human activities (e.g. cultivation, habitation, trans- portation) require space and a suitable substrate (soil) or medium (water, air) to support the associated infrastructure. The use of carrier functions usually involves permanent conversion of the original ecosystem. Thus, the capacity of natural systems to provide carrier functions on a sustainable basis is usually limited (exceptions are certain types of shifting cultivation and transportation on waterways, which, on a small scale, are possible without permanent dam- age to the ecosystem)” (de Groot 2006).
Although de Groot’s concept of functions and services provided by rural landscape is becoming crystallized and many research projects have been carried out on this basis, there are still several methods for the assessment and valua- tion of landscape functions. One possibility is the participative function valuation controlled by experts. The other is the dynamically developing GIS assessment.
A good example for the fi rst one is the landscape function valuation in Ukraine in the delta of the Dniestr River. In this research the signifi cance of each landscape function has been defi ned at a workshop with the participation of local people and stakeholders. The possible future changes in the functions has been also revealed and used for the presentation of land-use confl icts (Figure 1).
Figure 1: Main issues at stake in the Dniestr delta confl ict analysis (de Groot 2006).
Some recent papers focus on GIS methods for assessing landscape func- tions. These studies do not take into account all functions but focus on some se- lected ones related to land use potentials and changes (Willemen et al. 2008; Ver- bung et al. 2009).
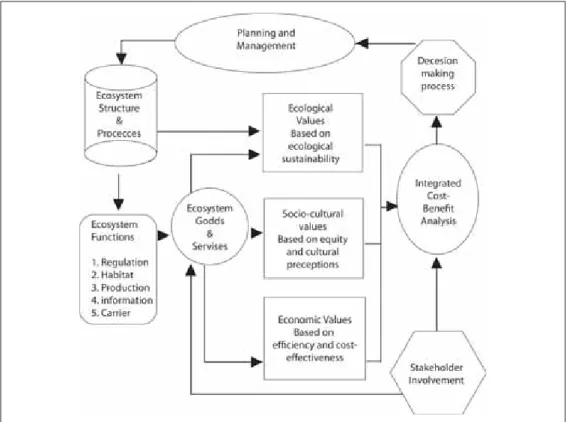
Knowledge about ecosystem services and landscape functions might ef- fectively support decision making and planning because it provides transparent information about the changes and threats of the natural and cultural goods and services provided by living systems (Figure 2).
Figure 2: Role of function-analysis and valuation in environmental planning, management and in decision-making after de Groot 1992; de Groot et al 2002 (de Groot 2006).
4. Land use functions
An overview of the presented functions makes it obvious that some of them, e.g. production provision of space and recreation, are inherently linked to the human use. Without human activities, they exist only as potentials. In the landscapes that are transformed by human activities, the role of different land uses and artifi cial surfaces have to be taken into account beyond the eco- system services. It is not only goods and services are present in the landscape, but also the driver functions of the land uses and the related land cover types.
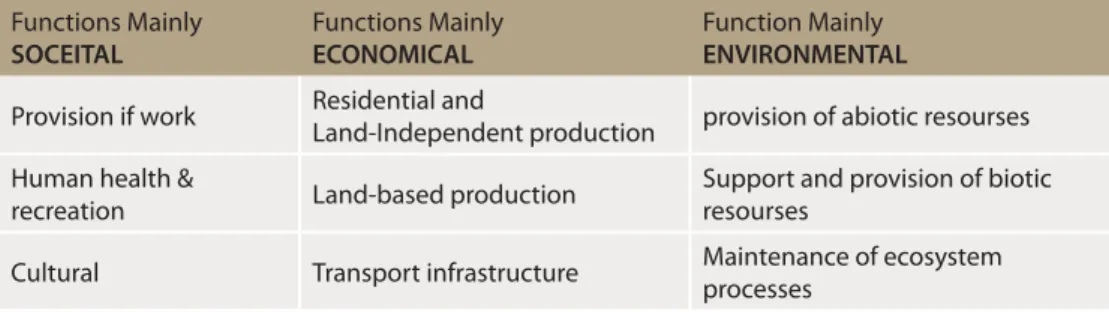
They are called “land use functions” in research reports and papers (SENSOR 2009; Perez-Soba et al. 2008). This concept has been established within the European integrated research project SENSOR, aiming to develop an ex-ante sustainability impact assessment tool. Nine land use functions (Table 1) have been chosen that refer to three function-classes: “mainly societal” “mainly economic” and “mainly environmental” land use functions.
Functions Mainly SOCEITAL
Functions Mainly ECONOMICAL
Function Mainly ENVIRONMENTAL Provision if work Residential and
Land-Independent production provision of abiotic resourses Human health &
recreation Land-based production Support and provision of biotic resourses
Cultural Transport infrastructure Maintenance of ecosystem processes
Table 1: The nine land-use functions, LUFs (SENSOR 2009).
“The defi nitions of the LUFs are as follows:
Mainly societal LUFs
- LUF 1 Provision of work: employment provision for all in activities based on natural resources, quality of jobs, job security and location of jobs (con- straints e.g. daily commuting).
- LUF 2 Human health & recreation (spiritual & physical): access to health and recreational services, and factors that infl uence the quality of services.
- LUF 3 Cultural (landscape identity, scenery & cultural heritage): landscape aesthetics and quality and values associated with local culture.
Mainly economic LUFs
- LUF 4 Residential and land-independent production: provision of space where residential, social and productive human activity takes place in a concentrated mode. Utilisation of space is largely irreversible due to the nature of activities.
- LUF 5 Land-based production: provision of land for production activities that do not result in irreversible change, e.g. agriculture, forestry, renew- able energy, land-based industries such as mining.
- LUF 6 Transport infrastructure: provision of space used for roads, railways and public transport services, involving development that is largely irre- versible.
Mainly environmental LUFs
- LUF 7 Provision of abiotic resources: the role of land in regulating the sup- ply and quality of air, water and minerals.
- LUF 8 Support and provision of biotic resources: factors affecting the ca- pacity of the land to support biodiversity, in the form of genetic diversity of organisms and diversity of habitats.
- LUF 9 Maintenance of ecosystem processes: the role of land in the regula- tion of ecosystem processes related to the production of food and fi bre, the regulation of natural processes related to the hydrological cycle and nutri- ent cycling, cultural services, and ecological supporting functions such as soil formation” (SENSOR 2009).
Different indicators have been introduced to measure the performance of land use functions in the different land use change scenarios in each Eu- ropean region. The result of these valuations is presented in spiderweb dia- grams. An example is shown in Figure 3.
Figure 3: Sustainability assessment can be represented by a spiderweb diagram that shows the performance of the nine LUFs under different scenarios (SENSOR 2009).
5. Active and passive functions
Looking at the core idea of these approaches, an important aspect emerges, namely the existence of or lack of human contribution to these func- tions. Accordingly, we can distinguish between three types of roles. Firsts are the regulation and life sustaining functions of the natural systems (environ- mental regulation, habitat protection). Second are the potentials of the land- scape (biomass, raw material production and opportunities for different land uses as well as provision of information and aesthetic qualities). They exist as goods or potential goods provided by the nature that have signifi cance only due to human use. The third group of functions includes the services provided by human activities (settlements, infrastructure, recreational facilities and farm land etc). The basic difference between the fi rst two and the third group is the human contribution. Natural systems are able to function independently from people. The potentials exist without any social utilization. Therefore functions of the fi rst two groups are called passive functions, whereas functions in the third group, originating from the use of their potentials are called active func- tions.
In this chapter we recommend a system for the valuation of ecosystem services (“rural landscape functions”), land use and landscape functions by introducing the terms of active and passive functions. The passive and active functions exist together both in the cultural and natural landscapes.
5.1. Passive functions
Passive functions are potentials of nature, which can exist without hu- man activity and act through the processes of natural systems. They are goods and services arisen from ecosystems.
I.1. Biophysical functions I.1.1. Atmospheric regulation, air protection
I.1.1.2. Gas, ozone regulation I.1.1.3. Climate regulation I.1.2. Water regulation, protection I.1.2.1. Water protection and retention
I.1.2.2. Provision of water supply I.1.2.3. Flood prevention
I.1.3. Soil protection I.1.3.1. Soil formation
I.1.3.2. Soil water management regulation
I.1.3.3. Erosion control I.1.3.4. Defl ation control I.1.4. Conservation of biological system and biodiversity I.1.4.1. Refugium
I.1.4.1. Habitat I.1.4.2. Pollination
I.1.4.3. Biological control 5.2. Active functions
Active functions exist only through active human contributions.
They are land-use functions of the transformed landscapes in artifi cial areas (set- tlements, agricultural areas and mines, recreation and infrastructural areas).
In addition to the passive functions, these active landscape functions are equally important for human life.
I.1.5. Production of biomass I.1.5.1. Food
I.1.5.2. Raw materials for industry I.1.5.3. Medical materials
I.1.5.4. Energy source I.1.6. Complex functions
I.1.6.1. Regulation of material fl ow I.1.6.2. Disturbance prevention I.1.6.3. Natural regeneration I.2. Information,
psychological functions I.2.1. Information
I.2.1.1. Scientifi c information, education
I.2.1.2. Reference for functioning
of biological systems I.2.1.3. Genetic information I.2.2. Psychological conditioning I.2.2.1. Aesthetic experience (cognitive, artistic) I.2.2.2. Historical, spiritual information
I.2.2.3. Human psychological recreation
Table 2: Passive landscape functions
II.1. Settlement II.1.1. Living
II.1.1.1. Urban living II.1.1.2. Rural living
II.1.2. Central, administrative II.1.3. Defence
II.1.4. Human infrastructure/services II.1.4.1. Culture, heritage protection II.1.4.2. Education
II.1.4.3. Science II.1.4.4. Health care II.2. Production
II.2.1 Agricultural production II.2.1.1. Arable land cultivation II.2.1.2. Grassland pasturage II.2.1.3. Viticulture
II.2.1.4. Horticulture
II.2.1.5. Fishery, reed extraction II.2.1.6. Hunting
II.2.2. Forestry
II.2.3. Industry – mining
II.2.3.1. Industrial production II.2.3.2. Energy production II.2.3.3. Raw material extracting
II.3. Infrastructure, communication II.3.1.Transport
II.3.1.1. Road transport II.3.1.2. Railway
II.3.1.3. Navigation II.3.1.4. Aviation
II.3.2. Technical infrastructure II.3.2.1. Public utilities II.3.2.2. Waste management II.4. Recreation, tourism
II.4.1. Water related recreation II.4.1.1. Recreation at lakes II.4.1.2. Recreation at rivers and streams
II.4.1.3. Spa recreation II.4.1.4. Recreation at sea II.4.2. Recreation in green areas II.4.2.1. Recreation in forest II.4.2.2. Recreation at agrarian and horticultural area II.4.2.3. Recreation in parks II.4.3. Special recreation/
tourism forms II.4.3.1. Ecotourism II.4.3.2. Rural tourism II.4.3.3. Cultural tourism II.4.3.4. Cycling tourism
II.4.3.5. Winter-sport/recreation II.4.3.6. Wine and gastro-tourism Table 3: Active landscape functions
6. Conclusions
Natural and socio-economic systems work together inseparably. Every landscape, parish or region is multifunctional, providing numerous services to sustain nature as well as human society. The diversity of functions and their relative importance can greatly differ amongst landscapes with different bio- physical characteristics and land uses types. The diversity of the functions in different territories has to be maintained and harmonized in policies, espe- cially in planning and management. We continuously seek to resolve confl icts, to generate benefi cial co-existence of utilizations resulting in a cooperative prosperity. Landscape function analysis is a useful tool for balancing interests and provides important information for decision making and planning, mainly for sustainable development strategies.
According to these concepts, it is clear that till today the functions and services of natural, semi-natural ecosystems and areas transformed by hu- man activities used to be analyzed and evaluated separately. Nevertheless in reality, they interact with each other. Application of the proposed classifi cation of active and passive functions provides a logical framework for analyzing the landscape functions in a coherent system.
7. Literature
Ángyán, J., Fésüs, I., Podmaniczky, L., Tar, F., Vajnáné Madarassy, A. (1999):
Nemzeti Agrárkörnyezetvédelmi Program a környezetkímélő, a természet védelmét és a táj megőrzését szolgáló mezőgazdasági termelési módszerek támogatására.
Földművelésügyi és Vidékfejlesztési Minisztérium agrár-környezetgazdálkodási ta- nulmánykötetek I., p. 174.
Bastian, O., (1996): Bestimmung von Landschaftsfunktionen als Beitrag zur Leitbil- dentwinklung. Beitrag zum BTUC Workshop ‘Die Leitbildmethode als Planungs- methode’ BTUC Actuelle Reihe, p. 67-79.
Costanza, R., d’Arge, R., de Groot, R. S., Farber, S., Grasso, M., Hannon, B., Limburg, K., Naeem, S., O’Neill, R. V., Paruelo, J., Raskin, R. G., Sutton, P., van den Belt, M., (1997): The value of the world’s ecosystem services and natural capital. Nature 387, p. 253–260.
Daily, G. C., Soderquist, T., Aniyar, S., Arrow, K., Dasgupta, P., Ehrlich, P. R., Folke, C., Jannson, A., Jansson, B. O., Kautsky, N., Levin, S., Lubchenco, J., Maler, K.-G., David, S., Starrett, D., Tilman, D., Walker, B. (2000): The value of nature and the
nature of value. Science 289, p. 395-396.
EEC (European Economic Community) (1992): 2078/92 EU Tanácsi Rendelet a tájfenntar- tás és a környezetvédelem követelményeinek megfelelő mezőgazdasági termelés támogatásáról.
FAO (Food and Agriculture Organization of the United Nations) (1972): Special issue:
Seventh World Forestry Congress Commission VI: The economists, administrators and planners (http://www.fao.org/docrep/d4956e/d4956e0a.htm)
de Groot, R. (2006): Function-analysis and valuation as a tool to assess land use con- fl icts in planning for sustainable, multi-functional landscapes. Landscape and Urban Planning 75, p. 175–186.
de Groot, R. (1992): Functions of Nature: Evaluation of Nature in Environmental Plan- ning, Management and Decision Making. Wolters-Noordhoff, Groningen, 315 p.
de Groot, R., Hein, L. (2007): The concept and valuation of landscape goods and ser- vices. In Mander, Ü., Wiggering, H., Helming, K. (eds.): Multifunctional Land Use – Meeting Future Demands for Landscape Goods and Services, Heidelberg, Springer, p. 15-36.
de Groot, R., Perk, J., van der, Chiesura, A., Marguliew, S. (2000): Ecological functions and socio-economic values of critical natural capital as a measure for ecological integrity and environmental health. In Crabb´e, P. (ed.): Implementing Ecological Integrity. Kluwer Academic Publishers, p. 191–214.
de Groot, R., Wilson, M., Boumans, R. (2002): A typology for the description, classifi ca- tion and valuation of Ecosystem Functions. Goods Services Econ. 41(3), p. 393–408.
Héder, S., Mészöly, G. (1969): Zöldövezeti erdők-tájfásítás. Mezőgazdasági Kiadó.
Budapest, 226 p.
van Huylenbroeck, G., Vandermeulen, V., Mettepenningen, E., Verspecht, A. (2007): Mul- tifunctionality of Agriculture: A Review of Defi nitions, Evidence and Instruments. Liv- ing Reviews in Landscape Research 1, (http://www.livingreviews.org/lrlr-2007-3) Jámbor I. et al. (1982): Zöldfelületrendezés. Egyetemi Jegyzet. Kertészeti Egyetem. Bu-
dapest.
Keresztesi, B. (1968): Magyar erdők. Akadémiai Kiadó, Budapest, 274 p.
Konkolyné-Gyuró É. (2003): Környezettervezés. Mezőgazda Kiadó. Budapest, 398 p.
Lett, B. (2007): Az állam szerepvállalása a közjóléti erdőgazdálkodásban. In Dobó, I., Zé- tényi, Z. (szerk.): Erdők a közjóért. Az Országos Erdészeti Egyesület Erdők a közjóért szakosztály 40 éves jubileumi kiadványa. Budapest.
Mészöly, G. (1981): Parkerdők Magyarországon. Natura, Budapest, 300 p.
MEA (Millennium Ecosystem Assessment) (2003): Assessment: Ecosystems and Human Well-being: A Framework for Assessment. Island Press, Washington D.C., 245 p.
Perez-Soba, M., Petit, S., Jones, L., Bertrand, N., Briquel, V., Omodei, Z., Contitni, C., Helming, K., Farrington, J., Tinacci Mosello, M., Wasccher, D., Kienast, F., de Groot, D. (2008): Land use functions – a multifunctionality approach to assess the impact of land use change on land use sustainability. In Helming, K., Perez-Soba, M., Tab- busch, P. (eds.): Sustainability Impact Assessment of Land Use Changes. Springer.
Radó, D. (1981): Fák a betonrengetegben. Mezőgazdasági Kiadó, Budapest, 100 p.
Radó, D. (2001): A növényzet szerepe a környezetvédelemben. Zöld Érdek Alapítvány - Levegő Munkacsoport, Budapest, 142 p.
SENSOR 2004-2009: Sustainability Impact Assessment: Tools for Environmental, So- cial and Economic Effects of Multifunctional Land Use in European Regions. Inte- grated Project within the EU VI. Research Framework Program. (Fenntarthatósági hatásvizsgálat: Az európai régiók multifunkcionális földhasználatának környezeti, gazdasági és társadalmi hatását vizsgáló eszköz). Integrált Projekt az EU VI Ku- tatási Keretprogramja keretében Magyarországi projektpartner NyME-EMK Környezettudományi Intézet. (www.sensor-ip.org)
SENSOR 2009: Framework and methodology for a regional sustainability assessment based on Land Use Functions. Project Report D.3.2.2.
Szakál, F. (1996): Mezőgazdaság és vidékfejlesztés. Új Európai irányzatok az Európa Tanács tevékenysége és dokumentumai alapján. Környezet- és Tájgazdálkodási Füzetek II/2. GATE-KTI, Gödöllő. 125 p.
Willemen, L., Verburg, P. H., Hein, L., van Mensvoort M. E. F. (2008): Spatial character- ization of lands¬cape functions. Landscape and Urban Planning 88, p. 34-43.
Verburg, P. H., van de Steeg, J., Veldkamp, A., Willemen, L. (2009): From land cover change to land function dynamics: A major challenge to improve land characteriza- tion. Journal of Environmental Management 90, p. 1327-1335.
OF HUNGARY’S NATURAL HABITATS IN TERMS OF ECOSYSTEM SERVICES
Ferenc Horváth*, Zsolt Molnár, Bálint Czúcz, Katalin Mázsa, Borbála Balázs, Gábor Ónodi, Miklós Kertész
Institute of Ecology and Botany of the Hungarian Academy of Sciences 2163 Vácrátót, Alkotmány út 2-4.
*E-mail: horvfe@botanika.hu
©Csaba Lóki
1. Introduction
In 2006 humanity’s ecological footprint was 1.4 times larger than the current carrying capacity of Earth. Our footprint in the beginning of the 1960’s was only the area of 0.6 Earth, but for the last 50 years it has been constantly rising, indicating the alarming trend of consumption. Hungary’s index, like that of every other country in Europe, is also higher than 1; in 2006 it was 1.25 (Ew- ing et al. 2009). Humanity’s living conditions and the production of world econ- omy inseparably depend on the natural renewal capability (maintenance), and the functioning of ecosystems (MEA 2005). The overuse of the living natural environment’s ecosystem services means an increasing threat to human well- being at both global and local scale. Their maintenance and the protection of their functioning capability is a vital question, and not only in terms of nature conservation.
The facilities of different regions, countries and lands are very diverse (Kocsis and Schweitzer 2011; Pásztor et al. 2010). The pattern of ecosystems and their utilisation are not uniformly distributed. From this point of view the results of program MÉTA provide new and fundamental knowledge about the country’s ecological state (Molnár et al. 2009).
The objectives of program MÉTA (Landscape Ecological Vegetation Mapping of Hungary) are:
- comprehensive assessment of the current state and patterns of natural, semi-natural vegetation of Hungary,
- understanding the land use and risk factors, which determine the state and survival of vegetation,
- scientifi c assessment of our heritage of natural, semi-natural vegetation, - developing our landscape ecological approach and knowledge.
With this new, comprehensive information, the maintenance of ecosys- tems and optimal, more conscientious land use patterns becomes possible.
We could also stand to gain protection of our natural heritage and its value. In this study, we provide views of the inventory of our vegetation, and we examine the possible use of ecological knowledge in landscapes by evaluating ecosys- tem services nation-wide. We broadly present local examples, illustrate the concept of relationships between land use, habitats, and ecosystem services and present two long-term research programmes that give a perspective on a more accurate evaluation of ecosystem services.
2. Land use and ecosystem services
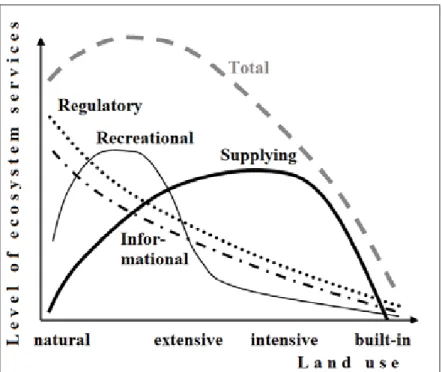
The condition and functioning of ecosystems –the quality and quan- tity of services they provide – basically depends on the ecological charac- teristics of landscape, and on the extent and nature of land use. Figure 1.
shows general trends of relations between land use and ecosystem ser- vices. Extensive use of the landscape changes the functioning of different services, what leads to higher total value for human population. Inten- sive land use (primarily market-farming) alters the general nature of the landscape to high-level supplying services, while other services of agro- ecosystems dramatically relapse (Braat and Ten Brink 2008). Building-up an area, severely reduces the level of services, since maintaining cities, towns and human infrastructure is very costly, and usually at the expense of near-natural areas and rural services. Several different compromises and aspects of optimization are possible in land use: in space and/or time;
private landowner and/or community point of view (EASAC 2009).
Figure 1: Rate and run of the main types of ecosystem services in the light of land use intensity (based on Braat and Ten Brink 2008).
3. The inventory of Hungary’s natural habitats, their conditions and landscape patterns
Program MÉTA provides data primarily about natural, near-natural or ex- tensively used lands, but since the landscape pattern and the pattern of land use are patchy and mosaic, a large area of the country is affected directly. 62% of the units covered by Program MÉTA (Bölöni et al. 2007, Molnár et al. 2007) still consists rem- nants of vegetation, while 38% of them are covered only by plantations, agricultural, industrial or urbanized lands. In their area with radius of 335 metres nothing has remained from original ecosystems (Horváth et al. 2008).
In terms of our vegetational heritage we distinguish 86 habitat types (Bölöni et al. 2007) that we classify into 18 habitat groups (Molnár et al. 2008). Since these groups can be interpreted easily as ecosystem-types, their nationally aggregated ex- tents have been chosen as a basis of the inventory. For reviewing the status of the habitats we use naturalness and the Natural Capital Index (NCIlin), which is espe- cially capable to be an universal, quantitative indicator of different regulatory eco- system services (such as carbon sequestration, soil forming, micro-climate devel- oping, or maintaining the populations of natural enemies, regulators of agricultural pests) (Czúcz et al. 2008; Czúcz et al. 2011). The landscape patterns are introduced on maps.
3.1. National inventory of habitat groups
In Hungary, based on the survey of program MÉTA, the total area of natural, near-natural and degraded vegetation is about 1 800 000 hectares, and it cov- ers 19.4% of the country (www.novenyzetiterkep.hu – national data). Within that, 1 200 000 hectares show the characteristics of the near-natural vegeta- tion, 600 000 hectares were degraded featureless by the recent changes. The present vegetational heritage of Hungary is seriously degraded in 17.3%, and 46.8% of the national territory is intermediately degraded, 32.6% is near-nat- ural, only 3.3% of it is natural (Bölöni et al. 2008). Besides the loss of a part of habitats, and the deterioration of the remainings (loss in the stock of species, degradation in the composition of species and the structure of associations) contributed to the decay of natural heritage. Concerning all these effects on one stock, we express it by the vegetation-based Natural Capital Index (NCI- lin), which is currently 9.9%. It means that, only 1/10 of the natural ecosystems
Habitat groups (Á-NÉR 2003 codes)
Extent in the country (hectare)
Natural Capital Index (%)
Euhydrophyte habitats (A1 - A5) 9 730 0.07
Marshes (B1 – B6, BA) 117 170 0.74
Flushes, transition mires and
raised bogs (C1, C23) 14 0.00
Rich fens, eu- and mesotrophic meadows & tall herb communi- ties (D1 – D6)
100 670 0.59
Colline and montane hay meadows, acid grasslands and heaths (E1 – E5)
29 330 0.16
Halophytic habitats (F1 – F5) 202 060 1.30
Dry open grasslands (G1 – G3) 11 970 0.07
Dry and semi-dry closed
grasslands (H1 – H5) 95 820 0.52
Non-ruderal, pioneer habitats
(I1 – I4) 380 0.00
Shrublands (J1a, J3, P2a-b,
M6 – M8) 70 200 0.37
Riverine and swamp woodlands
(J1b, J2, J4 – J6) 66 220 0.40
Mesic deciduous forests
(K1a, K2, K5, K7a-b) 346 740 2.17
Closed deciduous woodlands
(L1, L2a-b,x L4a-b, L5) 204 690 1.21
Rocky woodlands (LY1 – LY4) 8 600 0.06
Open steppe (oak) woodlands
(M1 – M5) 6 050 0.04
Coniferous mixed woodlands
(N13, N2) 1 320 0.01
Other, non-woody habitats
(OA, OB, OC) 265 240 1.06
Other woodlands and woody habitats
(RA, RB, RC, RD, P45, P7)
263 800 1.13
TOTAL 1 800 000 9,9
Table 1: Inventory of Hungary’s habitat-groups, based on program MÉTA’s results:
their estimated extension in the country, and their percental contribution to the national Natural Capital Index (NCIlin)
once covered the country has remained. In a functional point of view, we lost 90% of the capacity of regulating ecosystem services (while the supply service of agricultural ecosystems is high). The total extent of habitat groups in Hun- gary and the value of Natural Capital Index (NCIlin) they represent are summarized in Table 1.
The numbers of Table 1 show that the highest Natural Capital values belong to the mesic deciduous forests (2.17%), the halophytic habitats (1.3%) and the light-rich, closed deciduous woodlands (1.21%) – because of their ex- tent and their more natural status. We can fi nd (about 529 000 hectares) de- graded habitats (categories like: other, non-woody habitats; other woodlands and woody habitats) on very large areas, their average naturalness is lower, and because of this, they give an important, but still lower proportion of natural capital (1.06% and 1.13%).
3.2. Inventory and status of landscape vegetation
The landscape pattern is also an important feature of vegetation. For re- viewing this, Király et al. (2008), partially based on the results of MÉTA database, compiled Hungary’s vegetational landscape. However, MÉTA database is not only suitable for comparing a priori-defi ned landscapes, but also for separating inde- pendent landscapes, and for marking vegetation-based landscape borders. Csaba Molnár and his colleagues divided the country into 95 areas, in terms of natural vegetation, most uniform „vegetation-based landscape regions” (Molnár Cs. et al.
2008). For introducing the vegetation heritage of these landscape regions, we made a summary, (in the form of a map) of near-natural vegetation and Natural Capital Index per landscape (Figure 2, 3).
As we can see in Figure 2, especially the forested parts of our mountains, and the larger grasslands and wetlands of Hortobágy are covered with vegetation, while the larger regions of Alföld and Kisalföld (and the foothill zone of the northern mountains) lost almost completely their near-natural character. The least vegeta- tion cover (lower than 5%) can be found at Érmellék, Hegyalja, Győr – Tata ter- race region and Igmánd – Kisbér plain, Mosoni plain, Felső-Bácska, Hajdúság and Mezőföld regions, where the value of NCI is only about 1-2% (Figure 3). Coverage exceeds 50% only in landscape units of summits, North-Börzsöny, Visegrád Hills, Vértes and Gerecse, South-Vértes and the South-Bakony. Natural Capital Index exceeds 30% in each of the case in these landscape units. Otherwise, that index was higher than 40% only in case of summits (51%) and North-Börzsöny (42%).
Figure 2: Average vegetation cover of our vegetation-based landscape regions.
Figure 2: Average vegetation cover of our vegetation-based landscape regions.
Figure 3: Natural Capital Index of our vegetation-based landscape regions.
3.3. Examples for the main types of land use
Below we list some typical examples of the main categories of land use from Figure 1.
- A near-natural landscape, Bükk-plateau – The vegetation is mainly dominated by mountain beech forests. Diverse rock forests have formed on the rocky ridges. On the southern rock formations open rocky grass- lands and steppes are dominant. Planted coniferous woods are signif- icant in scope (spruce mainly). As a result of century-old traditional land use and human activity (hay making) extensive, rare species-rich mountain meadows have been preserved. The number of plant species is between 1000-1200; the number of protected plants is more than 120;
the number of invasive species is very low, and their role is not signifi- cant (Vojtkó 2008).
- An extensively used landscape, Bugac region – This is a cultivated sandy landscape, its level of modification is varying, and its farm cul- ture is declining. Its vegetation cover is small or medium, natural or semi-natural. Poplar woods, oak woodlands, and sandy grasslands can be considered as the remains of the former forest steppe woodlands.
Between the arable fields, orchards and abandoned areas, Molinia meadows, high reed beds, tussock sedge communities are lying in the low-lying parts mosaic of wet meadows with the occasional fragments of surviving willow swamps, swamp forests, salt lakes, dense and tall Puccinellia swards, salt marshes, and meadows. Many rare and unique species enrich the flora. The total number of plant species varies be- tween 600-800; number of protected plants is between 80-100. Inva- sive weeds spread mostly in secondary sandy habitats and disturbed wetlands; their number is high and their effect on these ecosystems is significant (Vidéki and Máté 2008).
- An intensive agricultural farming utilized land, Bácska Loess Plain – Due to its excellent soil, this is a mostly plowed and intensively farmed landscape. On the sandy margins, significant areas are covered by species-poor fallows and plantation forests of mostly alien species.
The remaining fragments of natural vegetation are determined by the transitions of different proportions of loess and sand. Many of the salt
lakes have been drained, their basin is filled with salt meadows. The annual salt pioneer swards have mostly remained in their natural state.
The previously dominant loess grasslands, except for one or two rem- nants, are pushed back to the basin-walls of former salt lakes and to the balks between the arable lands. Only a little stock of the forest- steppe meadows and the vegetation of loess-walls remained, continen- tal deciduous steppe-thickets are almost completely gone. The original sand vegetation has been almost completely eliminated. Only little bits of Molinia marsh meadows have remained. The vegetation of brooks and the marsh meadows supporting them are generally in a favorable natural condition. Infections of invasive species are primarily signifi- cant in sandy areas; the regenerative capacity of the landscape is weak, except for the aquatic or halophytic habitats. In addition, the number of plant species is quite high, namely between 800 and 1000, however, the number of protected species is low varying between 20 and 40. The number of invasive species is high, and their impact is sometimes sig- nificant (Csathó 2008).
- A heavily built-up landscape, Vác–Pesti Duna plain – The largest part of the landscape is dominated by agricultural areas, plantations, planted forests, sand- and gravel mines, and towns or different buildings – pri- marily in Budapest and in its agglomeration zone. Natural or near-nat- ural vegetation remains only in a small part (5-6%). A significant part of the landscape is floodplain, and although the pioneer vegetation of the reefs, and the entire river zonation (mostly willow, soft wood- and hardwood groves) are present, there are only fragments remaining of the latter. Willows and poplars are in a better state, but they are de- graded in many places, and in other places they have been replaced by cultivated poplars. At the edges of the groves we find floodplain mead- ows, marsh meadows, and rarely moorlands. In the small branch of the Danube, islands with natural state have developed. In some areas, frag- ments of opened sand grasslands and closed steppe grasslands can be found. Sometimes sandy oak woodland inclusions can be detected between black locust, pine and poplar plantings. The estimated number of the remained plant species is between 400 and 600, number of pro- tected plants varies between 40 and 60, the number of invasive species is high, and their effect is significant (Csomós 2008).
4. Habitats or ecosystems?
Both habitat and ecosystem approaches have their own justifica- tion. Although our approaches are different, usually we talk about the same things, from a different perspective. Habitats, according to Fekete et al. (1997) can only be interpreted in terms of organism or a group of organ- isms, and separate classification could be created for each organism. The National Habitat Classification System used in program MÉTA was formed according to plant associations appearing at similar or at same conditions (Á-NÉR, Fekete et al. 1997; Bölöni et al. 2003; Bölöni et al. 2007). In the ecosystem-based approach, function of these systems (flow of mass and energy, production) is under consideration, but the diversity of species that build up and operate the system is pushed into the background. It is rather difficult to capture „natural entity”, which has a temporary and undefin- able nature. Operational units are used, like in habitat mapping (Takács and Molnár 2009), or land cover mapping and classification (Büttner et al.
2001). For determining of operational units, it is very beneficial if they can be „put together” by aggregating well-defined components. For example, the ecological footprint-calculations are linked to a very broad range of land use types (agricultural cultivated fields, pastures, fishing areas, for- est management areas, built-up areas). To determine them, databases working with more detailed categories are used (Ewing et al. 2009). In case of Hungary, for example, the CORINE Land Cover database (Büttner et al.
2001) or the Kreybig Soil Information System (Szabó et al. 2007) databases are used.
Well-documented and broadly applied habitat classification sys- tem, and the MÉTA database that appropriately describes the landscape conditions, provide sound bases for the development of an operational ecosystem-classification. Another advantage of this approach is that it es- tablishes a connection between ecosystems, populations and habitats. As in case of each habitat categories we know well the flora and fauna com- munities building up them, and site requirements (Babos 1954; Borhidi 2003; Bölöni et al. 2003; Fekete and Varga 2006).
5. Case studies
If we would like to get a more accurate picture related of the function- ing of ecosystems – and of ecosystem services – estimating and measuring ba- sic operating parameters are needed. We are aware of many similar tests and their results (Jakucs 1985; Précsényi 1970, 1975; Stefanovits et al. 1981).
Here we give a report about two currently running programs, which have re- sults that can be integrated into the conception of understanding ecosystem services.
5.1. The relation between production and diversity of vegetation in a diverse area of Kiskunság
As part of Kiskun LTER (Kovács-Láng et al. 2008), there is a 3x3 km research area, mostly belonging to Kiskunság National Park’s Orgoványi Meadows. Here they run a monitoring process to follow the production and diversity, especially with regard to the relationship between weather and pro- duction (Kertész and Ónodi 2008). The main challenge of the investigations is the diversity and mosaic pattern of the area. From poplar-juniper woodlands, through abandoned farm sites to marsh and reed beds almost every kind of habitat can be found at the site, which is typical in case of Kiskunság Sand Ridge. Therefore, a combination of different sampling methods is necessary to conduct landscape-level estimations.
The monitoring began in 1999, with the preparation of an overview map of the site, which was clarifi ed in 2002. The fi eld sampling began in 2000, and the complex sampling method had formulated by 2003. As a result of the moni- toring, we can give an annual estimation of the underground and aboveground biomass of more important habitats, and of the Leaf Area Index (LAI). For the estimation, we create a calibrational database for each species with specifi c leaf area measurement, form yearly 30-35 cut turf samples. Besides, we es- timate Normalized Difference Vegetation Index (NDVI) annually on about 120 points with multispectral measurements. In woodland habitats we measure leafage cover on about 60 points with LAI2000 instrument to estimate LAI di- rectly. Based on the measurement data, we create annually an estimation for the underground and aboveground plant biomass and LAI of different land use types, and then assign them to the patches of the habitat map. In addition, in
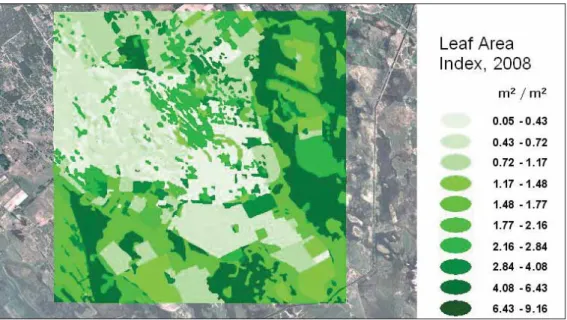
2004, a representative sampling of plants was carried out in the area in 106 4x4 m quadrats, where we recorded the species, visually estimated the cover of different plant species, and measured leaf area with LAI2000 instrument. As a result, we have a good overview of several ecosystem properties’ pattern. As an illustration, we present the 2008 pattern of one of the defi ning elements of production, the Leaf Area Index (Figure 4).
Figure 4: Leaf Area Index of KISKUN LTER’s Orgovány research area in 2008.
Primary production is one of the most notable index of ecosystem ser- vices (MEA 2005). Biodiversity, and the species composition - examined by us - have important, but at the same time controversial role at the forming of ecosystems. The diversity is defi nitely big in case of a low-production opened grassland, while on the meadows with high production it is not larger (Kertész et al. 2008); and in the forests and reed beds it is lower. This is in contrast with the general expectations of the literature, according to which the diver- sity’s maximum should be around the maximum of production (Abrams 1995).
The contradiction could be explained by the fact that meadows and wet mead- ows with potentially larger diversity have been placed into production more times before. The soil preparation has reduced the micro-heterogeneity of the area, and the repetitive regenerations have lead to species compositions less and less rich.
The plantations consist of mainly alien trees. They greatly contribute to production, but it is well-known that they impoverish and degrade the origi- nal habitat. Among these species especially the wood and honey serving black locust (Robinia pseudoacacia) and the dense (and so successfully planted) black pines (Pinus nigra) (Biró 2008) can be found, which in turn increase the fi re danger also for the surrounding natural vegetation (Kertész et al. 2011).
The abandoned sandy arable lands can be well characterized with the inva- sion of honey serving milkweed (Szitár and Török 2008). Despite its high pro- duction, this species greatly slows down, almost blocks the regeneration, and threatens the surrounding natural vegetation with further invasion.
Examples show that, biodiversity itself can not determine the possible level of ecosystem services, and at the same time that some introduced spe- cies play a prominent role. The greatest value of this varied land is diversity in terms of ecological services. The main interest of nature protection and of broader social environment is that this diversity continues to be maintained.
5.2. Calculating the biomass and modelling the carbon turnover of near-natural forests
Original or natural („old-growth”) forests free from tree cuttings and from other forest use practices contribute signifi cantly to the reduction of green- house gases in the atmosphere due to in their unbalanced carbon turnover. In addition, they hold and extract more carbon dioxide from the atmosphere than the intensively managed forests under same circumstances (Luyssaert et al.
2008). Therefore, natural or near-natural forested lands have a great impor- tance in terms of climate change. Today, habitats like these are hardly found in Hungary (a known exception at Czájlik 2009). However, there are reserves of these forests excluded from farming, that are becoming increasingly natu- ral and can serve as good references of the old forests (Horváth et al. 2001;
Bartha and Esztó 2001; Somogyi 2002). In this study, we report the case of a forest reserve’s biomass and carbon storage capacity.
We conducted our research at South-Bükk, at the 96 ha core area of Felsőtárkány’s Vár-hegy forest reserve, where high variety of oak-dominated woods occur, from downy oak woodlands (Cotino-Quercetum), through turkey oak (sessile oak and oak), hornbeam habitats to beech forests. Between 2005 and 2009 we surveyed the habitat structure at 406 permanent sampling points of the so called FOREST+n+e+t, stand dynamic and forest ecological observa
tion system (Horváth et al. 2005). In the results we describe the mix ratio and size relations of trees, the volume of living and dead woods. In addition, we revealed the history and age relations of the forest, delineated stands consid- ered as homogeneous units (Mázsa et al. 2008). For the 28 stand patches, we defi ned tree cohorts based on mixture proportions, size and age relationships.
Their development and the volume stored in the forests were calculated with CO2FIX model (Schelhaas et al. 2004; Balázs et al. 2008). On the whole re- search area the aboveground biomass was averaged as 186 ± 67 tC/hectare (N
= 28). The estimated biomass volume for the shrub-dominated low forest was 148 ± 13 tC/hectare (N = 4), the average of turkey-oak – sessile oak woodlands was 188 ± 70 tC/hectare (N = 3), the hornbeam - oak stands showed 228 ± 67 tC/hectare in volume (N = 12).
6. Future perspectives
A) By the program and database of MÉTA we got an exact documentation and a summarizing inventory of Hungary’s near-natural habitat types, their range, quality and pattern. By ecological-based grouping of habitat classes, ecosystem-types can be determined.
B) Basic plant species inventory of each habitat can be put together based on phytosociological data and evaluation of experts. By this we can make an important step towards understanding the biodiversity characteristics of ecosystem types.
C) A good method is to use well-characterized indicators for capturing the different types of ecosystem services. One indicator we suggest is the vegetation based Natural Capital Index (NCIlin), for proper description of the extent of regulatory ecosystem services. Another one is net primary production index for provisioning services. Developing further indicators of ecosystem services could open new perspectives.
D) Thematic classifi cation of ecosystem types and ecosystem services pro- vide a framework for deeper understanding of the two types – functional and structural context – approaches. A contingence table of „types” and
„services”, and within it fi rstly, its qualitative fi lling and understanding by experts should be our short-term goal (using, and reinterpreting the re- sults of already existing and earlier tests), then our long-term goal could be to quantify elements of the framework system (the contingence table’s blocks), based on further investigations.
7. Literature
Abrams, P. A. (1995): Monotonic or unimodal diversity-productivity gradients: what does competition theory predict? Ecology 76, p. 2019-2027.
Babos, I. (1954): Magyarország táji erdőművelésének táji alapjai. Mezőgazda Kiadó, Budapest, 163 p.
Balázs, B., Horváth, F., Mázsa, K., Bölöni, J. (2008): Forest reserve as a model area for future climate forest restoration – a case study. 6th European Conference on Ecological Resto- ration, Ghent, Belgium, 8-12/09/2008. CD-ROM, p. 4.
Bartha, D., Esztó, P. (2001): Az Országos Erdőrezervátum-hálózat bemutatása az Országos Erdőállomány-adattár alapján. Az erdőrezervátum-kutatás eredményei 1(1), p. 21-44.
Biró, M. (2008): A Duna-Tisza köze fásszárú vegetációjának átalakulása a 18. század óta, kül- önös tekintettel a száraz homokterületekre. In Kröel-Dulay, Gy., Kalapos, T., Mojzes, A.
(szerk.): Talaj-vegetáció-klíma kölcsönhatások. Köszöntjük a 70 éves Láng Editet. MTA Ökológiai és Botanikai Kutatóintézete, Vácrátót, p. 23-38.
Borhidi, A. (2003): Magyarország növénytársulásai. Akadémiai Kiadó, Budapest, 610 p.
Bölöni, J., Kun, A., Molnár, Zs. (2003): Magyarország Élőhely-térképezési Adatbázisának (MÉTA) Élőhelyismereti Útmutatója (ÉIÚ) 2.0. Kézirat, MTA Ökológiai és Botanikai Ku- tatóintézete, Vácrátót, 161 p.
Bölöni, J., Molnár, Zs., Horváth, F., Illyés, E. (2008): Naturalness-based habitat quality of the Hungarian (semi-)natural habitats. Acta Botanica Hungarica 50(Suppl.), p. 149-159.
Bölöni, J., Molnár, Zs., Illyés, E., Kun, A. (2007): A new habitat classifi cation and manual for standardized habitat mapping. Annali di Botanica nouva series 7, p. 105-126.
Braat, L., Ten Brink, P. (eds. 2008): The cost of policy inaction: the case of not meeting the 2010 biodiversity target. Alterra-report 1718, Wageningen.
Büttner, Gy., Biró, M., Maucha, G., Petrik, O. (2001): Land Cover mapping at scale 1:50.000 in Hungary: Lessons learnt from the European CORINE programme. In Buchroithner (ed.): A Decade of Trans-European Remote Sensing Cooperation, Balkema, Rotterdam, p. 25-30.
Czájlik, P. (2009): Kékes-Észak erdőrezervátum és térségének története: egy őserdő¬fragmentum fennmaradása. Az erdőrezervátum-kutatás eredményei 3, p. 7-94.
Czúcz, B., Molnár, Zs., Horváth, F., Botta-Dukát, Z. (2011): Indikátor a természeti környezet ökológiai állapotának átfogó jellemzésére: A természeti tőke index. Magyar Tudomány 6, p. 652-657.
Czúcz, B., Molnár, Zs., Horváth, F., Botta-Dukát, Z. (2008): The natural capital index of Hun- gary. Acta Botanica Hungarica 50(Suppl.), p. 161-177.
Csathó, A. I. (2008): 1.3.12. Bácskai löszös síkság. In Király, G., Molnár, Zs., Bölöni, J., Csiky, J., Vojtkó, A. (szerk.): Magyarország földrajzi kistájainak növényzete. MTA Ökológiai és Botanikai Kutatóintézete, Vácrátót.