Review
Understanding Forest Health with Remote Sensing, Part III: Requirements for a Scalable Multi-Source Forest Health Monitoring Network Based on Data Science Approaches
Angela Lausch1,2,*ID, Erik Borg3, Jan Bumberger4, Peter Dietrich4,5, Marco Heurich6,7, Andreas Huth8, András Jung9,10, Reinhard Klenke11 ID, Sonja Knapp12 ID,
Hannes Mollenhauer4, Hendrik Paasche4, Heiko Paulheim13 ID, Marion Pause14,
Christian Schweitzer15, Christiane Schmulius16, Josef Settele11,17ID, Andrew K. Skidmore18,19, Martin Wegmann20, Steffen Zacharias4, Toralf Kirsten21and Michael E. Schaepman22 ID
1 Department Computational Landscape Ecology, Helmholtz Centre for Environmental Research—UFZ, Permoserstr. 15, D-04318 Leipzig, Germany
2 Lab for Landscape Ecology, Department of Geography, Humboldt University of Berlin, Rudower Chaussee 16, 12489 Berlin, Germany
3 German Aerospace Center—DLR, German Remote Sensing Data Center—DFD, Kalkhorstweg 53, D-17235 Neustrelitz, Germany; erik.borg@dlr.de
4 Department of Monitoring and Exploration Technologies, Helmholtz Centre for Environmental Research—UFZ, Permoserstr. 15, D-04318 Leipzig, Germany; jan.bumberger@ufz.de (J.B.);
peter.dietrich@ufz.de (P.D.); hannes.mollenhauer@ufz.de (H.M.); hendrik.paasche@ufz.de (H.P.);
steffen.zacharias@ufz.de (S.Z.)
5 Dpartment of Geoscience, Centre of Applied Geosciences, Eberhard Karls University, Hölderlinstr. 12, D-72074 Tübingen, Germany
6 Department of Conservation and Research, Bavarian Forest National Park, Freyunger Straße 2, D-94481 Grafenau, Germany; marco.heurich@npv-bw.bayern.de
7 Faculty of Environment and Natural Resources, University of Freiburg, Tennenbacher Straße 4, D-79106 Freiburg, Germany
8 Department of Ecological Modelling, Helmholtz Centre for Environmental Research—UFZ, Permoserstr. 15, D-04318 Leipzig, Germany; andreas.huth@ufz.de
9 Technical Department, Szent István University, Villányiút 29–43, Budapest 1118, Hungary;
jung.andrás@kertk.szie.hu
10 MTA-SZIE Plant Ecological Research Group, Szent István University, Páter Károly u.1., Gödöll˝o 2100, Hungary
11 Department of Conservation Biology, Helmholtz Centre for Environmental Research—UFZ, Permoserstr. 15, D-04318 Leipzig, Germany; reinhard.klenke@ufz.de (R.K.); josef.settele@ufz.de (J.S.)
12 Department of Community Ecology, Helmholtz Centre for Environmental Research—UFZ, Theodor-Lieser-Str. 4, D-06120 Halle, Germany; sonja.knapp@ufz.de
13 Data and Web Science Group, University of Mannheim, B6 26, D-68159 Mannheim, Germany;
heiko@informatik.uni-mannheim.de
14 Institut of Photogrammetry and Remote Sensing, Technical University Dresden, Helmholtzstr. 10, D-01061 Dresden, Germany; marion.pause@tu-dresden.de
15 German Environment Agency, Wörlitzer Platz 1, D-06844 Dessau-Rosslau, Germany;
christian.schweitzer@uba.de
16 Department of Remote Sensing, University of Jena, Grietgasse 228B, Grietgasse 6, D-07743 Jena, Germany;
c.schmullius@uni-jena.de
17 iDiv, German Centre for Integrative Biodiversity Research, Halle-Jena-Leipzig, Deutscher Platz 5e, D-04103 Leipzig, Germany
18 Faculty of Geo-Information Science and Earth Observation (ITC), University of Twente, P.O. Box 217, AE 7500 Enschede, The Netherlands; a.k.skidmore@utwente.nl
19 Department of Environmental Science, Macquarie University, NSW 2109, Sydney 2109, Australia
Remote Sens.2018,10, 1120; doi:10.3390/rs10071120 www.mdpi.com/journal/remotesensing
20 Department of Remote Sensing, Institute of Geography and Geology, University of Würzburg, Oswald-Külpe Weg 86, 97074 Würzburg, Germany; martin.wegmann@uni-wuerzburg.de
21 Faculty of Applied Computer and Bio Sciences, University of Applied Sciences Mittweida, Technikumplatz 17, 09648 Mittweida, Germany; toralf.kirsten@hs-mittweida.de
22 Remote Sensing Laboratories, Department of Geography, University of Zurich Irchel, Winterthurerstrasse 190, CH-8057 Zurich, Switzerland; michael.schaepman@geo.uzh.ch
* Correspondence: angela.lausch@ufz.de; Tel.: +49-341-235-1961; Fax: +49-341-235-1939
Received: 13 April 2018; Accepted: 6 July 2018; Published: 15 July 2018
Abstract:Forest ecosystems fulfill a whole host of ecosystem functions that are essential for life on our planet. However, an unprecedented level of anthropogenic influences is reducing the resilience and stability of our forest ecosystems as well as their ecosystem functions. The relationships between drivers, stress, and ecosystem functions in forest ecosystems are complex, multi-faceted, and often non-linear, and yet forest managers, decision makers, and politicians need to be able to make rapid decisions that are data-driven and based on short and long-term monitoring information, complex modeling, and analysis approaches. A huge number of long-standing and standardized forest health inventory approaches already exist, and are increasingly integrating remote-sensing based monitoring approaches. Unfortunately, these approaches in monitoring, data storage, analysis, prognosis, and assessment still do not satisfy the future requirements of information and digital knowledge processing of the 21st century. Therefore, this paper discusses and presents in detail five sets of requirements, including their relevance, necessity, and the possible solutions that would be necessary for establishing a feasible multi-source forest health monitoring network for the 21st century. Namely, these requirements are: (1) understanding the effects of multiple stressors on forest health; (2) using remote sensing (RS) approaches to monitor forest health; (3) coupling different monitoring approaches; (4) using data science as a bridge between complex and multidimensional big forest health (FH) data; and (5) a future multi-source forest health monitoring network. It became apparent that no existing monitoring approach, technique, model, or platform is sufficient on its own to monitor, model, forecast, or assess forest health and its resilience. In order to advance the development of a multi-source forest health monitoring network, we argue that in order to gain a better understanding of forest health in our complex world, it would be conducive to implement the concepts of data science with the components: (i) digitalization; (ii) standardization with metadata management after the FAIR (Findability, Accessibility, Interoperability, and Reusability) principles;
(iii) Semantic Web; (iv) proof, trust, and uncertainties; (v) tools for data science analysis; and (vi) easy tools for scientists, data managers, and stakeholders for decision-making support.
Keywords: forest health; in situ forest monitoring; remote sensing; data science; digitalization;
big data; semantic web; linked open data; FAIR; multi-source forest health monitoring network
1. Introduction
Anthropogenic and natural stressors and disturbances affect all levels of biotic organization in forest ecosystems, potentially affecting their resilience. Relationships among drivers, stressors, disturbances, and effects are complex, often non-linear, and multidimensional on temporal and spatial scales. Adaptation processes on forest species that are both species-specific and regional specifics make causal stress responses and their effects on resilience in ecosystems even more difficult to understand [1].
In order to gain a better understanding of the effects of different stressors and disturbances and support forest managers, decision makers, and politicians in their decisions on forest management, a holistic approach is imperative. This includes data recording, monitoring, analysis, and the assessment of forest health on all levels of forest health monitoring [2] and also a monitoring of biodiversity and
forest ecosystem change through effective global coordination [3] good observations, indicators and scenarios of biodiversity and ecosystem services change [4].
There is still a large discrepancy between the information required by forest managers and scientists and the information that is available for understanding and assessing the complexity and multidimensionality of forest health drivers, stressors, disturbances, and effects. Decision makers require information on forest health in high spatial and temporal accuracy, from the local to the global, for short and long-term periods that can be recorded on a low-cost basis. Such information should be comparable among regions and based on harmonized methods. For this reason, forest inventory programs have largely been harmonized [5–7]. On the one hand, indicators of forest health used in forest inventory programs are accurate, but on the other hand, their acquisition is time and cost-intensive, so that in most cases plot-based monitoring has to be carried out at long intervals (>1 year).
Today, an increasing amount of forest health data is available from national forest inventories and monitoring programs [8,9], experimental studies of forest ecosystems [10], as well as from remote sensing (RS) data and RS data products [11–14]. In addition, RS technologies can be used to derive a large range of forest health indicators [6,15–17]. Studies increasingly refer to the importance of combining national forest inventory field plots and RS data for assessing forest health [18,19], but only a limited number of countries [20] and operational programs support plot-based national forest inventories monitoring by using close-range and air and spaceborne RS data.
A study on the significance of RS in national forest inventories [20] showed that approximately 71% (32 out of 45 countries) consider their national forest inventory (NFI) to depend on or partly depend on earth observation data. Approximately 31% of those asked (14 countries) found the use of aerial images for NFI to be indispensable. Only around 13% of those surveyed considered RS data to be essential for NFI, whereas 9% of those surveyed found that a combination of aerial images and satellite images was necessary. Another 56% believed that RS data cannot be used for NFI. No country has outlined the use of radar or light detecting and ranging (LiDAR) RS data from air and spaceborne RS sensors or unmanned aerial vehicles (UAV) [20]. In a further study focusing on European countries that was conducted in 2015, 24 out of 34 countries claimed to have made “no changes” in continuing the use of existing information instruments such as RS technologies, whereas eight countries quoted
“changes” to their national forest inventories related to the use of new RS technologies [21].
The reasons for a low integration of RS technologies in forest health monitoring are listed in the following. (i) Previously developed RS technologies either do not record certain forest inventory indicators or only record them with insufficient quality. (ii) Complex and large RS data often pose high technical and personal requirements for data management, storage, processing, analysis, and the derivation of forest health indicators. (iii) The processing and analysis of RS data requires highly skilled RS training, extensive expertise, and the access to RS software and RS data with high spatial and spectral resolution. (iv) The methodological approaches, variables, and recording parameters of forest inventory [6] differ from those of close-range, air and spaceborne RS approaches [1].
The plot-based forest inventory is primarily assessed by field visits. For the accuracy of national forest inventories, long-term experience with indicators and easily enforceable standardization targets are required. Difficulties in the recording and assessment of forest inventory indicators not only involve specialist competences, but also physiological, species-specific, bioregional or climate-related knowledge. Reasons underlying the shift in forest health indicators [22,23] might thus easily be misinterpreted by the person processing the forest inventory data.
Plot-based forest inventory indicators are thus a combination of indicators that can primarily be recorded by humans (human-driven), and partly also by the implementation of instruments (machine-driven). (v) Conversely, close-range, air and space-borne RS techniques record machine- driven indicators of forest health such as spectral traits (ST) and spectral trait variations (STV) in a spatially and temporally explicit way [1,24,25]. The accuracy in deriving forest health indicators using RS depends “on the spatial, spectral, radiometric, angular, and temporal resolution of the
RS techniques, the distribution of ST/STV in space and their temporal changes, the choice of the modeling method (classification, biophysical/chemical parameter estimation), the geographic data representation (pixel-based or geographic object-based), and the appropriateness of the RS algorithm and its assumptions for the given spectral traits” [25]. The application of data science methods combined with machine-driven forest health indicators (forest inventory, in situ and RS indicators) is objective, quantitative, repetitive, and comparable, and thus the basis for a better understanding of complex processes and drivers of forest health on different scales.
Even though appropriate data and methods are available, no uniform, comparable, multidimensional, and multi-source forest health monitoring network (MUSO-FH-MN) exists, which corresponds to the future requirements of data science in the 21st century. We think that such a network is necessary to enable timely data and process-based decisions in order to guarantee better understanding, modeling, prediction, and assessing of healthy and resilient forest ecosystems.
The goal of this paper is to discuss:
(1) What is required to bridge the gaps in information, data, models, and tools needed by forest managers and scientists for a better understanding of the complexity and multidimensionality of forest health drivers, stressors, disturbances, effects, and related processes?
(2) Why are these requirements essential for a better understanding of forest health?
(3) Which requirements are imperative to establish a multidimensional, multi-source forest health monitoring network in the future?
2. Forest Health
2.1. Understanding Forest Health
Forest ecosystems are exposed to multiple stressors that can destabilize functions, structures, and processes as well as impair the provision of ecosystem services [26]. These multiple stressors mostly interact and co-occur in different ways and on various temporal and organismic scales, which are not yet fully understood.
Therefore, stressors, disturbances, or resource limitation factors can take effect at each development stage or only at specific development stages or time windows of the development, i.e., during the germination, the budding, the flowering, or seed formation of plants, causing functions to become impaired or even destabilized. Moreover, the effects of multiple stressors on different scales of biological organization will vary [27]. The effectiveness of stressors is influenced by process characteristics (chemical, mechanical, and organismic driver), just as much as it depends on the dose and the dose combination of multiple stressors, as well as the characteristics of the effective processes such as range, duration, scope, intensity, continuity, dominance, or overlap of the processes [28].
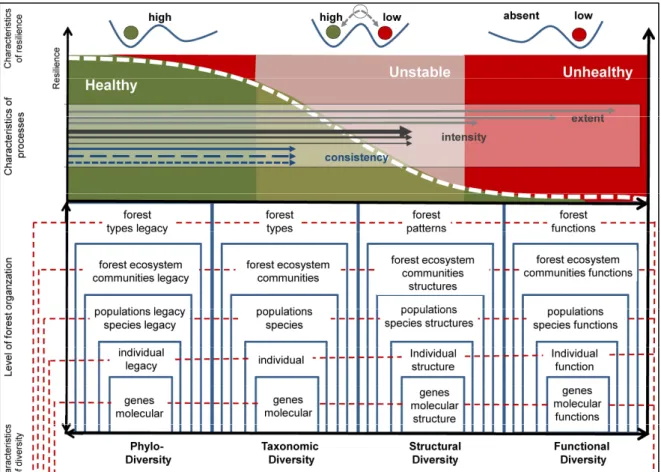
Furthermore, over longer time frames, multiple stressors can lead to the development of adaptation strategies such the development of CSR plant strategy types (competition—C, stress tolerance—S and ruderal -R) [29,30]. However, stressors will only lead to a change in resilience when there are irreversible changes, making it impossible for the system to return to its initial state (see Figure1). Accordingly, forest biodiversity is a crucial component of the concepts of ecosystem health and integrity [31–33]. These concepts are linked to the self-organizing capacity of ecosystems in the presence of multiple stressors, disturbances, or resource limitations. Healthy forest ecosystems can be defined as vigorous, diverse systems that are characterized by a high resilience on different levels of biotic organization from the gene, molecular, individual, and community level to that of forest ecosystems, with the ability to quickly return to an initial state following external stressors, disturbances, or resource limitations, and withstand negative impacts from external influences [34].
Figure 1. Schematic diagram of the different levels of forest organization from genes up to forest types showing characteristics of phylodiversity, taxonomic diversity, structural diversity, functional and trait diversity. It also shows how the different characteristics of the processes (the extent, process intensity, process consistency, resilience, and their characteristics) all influence the resilience of forest health (modified after Trumbore et al. [2]) and Lausch et al. [24].
2.2. Indicator Requirements for Monitoring Forest Health
The effects of multivariate stressors on forest ecosystem health are mostly non-linear, complex, and multidimensional. They depend on (i) the spatial or organismic characteristics and scale; (ii) the temporal characteristics and scale; and (iii) the process characteristics and scale. Indicators of forest health need to fulfill these requirements i.e., they must be able to map various organismic, temporal, and process characteristics on different scales. Only then can forest health and its resilience be analyzed, comparable, and predictable. In the course of a greater integration of freely available RS data [12], the indicators must also be suitable for the combination of different in situ and RS approaches. In summary, (sets of) forest health indicators must correspond to the following content- related and methodological criteria:
They must reflect status, stress, disturbances, and resource limitations.
They must be able to map different (i) organismic; (ii) temporal; and (iii) process characteristics, all across different scales.
They should be recordable by different in situ monitoring approaches (forest inventory monitoring, biological and morphological species concepts, concept of ecological integrity, monitoring of animal distribution, anthropogenic drivers, or abiotic indicators (soil, water, climate, air), as well as close-range and air and spaceborne RS approaches on different platforms).
It should be possible to standardize, objectively repeat, and thus compare indicators.
Figure 1.Schematic diagram of the different levels of forest organization from genes up to forest types showing characteristics of phylodiversity, taxonomic diversity, structural diversity, functional and trait diversity. It also shows how the different characteristics of the processes (the extent, process intensity, process consistency, resilience, and their characteristics) all influence the resilience of forest health (modified after Trumbore et al. [2]) and Lausch et al. [24].
2.2. Indicator Requirements for Monitoring Forest Health
The effects of multivariate stressors on forest ecosystem health are mostly non-linear, complex, and multidimensional. They depend on (i) the spatial or organismic characteristics and scale; (ii) the temporal characteristics and scale; and (iii) the process characteristics and scale. Indicators of forest health need to fulfill these requirements i.e., they must be able to map various organismic, temporal, and process characteristics on different scales. Only then can forest health and its resilience be analyzed, comparable, and predictable. In the course of a greater integration of freely available RS data [12], the indicators must also be suitable for the combination of different in situ and RS approaches.
In summary, (sets of) forest health indicators must correspond to the following content-related and methodological criteria:
• They must reflect status, stress, disturbances, and resource limitations.
• They must be able to map different (i) organismic; (ii) temporal; and (iii) process characteristics, all across different scales.
• They should be recordable by different in situ monitoring approaches (forest inventory monitoring, biological and morphological species concepts, concept of ecological integrity, monitoring of animal distribution, anthropogenic drivers, or abiotic indicators (soil, water, climate, air), as well as close-range and air and spaceborne RS approaches on different platforms).
• It should be possible to standardize, objectively repeat, and thus compare indicators.
• Due to the heterogeneity and the complexity of different indicators in big data, all indicators should be transferable into digital form through a human–computer communicationinterpretation language to meet the requirements of data science.
2.3. Existing Standardized Approaches for Monitoring Forest Health
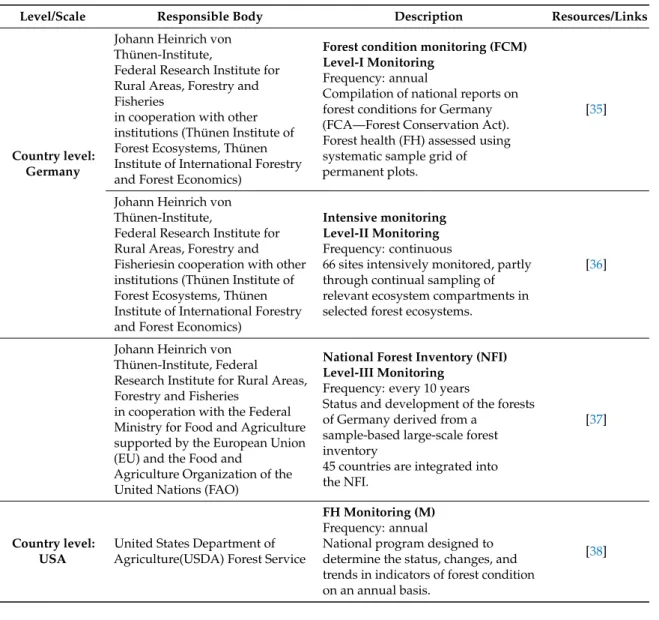
Forest health monitoring has a long tradition with numerous monitoring programs on the local, regional, national, and international level, in which standardized indicators of FH have been used and developed. In Germany, three levels of forest health monitoring exist (Table1) that have become representative for Europe, as well as for the initiatives to unite forest monitoring such as the Forest Information System for Europe (FISE,http://data.jrc.ec.europa.eu/collection/FISE;http://fise.jrc.ec.
europa.eu/). Here, we describe these three levels of in situ monitoring in Germany.
Table 1.Long-term monitoring programs of forest health at the country, European and the global level (modified after Lausch et al. [1]).
Level/Scale Responsible Body Description Resources/Links
Country level:
Germany
Johann Heinrich von Thünen-Institute,
Federal Research Institute for Rural Areas, Forestry and Fisheries
in cooperation with other institutions (Thünen Institute of Forest Ecosystems, Thünen Institute of International Forestry and Forest Economics)
Forest condition monitoring (FCM) Level-I Monitoring
Frequency: annual
Compilation of national reports on forest conditions for Germany (FCA—Forest Conservation Act).
Forest health (FH) assessed using systematic sample grid of permanent plots.
[35]
Johann Heinrich von Thünen-Institute,
Federal Research Institute for Rural Areas, Forestry and Fisheriesin cooperation with other institutions (Thünen Institute of Forest Ecosystems, Thünen Institute of International Forestry and Forest Economics)
Intensive monitoring Level-II Monitoring Frequency: continuous
66 sites intensively monitored, partly through continual sampling of relevant ecosystem compartments in selected forest ecosystems.
[36]
Johann Heinrich von Thünen-Institute, Federal Research Institute for Rural Areas, Forestry and Fisheries
in cooperation with the Federal Ministry for Food and Agriculture supported by the European Union (EU) and the Food and
Agriculture Organization of the United Nations (FAO)
National Forest Inventory (NFI) Level-III Monitoring
Frequency: every 10 years
Status and development of the forests of Germany derived from a
sample-based large-scale forest inventory
45 countries are integrated into the NFI.
[37]
Country level:
USA
United States Department of Agriculture(USDA) Forest Service
FH Monitoring (M) Frequency: annual
National program designed to determine the status, changes, and trends in indicators of forest condition on an annual basis.
[38]
Table 1.Cont.
Level/Scale Responsible Body Description Resources/Links
Country level:
China
State Forestry
Administration of China
National Forest Inventory including the protocol for Monitoring Forest Health
Frequency: five years Since 2004, components that monitored the health status and ecological functions of forest ecosystems were added to the NFI.
[6,39]
Country level:
Canada
Canadian Forest Service (CFS)
National FHM Network Frequency: 5-years
Established in 1994 based on earlier Acid Rain Monitoring Network.
Plot-based biannual to five-year repetition depending on the variables.
[40]
National Forest Inventory (NFI), Canada
National Forest Inventory Frequency: 10 years
Mixed plot and remote sensing (RS)-based. Includes inventory parameters and assessment of insect, disease, fire, and other disturbance damage.
[41]
European level
United Nations Economic Commission for Europe (UNECE)
ICP Forest:the International Co-operative Programme on Assessment and Monitoring of Air Pollution Effects on Forests Frequency: annual
Level 1: Long-term monitoring, 6000 sampling sites in Europe with 16 km2 Level 2: Long-term intensive sites, for process-orientated study
Effects on Forest. Developed to standardize the recording of different FH indicators on three levels of intensity.
ICP Forest Manuals:
Development of standardized measurement protocols
http://icp-forests.net/page/icp- forests-manual
[42]
European Union (EU) FOREST EUROPE-Program European Union (EU) Global level
(45 countries)
Food and Agriculture Organization of the United Nations (FAO)
National Forest Inventory (NFI) Frequency: every 10 years; 45 countries are integrated into the NFI
[41]
Global level
Food and Agriculture Organization of the United Nations (FAO)
Forest Resources Assessment Frequency: five yearsFH recorded by the FAO as part of the Forest Resources Assessment (FRA).
Individual countries report their findings to the FAO, which then compiles a report.
FAO FRA Terms and Definitions:
Development of standardized measurement protocols
(http://www.fao.org/docrep/017/
ap862e/ap862e00.pdf)
[43]
Table 1.Cont.
Level/Scale Responsible Body Description Resources/Links
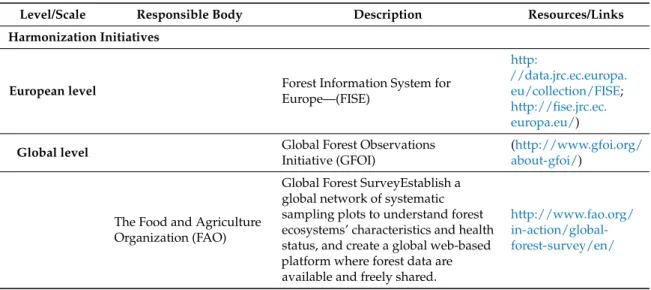
Harmonization Initiatives
European level Forest Information System for
Europe—(FISE)
http:
//data.jrc.ec.europa.
eu/collection/FISE;
http://fise.jrc.ec.
europa.eu/)
Global level Global Forest Observations
Initiative (GFOI)
(http://www.gfoi.org/
about-gfoi/)
The Food and Agriculture Organization (FAO)
Global Forest SurveyEstablish a global network of systematic sampling plots to understand forest ecosystems’ characteristics and health status, and create a global web-based platform where forest data are available and freely shared.
http://www.fao.org/
in-action/global- forest-survey/en/
One is the forest condition monitoring (FCM) (Level-I Monitoring). In this case, the annual condition of the forest is recorded using a systematic sample grid of permanent plots measuring 16 km×16 km. This is done by visually assessing the canopy condition as an indicator for tree vitality on around 10,000 trees of the most important tree species. Crucial indicators that are considered for FH are e.g., the thinning of tree crowns, fruiting intensity, the yellowing of leaves or needles, infestations by insect or fungi, as well as damage to trunks or tree crowns. Manuals on Level-I Monitoring provide a comprehensive insight into all of the recorded FH indicators.
Another level of in situ monitoring in Germany is referred to as intensive monitoring (Level-II Monitoring). Due to an increasing deterioration of the vitality of numerous tree species, monitoring includes indicators such as foliage condition, information about the soil’s solid phase, foliage content, data on deposition, soil solution, weather conditions, air quality, ground cover, phenology, leaf shedding, as well as visible ozone damage. Such intensive monitoring for the first time enables a better understanding of cause–effect relationships.
Finally, the third level of monitoring forest health is the national forest inventory (Level-III Monitoring). This national forest inventory, which is conducted every 10 years, was initiated by the government as a long-term sample-based national forest monitoring project, and has so far been conducted in 1986, 2002, and 2012. One of the main objectives of the national forest inventory is to obtain information about forest structure, composition, and quantities of round timber. Data collection is conducted on a 4 km×4 km raster basis. The 4 km×4 km raster is used in several German federal states, whereas other states have opted to reinforce the network of random samples. For every corner, the block or cluster method is applied, including data collection of the corners of a 150 m×150 m quadrant [44]. Other major objectives of the German NFI include monitoring the sustainability and balance of forest ecosystems, the growth and yield of forests, forest biodiversity and regeneration, or essential components for understanding FH and its resilience.
There are comparable in situ monitoring programs in a range of countries that point the way to the application of standardized FH monitoring strategies (Table1).
Some of the central tasks of the United Nations Economic Commission for Europe (UNECE) are to deal with issues concerning environmental protection, such as for example the Geneva Convention on Long-Range Transboundary Air Pollution (https://www.unece.org/env/lrtap/welcome.html). It was under this convention that the Working Group on Effects (WEG) emerged, which is also responsible for coordinating the international monitoring programs. Two of these programs are the International Co-operative Program (ICP) Forest (EU-Level II) and the ICP Integrated Monitoring (ICP IM). Among the largest monitoring programs on the European level are the FOREST EUROPE program of the
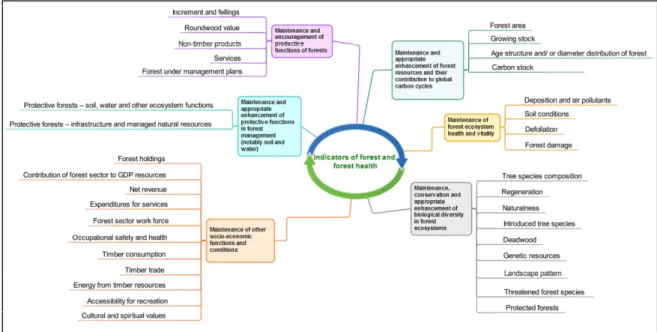
European Union, as well as the International Co-operative Program on the Assessment and Monitoring of Air Pollution (ICP Forests) that was established in 1990 [21]. The FOREST EUROPE program defines seven criteria to describe the condition of European forests, whereby three criteria monitor the preservation of the forest ecosystem’s health and vitality [21] (see FigureRemote Sens. 2018, 10, x FOR PEER REVIEW 2). 9 of 51
Figure 2. Quantitative indicators used by the seventh FOREST EUROPE Ministerial Conference in October 2015. Source after the United Nations Report “State of Europe’s Forests 2015”. FOREST EUROPE, 2015: State of Europe’s Forests 2015.
The European forest monitoring for the protection of forests with annual reports to the ICP Forests was founded through the European Union (EU) Agreement on Long-Range Transboundary Air Pollution as a European monitoring program, and has formed the basis for coordinating sustainable European forestry practices over the last 30 years. The ICP forest monitoring is subdivided into two levels. Level-I serves as an annual long-term monitoring of approximately 6000 sampling measuring 16 km² distributed across Europe. The FH assessment is conducted via visual assessments of the canopy condition, density, and leaf color for specific tree species. Within the Level- II Monitoring, process-oriented studies at selected experimental sites are conducted that are equipped with different in situ sampling probes. In addition, an extensive mapping of air pollution is carried out, and additional FH indicators are recorded such as the development and decomposition of soil nutrients, water availability, and soil and vegetation cover [45].
All national and international in situ programs such as FOREST EUROPE or ICP Forests use sample-based as well as qualitative assessments of indicators that can either be ascertained directly (e.g., species compositions, quantities of dead wood) or assessed by experts (e.g., classes for thinning of crowns, yellowing of leaves/needles). A summary of key forest and tree stand parameters observed in different forest inventories can be found in Pause et al. [46]. The quality, consistency, and thus comparability of partially qualitative assessments often largely depend on the knowledge of the monitoring team. For numerous crucial FH indicators such as tree crown density, thinning, naturalness, or regeneration potential, there are no standardized in situ variables to be measured or direct measurement procedures. These kinds of assessments introduce a high level of uncertainty to the data collection, and subsequently to the analysis, assessment, and prognosis of FH. To account for these uncertainties in the in situ monitoring of FH, extensive specifications were compiled to deal with the in situ uncertainties of FH.
2.4. Initiatives to Unite Indicators, Data, and Approaches
Whilst in situ FH monitoring is applied on the plot level, it is easy to figure out how useful RS techniques can be in recording wall-to-wall information on multiple, temporal, and spatial scales [47].
There are numerous methodological approaches that use RS technologies for the long-term monitoring of FH [48–51]. With an increasing number and availability of qualitative sophisticated RS data [11,47,52–54], free access to the RS data portals in 2008 (starting with the Landsat Mission), and
Figure 2. Quantitative indicators used by the seventh FOREST EUROPE Ministerial Conference in October 2015. Source after the United Nations Report “State of Europe’s Forests 2015”.
FOREST EUROPE, 2015: State of Europe’s Forests 2015.
The European forest monitoring for the protection of forests with annual reports to the ICP Forests was founded through the European Union (EU) Agreement on Long-Range Transboundary Air Pollution as a European monitoring program, and has formed the basis for coordinating sustainable European forestry practices over the last 30 years. The ICP forest monitoring is subdivided into two levels. Level-I serves as an annual long-term monitoring of approximately 6000 sampling measuring 16 km2distributed across Europe. The FH assessment is conducted via visual assessments of the canopy condition, density, and leaf color for specific tree species. Within the Level-II Monitoring, process-oriented studies at selected experimental sites are conducted that are equipped with different in situ sampling probes. In addition, an extensive mapping of air pollution is carried out, and additional FH indicators are recorded such as the development and decomposition of soil nutrients, water availability, and soil and vegetation cover [45].
All national and international in situ programs such as FOREST EUROPE or ICP Forests use sample-based as well as qualitative assessments of indicators that can either be ascertained directly (e.g., species compositions, quantities of dead wood) or assessed by experts (e.g., classes for thinning of crowns, yellowing of leaves/needles). A summary of key forest and tree stand parameters observed in different forest inventories can be found in Pause et al. [46]. The quality, consistency, and thus comparability of partially qualitative assessments often largely depend on the knowledge of the monitoring team. For numerous crucial FH indicators such as tree crown density, thinning, naturalness, or regeneration potential, there are no standardized in situ variables to be measured or direct measurement procedures. These kinds of assessments introduce a high level of uncertainty to the data collection, and subsequently to the analysis, assessment, and prognosis of FH. To account for these uncertainties in the in situ monitoring of FH, extensive specifications were compiled to deal with the in situ uncertainties of FH.
2.4. Initiatives to Unite Indicators, Data, and Approaches
Whilst in situ FH monitoring is applied on the plot level, it is easy to figure out how useful RS techniques can be in recording wall-to-wall information on multiple, temporal, and spatial scales [47]. There are numerous methodological approaches that use RS technologies for the long-term monitoring of FH [48–51]. With an increasing number and availability of qualitative sophisticated RS data [11,47,52–54], free access to the RS data portals in 2008 (starting with the Landsat Mission), and open access research, applications, stakeholders, and political decision makers have introduced a new era of monitoring for FH [12,55].
However, if we are to monitor and understand FH in all of its multi-functionality and complexity as well as assess the effects of multiple stressors, it would make sense to have a monitoring system that combines in situ terrestrial observations and RS approaches, as well as other approaches [2,56–58].
However, the linking and establishment of an MUSO-FH-MN requires initiatives that promote the standardization, harmonization, and digitalization of different approaches or techniques on a single platform. This is a goal that is pursued by the Global Forest Observations Initiative (GFOI) (http://www.gfoi.org) and the Forest Information System for Europe (FISE).
The Global Forest Observations Initiative (GFOI) (http://www.gfoi.org/about-gfoi/) supports governments in setting up national systems by providing a platform for coordinating observations, support and guidance on utilizing observations. It also works with national governments that report into international forest assessments (i.e., the global Forest Resources Assessment (FRA) of the FAO) and the national greenhouse gas inventories reported to the United Nations Framework Convention on Climate Change (UNFCCC). Since 2011, the GFOI has been supported with numerous RS data from the Committee on Earth Observation Satellites (CEOS). The availability of this RS data has provided numerous countries with complete RS-based forest cover data, which they require for an annual monitoring of their forests and thus the monitoring of global climate goals. Due to the open data policy and the cooperation with various national space agencies and coordination units, RS data from the Landsat series (USGS—United States Geological Survey) and data from Sentinel-1 (radar) and Sentinel-2 from the Copernicus program have been integrated into GFOI. Other RS data are supplied by space agencies in France (CNES—National Centre for Space Studies), Italy (ASI—Italian Space Agency), Canada (CSA—Canadian Space Agency), Germany (DLR—German Aerospace Center), Japan (JAXA—Japan Aerospace Exploration Agency), Brazil (INPE—Instituto Nacional de Pesquisas Espaciais) and China (CRESDA—Centre for Resources Satellite Data and Application). In the coming years, RS data will follow from Great Britain (NovaSAR—Synthetic Aperture Radar -Mission) and Argentina (SAOCOM—Satellites for Observation and Communications-Mission). By 2025, such cooperation will guarantee a global FH monitoring supported by RS data. With the Forest Information System for Europe (FISE), which is hosted by the EU-JRC—Joint Research Centre, (http://forest.jrc.
ec.europa.eu), a harmonized forest data management and information system was established by the EU in 2015 to save, monitor, assess, and predict goals set by the EU and its member states in forest strategies, such as the preservation of forest multi-functionality or forest biodiversity. With this harmonization, FISE pursues the following objectives:
• Set up a collection of harmonized Europe-wide information on the multi-functional role of forests and forest resources.
• Provision of harmonized forest datasets that were developed from EU funding, including Horizon2020, LIFE +, Copernicus, etc.
• Integration of diverse information systems (e.g., European Forest Fire Information System—EFFIS) and data platforms (e.g., European Forest Data Center, EFDAC) into a dynamic modular system that combines data (in situ forest data, forest data based on Copernicus RS information) and models into applications.
• Linking existing forest-related policy fields of the EU to relevant networks and initiatives in the context of forest information.
• Foster the availability of geo-data that are standardized throughout Europe, irrespective of national borders and with a high degree of spatial accuracy, in line with the INSPIRE directive (infrastructure for spatial information in Europe).
• Provision of a digital information on the distributions of the most important forest tree species and changes in forest dynamics.
o Assessment of the suitability of tree species and forest types for current and future climate conditions, biophysical mapping, and assessment of ecosystem services in the forest;
o Measurement of changes to the provision of these services as a consequence of anthropogenic and natural disturbances; economic assessment and ecological and economic audits.
• Several modules have been developed within FISE: (i) forests and natural disturbances such as fires and pests; (ii) forest and the bioeconomy; (iii) forests and climate change; and (iv) forest and ecosystem services.
The successful implementation of FISE constitutes the first crucial step toward the harmonization of data, approaches, and indicators to record, store, analyze, assess, and predict the effects of multiple drivers, and can be regarded as a pioneer for the digital harmonization of FH in Europe. Beyond these achievements, a future MUSO-FH-MN requires a critical consideration of the “resilience” of existing FH monitoring programs and initiatives in order to overcome the impending challenges of the 21st century in data management, analysis, or prognosis. Such an MUSO-FH-MN can provide a data-driven, rapid, cost-effective, flexible, and consistent assessment and decision-making support system for scientists, forest managers, or stakeholders. In order to meet these challenges, numerous requirements will be discussed in detail in the following chapters.
Furthermore, there are numerous other networks and activities, which should also be included in a future MUSO-FH-MN (see Table2).
Table 2.Existing networks and activities that should be included in a future multi-source forest health monitoring network (MUSO-FH-MN).
Acronym Name Link Reference
USFS FIA program
United States Forest Service (USFS) Forest Inventory and Analysis (FIA) database
https://www.fia.fs.fed.us/
https://www.fia.fs.fed.us/tools- data/index.php
[59,60]
TreeDivNET Global network of tree diversity
experiments http://www.treedivnet.ugent.be/ [61]
T4F Trees4Future http://www.trees4future.eu/
database-access.html [62]
FunDivEUROPE Exploratory Platform
Functional significance of forest
biodiversity http://project.fundiveurope.eu/ [63]
BIOTREE-NET
BIOTREE—BIOdiversity and ecosystem processes in experimental TREE stands
http://portal.biotreenet.com/ [10,64]
Global Forest Watch Global Forest Watch http://www.globalforestwatch.org/ [65,66]
GFOI Global Forest Observations
Initiative http://www.gfoi.org/ [66]
GENFORED Forest genetic trials network
https:
//sites.cita-aragon.es/genfored/en/
welcome-to-the-genfored-web-site/
EUFORGEN European forest genetic resources
program http://www.euforgen.org/ [67]
3. Requirements to Understand the Effects of Multiple Stressors on Forest Health
Statement: Our knowledge about the effects of stressors and disturbances on the biodiversity and functioning of forest ecosystems is still limited.
In order to understand the effects of stressors and disturbances on forest ecosystems, we need to investigate interactions between different trophic levels (e.g., soil organisms and plants), interactions between the biotic and abiotic environment (soil, water, trees), as well as different aspects of biodiversity (taxonomic, phylogenetic, (epi-)genetic, phenotypic/functional). A comprehensive understanding is crucial for Soil–Plant–Landscape modeling, forecasting stress effects, and implementing forest management strategies. All of the existing approaches, i.e., (i) tree and forest lysimeters; (ii) close-range RS approaches such as plant/forest phenomics facilities, controlled environmental facilities (Ecotrons), local tree experiments; and (iii) biodiversity–ecosystem functioning (BEF) experiments need to either be extended or re-established.
Level 1: Tree and forest lysimeters: Milly [68] was the first to indicate the role of soil mixture storage as a means of identifying the link between precipitation and evapotranspiration.
The investigation of soil characteristics, hydrology, and structural properties of the vegetation on small scales is important in order to understand the mentioned link [69]. In this respect, tree or forest lysimeters are particularly suitable for long-term high frequency measurements, and thus for understanding effects of stress on tree physiology, such as effects of water stress, high salinity, nutrient deficiency, or drought stress [69–73]. Indeed, our knowledge about the interactions of soil matrix characteristics, soil moisture, and trees are currently derived from forest lysimeters, but information about the spectral response interactions to phenotype of the trees is still not available. To close this gap, the tree phenotype-spectral response in tree and forest lysimeters needs to be complemented with transmitters using a wireless sensor network [1,74], as well as close-range RS techniques with different sensor characteristics (3D stereo camera, LiDAR technique, 2/3 D thermal camera, hyperspectral thermal cameras, or hyperspectral sensors).
Level 2: Forest inventory plots:The inclusion of the ICP Forests monitoring network (see Chapter 1.3), which assesses tree condition and vitality on a 16×16 km grid over Europe [42,75] or other sample plot networks of national forest inventories, is crucial for ground truth information of forest health. Here, it is particularly important to establish and integrate different RS sensors such as optical or thermal sensors or 3D sensors on different close-range RS platforms such as towers or wireless sensor networks to monitor high frequency spectral information for different forest species in forest inventory plots. These are essential interfaces that provide important information for model and air and spaceborne RS calibration and validation.
Level 3: Plant phenomics facilities, Ecotrons, spectral tree laboratory experiments:One of the most important challenges in forest stress physiology research is the spectroscopic recording of plant species phenotypes in order to gain a better understanding of the links among the phylogenetic relationships of species, their genotype, epigenetics, and phenotype. The genotype of a plant species comprises crucial hereditary information about the DNA. Epigenetics provide information beyond DNA sequences, giving us an understanding of how genetics, the environment, and anthropogenic drivers work together to shape forest ecosystems. The phenotype of a plant represents its anatomical, morphological, and physiological characteristics (traits), and reflects the interactions of trees with their environment, and thus with stressors and disturbances. The affects the phylogenetic, taxonomic, structural, and functional traits of trees, and helps determine a specific phenotype [76,77]. A better understanding of tree stress physiology can be gained by recording the spectral traits (ST) of individual plants and combining this trait information with information on the phylogenetic relationships of species, as well as their genotype and epigenetics. This can be achieved by recording phenotypical plant traits in plant phenomics facilities [78–80] or in controlled environmental facilities (Ecotrons) [81].
Here, non-invasive measurement methods such as RS techniques can be implemented in an automated manner, enabling a holistic and quantitative recording of the phenotype of a plant species over its entire
life cycle at a reasonable cost [82,83]. It is not only the phenotypical traits of the aboveground parts that can be recorded, but also those of seeds or roots [84], as well as the abiotic characteristics of soil and soil water. Entire soil/soil water—tree—spectral response interactions have so far only been measured in Ecotrons, and partially in spectral tree laboratory experiments. Hence, it is imperative to set up forest phenomics facilities that are similar to plant phenomics facilities with additional instruments in the future.
Level 4: Biodiversity–ecosystem functioning (BEF) experiments:The increase in monospecific plantations increases abiotic and biotic stress and disturbances in forest ecosystems. Hence, biodiversity–
ecosystem functioning experiments are required to answer questions about the interactions of forest biodiversity (with different aspects: phylogenetic, functional, structural, taxonomic) with ecosystem functions [61,85,86]. Furthermore, BEF experiments are crucial for answering questions about the response of forest species to stressors and disturbances and thresholds in the response of species [87].
With this, we can gain important insights into post-disturbance trajectories and the individual and combined effects of stressors and disturbances on forest diversity [24]. An example is the resilience of a forest in the light of climate change. To investigate stress–response interactions, BEF experiments should include gradients such as those of latitude, climate, biomass, or experimental diversity [88,89].
Scherer-Lorenzen et al. [64] for example established the large-scale long-term BEF experiment BIOTREE (BIOdiversity and ecosystem processes in experimental TREE stands) on different sites with temperate tree species in order to explore BEF relationships along geological and climatological gradients.
Level 5: Forest landscape types:Long-term forest monitoring experiments for different forest landscape types and eco-regions are extremely helpful in understanding relationships between global forest biodiversity and forest ecosystem functioning as well as the underlying processes. TreeDivNet is a global network of tree diversity experiments that consists of 18 experiments on 36 sites in five eco-regions. TreeDivNet provides insights into the ecosystem functions (e.g., pest resistance potential, carbon sequestration) of diverse plantations [61]. The FunDivEUROPE Exploratory Platform is a network of forest test plots along tree species diversity gradients in six major European forest types, which aims at understanding the effects of species diversity on forest ecosystem functioning [63].
More BEF experiments with tree diversity manipulations have been conducted in Europe, America, Africa, Asia, and Australia [10]. Bruelheide et al. [10] for example established a BEF experiment with 40 tree species in the subtropical part of China to explain the role of tree and shrub species richness for carbon storage and soil erosion. Establishing wireless sensor networks as well as long-term ground truth monitoring data with a high frequency in time for air and spaceborne RS data (see requirement 5) in BEF experiments is urgently required in order to understand the spectral response (amplification factors, mutually exclusive factors) of forests and the effects of phylogenetics, (epi-)genetics, and phenotype on the spectral response.
4. Requirements for Using RS Approaches to Monitor FH
Statement: There are only a limited number of short and long-term ground truth measurements for the calibration and validation of RS data for forest health.
4.1. Requirements for Spatial Short and Long-Term Ground Truth Measurements on Different Scales
There exist crucial requirements for spatial short and long-term ground truth measurements on different scales for the calibration and validation of RS data in order for it to be able to react timely to disturbances and recognize their long-term effects. Traits and trait variation-based drivers exist on different spatio-temporal scales of forest ecosystems [90]. Therefore, a future MUSO-FH-MN requires calibration and validation experiments as well as calibration and validation sites where different close-range air and spaceborne RS sensors can be implemented on different sensor platforms, and on different spatial and temporal scales. Suitable calibration and validation experiments are:
• Level 1—tree and forest lysimeters [70–73];
• Level 2—forest inventory plots [42,75];
• Level 3—close-range RS approaches such as plant/forest phenomics facilities, Ecotrons, and local tree experiments [78–81,84,91,92].
Suitable calibration and validation sites are:
• Level 4—(forest) biodiversity–ecosystem functioning experiments [10,61];
• Level 5—forest landscape types, communities, and ecosystems [93–98].
In the future, wireless sensor networks, microsensor techniques, as well as citizen science applications need to be integrated into MUSO-FH-MN [47]. Webcams, vehicle cameras, smart glasses, camera traps, tablets, and smartphones for science and citizen science might be equipped with complex sensors and sensor combinations such as multispectral, hyperspectral, 3D thermal, or 3D depth cameras, making it possible to derive FH indicators both cost-effectively and flexibly. New developments such as the “HawkSpex®mobile” app are already able to simulate a hyperspectral camera (also referred to as a light spectrometer), recording the spectral fingerprint of objects by using the different colors reflected in combination with intelligent algorithms. Today, a large variety of environmental monitoring apps exist, e.g., for detecting and classifying animal and plant species. Examples are “Pl@ntNet”
(https://play.google.com/store/apps/details?id=org.plantnet&hl=de); apps for fire management [99];
“EpiCollect” [100] for collecting data on epidemiology, ecology, and species community; “eBird” [101]
for the location of bird species; “ESM-app” [102], which maps ecosystem services; “mPING” [103]
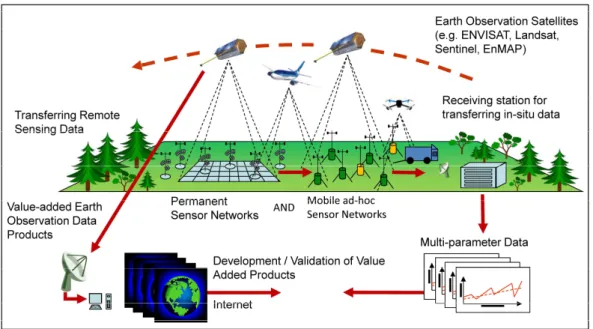
for collecting information about different climate conditions (e.g., hail, snow, rain) and the timing of precipitation, or apps such as “mySeason” [104] to classify vegetation phenology based on Earth observation data. A comprehensive instrumentation to measure abiotic variables as well as indicators of forest intensity and forest management will provide a better understanding of the response of forest ecosystems to stress and disturbances as well as the underlying processes. In the future, MUSO-FH-MN should be linked to short and long-term measurements of spectral plant traits and their variation at calibration and validation sites, close-range RS techniques, applications of citizen science, and the successful calibration and validation of air and spaceborne RS sensors (Figure3).
Remote Sens. 2018, 10, x FOR PEER REVIEW 14 of 51
Examples are “Pl@ntNet” (https://play.google.com/store/apps/details?id=org.plantnet&hl=de); apps for fire management [99]; “EpiCollect” [100] for collecting data on epidemiology, ecology, and species community; “eBird” [101] for the location of bird species; “ESM-app” [102], which maps ecosystem services; “mPING” [103] for collecting information about different climate conditions (e.g., hail, snow, rain) and the timing of precipitation, or apps such as “mySeason” [104] to classify vegetation phenology based on Earth observation data. A comprehensive instrumentation to measure abiotic variables as well as indicators of forest intensity and forest management will provide a better understanding of the response of forest ecosystems to stress and disturbances as well as the underlying processes. In the future, MUSO-FH-MN should be linked to short and long-term measurements of spectral plant traits and their variation at calibration and validation sites, close- range RS techniques, applications of citizen science, and the successful calibration and validation of air and spaceborne RS sensors (Figure 3).
Figure 3. Linking different approaches (high frequency wireless sensor networks up to spaceborne satellites) with relative frequency monitoring, sensors, and different platforms of remote sensing to better describe, explain, predict, and understand forest health with remote sensing techniques as well as improve the calibration and validation of remote-sensing data (modified after Borg [105]).
4.2. Requirements for Merging Different FH Modeling Approaches
In a future MUSO-FH-MN, different methodological approaches, platforms, and networks as well as vegetation models need to be integrated or merged to provide short to long-term statements about FH. Different modeling approaches currently exist for describing forest dynamics at different scales with different complexity [106]:
1. RS model approaches, in situ species traits, in situ species approaches [58].
2. RS model approaches, forest models:
tree level growth model [107]
individual-based forest model [106,108], and
forest growth model (eco-physiological model, [109])
combining imaging spectroscopy, digital object models, and 3D canopy modelling [110]
3. Physical-based RS model, empirical-based RS model for forest species [111].
Figure 3.Linking different approaches (high frequency wireless sensor networks up to spaceborne satellites) with relative frequency monitoring, sensors, and different platforms of remote sensing to better describe, explain, predict, and understand forest health with remote sensing techniques as well as improve the calibration and validation of remote-sensing data (modified after Borg [105]).
4.2. Requirements for Merging Different FH Modeling Approaches
In a future MUSO-FH-MN, different methodological approaches, platforms, and networks as well as vegetation models need to be integrated or merged to provide short to long-term statements about FH. Different modeling approaches currently exist for describing forest dynamics at different scales with different complexity [106]:
1. RS model approaches, in situ species traits, in situ species approaches [58].
2. RS model approaches, forest models:
• tree level growth model [107]
• individual-based forest model [106,108], and
• forest growth model (eco-physiological model, [109])
• combining imaging spectroscopy, digital object models, and 3D canopy modelling [110]
3. Physical-based RS model, empirical-based RS model for forest species [111].
It is interesting to link such forest models with remote sensing measurements. Forest models can then be used to assess the long-term effect of stress and disturbances or derive additional attributes (e.g., productivity, carbon balance/sequestration, future species composition). Forest models have already been combined successfully with height information derived from RS LiDAR data [112]. Forest fragmentation can be analyzed using dedicated metrics, based on RS input, and combined with forest models to analyze changes at forest borders [113,114].
4.3. Requirements for Linking Different Approaches to RS Techniques
“Ecologists are increasingly looking at traits—rather than species—to measure the health of ecosystems” [115]. Furthermore can traits and their variations be monitored on all spatial-temporal scales [116]. As a result, FH indicators can be developed for all spatial and temporal scales. To calibrate and validate RS data as well as discriminate between ST/STV, we need to link spatial and temporal scales of RS platforms and technologies.
However, depending on their spatial, spectral, radiometric, directional, and temporal characteristics, RS sensors are in the position to record only specific ST/STV and related indicators.
Therefore, one sensor alone or the data of one vegetation period only is often not sufficient to quantify ST/STV. Only the multisensorial use (radar, optical, thermal, laser) as well as high repetition rates, as with Sentinel-2A/B (3–5 days), will enable quantifications of ST/STV and the derivation of FH indicators [1]. Future developments of RS technologies will focus on other ST/STV than the ones that now can be recorded, such as for example by applying 3D thermal sensors or 3D forest X-ray sensors [1], or by increasing the temporal resolution of RS sensors. For an effective forest health monitoring, multisensorial and multi-temporal approaches are required.
4.4. Requirements for Merging RS Data from Different Sources
There are a multitude of different sensors available, and these differ in sensor characteristics, including their spatial, spectral, radiometric, angular, and temporal resolution. Merging data is an excellent method for reducing data gaps. It is still technically impossible to apply data merging in order to integrate the advantages of high spatial, spectral, and temporal resolution within one kind of sensor [117,118]. First attempts at data merging used pan-sharpening processes to combine a spatially higher resolution pan-chromatic band with synchronously recorded lower resolution multispectral bands [118], which was a common procedure working with Landsat data. This approach was later extended to high-resolution data from different sensors with different methods [119]. In order to merge a large number of spectral bands with high spatial resolution, methods that had initially been developed (principal components analysis, color space transformation) were gradually replaced by approaches such as multiresolution methods (Wavelet) and high-frequency injection methods, in
order to maintain an optimal synthetic dataset [118]. The approaches of spatial–spectral merging are complemented by the availability of multi-temporal data through spatio-temporal merging [118].
The most well-known approach here is the Spatial and Temporal Adaptive Reflectance Fusion Model (STARFM) [120], which combines the spatial accuracy of Landsat data with the temporal resolution of MODIS data [121]. There are now available approaches merging spatial, spectral, and temporally high-resolution RS sensors into one dataset [118]. Furthermore, a number of other data-merging approaches have been developed to characterize forest ecosystems e.g. imaging spectroscopy and airborne laser scanning data [122].
4.5. Requirements for Understanding and Handling RS Uncertainties
Remote sensing technology acquires information about the Earth surface or atmosphere, often resulting in data and information that is expected to support land use or land management decisions.
The information stored in remote sensing data critically depends on the experimental setup and the system under measurement. As for all experimental data, the recorded values carry observational errors (e.g., Taylor [123]), and errors result in uncertainty. Analogous to error propagation, uncertainty does not diminish when processing the recorded data, e.g., when compensating for atmospheric effects or when deriving products from remotely sensed data. This holds particularly true for aleatory uncertainty (e.g., Kiureghian et al. [124]), which is related to the intrinsic randomness of a measurement resulting in limited data accuracy and precision. Limited optical and spatial sampling bandwidths result in epistemic uncertainty (e.g., Kiureghian et al. [124]) as a consequence of lacking detail/information about the object of investigation. Sensor improvements toward high-resolution spatial and wavelength sampling are aimed at reducing epistemic uncertainty in remote sensing data, practically without the potential to fully overcome the incompleteness of remotely sensed information.
Uncertainty puts the utilization of remotely sensed data under the risk of misinterpretation.
The integration and combination of multiple remote sensing datasets sampling the same sites allows for mutually reducing the epistemic uncertainty hampering the utilization of each individual remote sensing dataset. The joint consideration of multiple remote sensing datasets in an integrated analyses and interpretation approach replaces epistemic uncertainty by aleatory uncertainty of the considered further datasets. However, for aleatory uncertainty handling, mathematics offers some reasonable processing techniques, e.g., averaging. In some cases, measurement accuracy and precision, and thus aleatory uncertainty, can be quantified or at least reasonably estimated during data acquisition, which is advantageous compared to epistemic uncertainty. However, while data integration may be a promising way to turn epistemic uncertainty into aleatory uncertainty, which is potentially more controllable in the data processing and utilization process, the data integration of physically disparate data is a challenging problem on its own.
If no generally valid physical theory is available to describe the link between the considered datasets quantitatively, this link must ideally be learned by complex machines, e.g., artificial neural networks. Historically, deterministic transfer functions, which are often derived empirically from calibration measurements, are employed to link physically disparate data or derive products from remote sensing data. While the tuning parameters of such transfer functions can be adjusted, or even probabilistically defined, ontological uncertainty [125] about the general validity of the nature of the used transfer functions remains. Ontological uncertainty is usually associated with a state of ignorance not recognized by human interpreters. It cannot be quantified, and may thus unrecognizably hamper a proper utilization and interpretation of remote sensing databases. Here, data analytics approaches based on learning machines finding data interrelations in an unbiased manner free of preconceptions may be the only way toward honest and quantitative uncertainty handling by turning epistemic uncertainty into aleatory uncertainty without introducing additional ontological uncertainty.