Energy & Buildings 201 (2019) 53–69
ContentslistsavailableatScienceDirect
Energy & Buildings
journalhomepage:www.elsevier.com/locate/enbuild
Heat load assessment in Central European cities using an urban climate model and observational monitoring data
Anita Bokwa
a,∗, Jan Geleti ˇc
b,c, Michal Lehnert
d, Maja Žuvela-Aloise
e, Brigitta Hollósi
e, Tamás Gál
f, Nóra Skarbit
f, Petr Dobrovolný
c,g, Monika J. Hajto
h,a, Rafał Kielar
h,
Jakub P. Walawender
h,∗∗, Pavel Š ť astný
i, Juraj Holec
i,j, Katarzyna Ostapowicz
a, Jarmila Burianová
g, Marcel Garaj
i,kaJagiellonian University, Institute of Geography and Spatial Management, 7 Gronostajowa St., 30-387 Kraków, Poland
bInstitute of Computer Science of the Czech Academy of Sciences, Department of Complex Systems, Pod Vodárenskou v ˇeží 271/2, 182 07 Prague, Czech Republic
cGlobal Change Research Institute of the Czech Academy of Sciences, B ˇelidla St. 986/4a, 603 00 Brno, Czech Republic
dPalacký University in Olomouc, Department of Geography, Faculty of Science, 17. Listopadu St. 12, 771 46 Olomouc, Czech Republic
eZentralanstalt für Meteorologie und Geodynamik (ZAMG), Division Data, Methods, Modeling, Section Model Applications, Hohe Warte 38, 1190 Wien, Austria
fUniversity of Szeged, 13 Dugonics ter St., Szeged H-6720, Hungary
gMasaryk University Brno, Faculty of Science, Department of Geography, Kotláˇrská 2, 611 37 Brno, Czech Republic
hInstitute of Meteorology and Water Management – National Research Institute, 14 Borowego St., 30-215 Kraków, Poland
iSlovak Hydrometeorological Institute, Jeséniova St. 17, 83315 Bratislava, Slovakia
jComenius University in Bratislava, Faculty of Natural Sciences, Department of Physical Geography and Geoecology, Mlynská dolina, Ilkovi ˇcova St. 6, 84215 Bratislava, Slovakia
kSlovak Academy of Sciences, Institute of Hydrology, Dúbravská cesta 9, 84104 Bratislava, Slovakia
a rt i c l e i n f o
Article history:
Received 6 July 2018 Revised 8 July 2019 Accepted 11 July 2019 Available online 11 July 2019 Keywords:
Heatwave Thermal comfort Urban climate Air temperature MUKLIMO_3
a b s t r a c t
Diurnal variability of spatialpattern ofair temperaturewas studied infive cities in CentralEurope:
Bratislava (Slovakia),Brno (CzechRepublic), Kraków (Poland), Szeged(Hungary) and Vienna(Austria), duringoneoftheheatwavesin2015(4–14August),withtheapplicationofmicro-climatemodelMUK- LIMO_3.8thAugustwas chosentostudyindetailtheurbanheatloadat10.00,16.00,22.00and 4.00 CEST.LocalClimateZonesconceptwasusedtosupplydataforthemodel andfortheinterpretationof theresultsobtained.Modeloutcomeswerevalidatedwithmeasurementdatafrom86pointsbelonging tothenetworkswhichoperateinthecitiesstudied.TheresultsobtainedshowthatamongurbanLCZ,the highestheatloadwasobservedforLCZ2and3from16.00to4.00,whileat10.00thereisnosuchclear pattern.Unlikeforestedareas,opengreenareascancontributetothegenerationofhighairtemperature:
>35°Cduringdaytimeand>30°Cduringnighttime.Importantfactorscontrollingtheintra-zonaland inter-zonalvariabilityofairtemperatureinparticularLCZsarethelocalenvironmentalconditions.During thedaytime,diversifiedreliefintheareaofthecityanditsvicinitiesgenerateshigherheatloadinthe valleys’floorsthaninareaslocatedabove,bothinruralandurbanareas.Thesamelandformsexperience lowerheatloadduringthenighttimeduetoairtemperatureinversionseffect.
© 2019ElsevierB.V.Allrightsreserved.
∗ Corresponding author.
E-mail addresses: anita.bokwa@uj.edu.pl (A. Bokwa), geletic.jan@gmail.com (J.
Geleti ˇc), michal.lehnert@gmail.com (M. Lehnert), maja.zuvela-aloise@zamg.ac.at (M. Žuvela-Aloise), brigitta.hollosi@zamg.ac.at (B. Hollósi), tgal@geo.u-szeged.hu (T. Gál), skarbitnora@gmail.com (N. Skarbit), dobro@sci.muni.cz (P. Dobro- volný), monika.hajto@imgw.pl (M.J. Hajto), rkielar@gmail.com (R. Kielar), contact@jakubwalawender.pl (J.P. Walawender), Pavel.Stastny@shmu.sk (P. Šť astný), Juraj.Holec@shmu.sk (J. Holec), katarzyna.ostapowicz@uj.edu.pl (K. Ostapowicz), burianova@geogr.muni.cz (J. Burianová),garaj@uh.savba.sk (M. Garaj).
∗∗Currently at: Deutscher Wetterdienst, Global Precipitation Climatology Centre, Frankfurter Straße 135, 63067 Offenbach, Germany
1. Introduction
Theurbanclimateisaphenomenononalocalscalebutithasa directandsignificantimpacton54%ofthetotalglobalpopulation livingincities[64],whichisexpectedtogrowfurther,byapprox- imately1.63% peryearbetween2020and2025andby 1.44%per yearbetween 2025and 2030[65].The urban climateis a result ofsignificant changesin radiative,thermal,moisture andaerody- namiccharacteristics. Themajor driverof thesecomplexchanges is the impact of the properties of urbanized areas (e.g. the size https://doi.org/10.1016/j.enbuild.2019.07.023
0378-7788/© 2019 Elsevier B.V. All rights reserved.
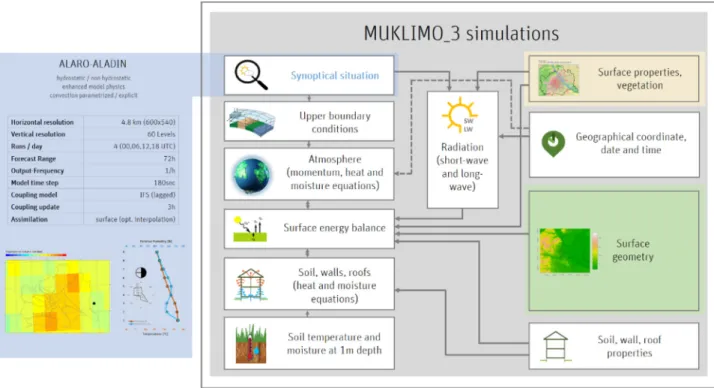
Fig. 1. Schematic structure of the MUKLIMO_3 model components, input data and coupling with the ALARO-ALADIN numerical weather prediction model.
Fig. 2. LCZ classes (a) and relief features together with the location of measurement points (b) in the cities studied (BRA - Bratislava, BRN - Brno, KRW - Kraków, SZE - Szeged, VIE - Vienna); LCZ class description can be found in Appendix B .
A. Bokwa, J. Geleti ˇc and M. Lehnert et al. / Energy & Buildings 201 (2019) 53–69 55
Fig. 2. Continued
anddensityofbuildings,theshareofgreenareasandwaterbod- ies,airpollution)onatmosphericprocesses(e.g.airflow,reflection ofsolarradiationdueto surfacealbedo,precipitation origin),and thatimpactisadditionallymodifiedbylocalenvironmentalcondi- tions(e.g.reliefwhichcancontributetotheairtemperatureinver- sionoccurrence,andvicinityofwaterbodies,whichcanchangelo- cal windfield)(e.g.[30,40]).Thepresentpapercontributestothe studies concerning air temperature modifications in urban areas, during a summer time heat wave. The heat load in cities is ex- pected to get intensifiedin the future asthe global temperature increases,whichbecomessuperimposedonairtemperaturemodi- ficationscharacteristicforurbanareas,knownasurbanheatisland (UHI)effect(e.g.[24,30,40]).Increasedtemperaturesinurbanareas during heat waves are of special importance and might be con- sideredasextremebiothermalconditionsresultinginfar-reaching direct and indirect health effects (e.g. [3,29,39,45,57]). In addi- tion,mostrecentstudiesconcludedthatduringheatwave events, UHI effect iseven more pronounced (e.g. [4,24,36]). In 2013, the European Commission published “An EU Strategy on adaptation
toclimatechange” andrecommendedthe preparationofnational strategies,including urban areas [11]. Therefore,in order to plan andundertake themitigationandadaptationactions inparticular cities,itisnecessarytorecognize,amongotherelements,themag- nitudeandspatialextent ofheatloadinurban areasduringheat waveevents.Withapplicationofurbanclimatemodelssupported byextensiveon-sitemeasurementsitispossibletoobtainthemost completeinformationonUHIeffectduringaheatwave,inrelation to bothland use/land cover (LU/LC)and landform. Forexample, Mengetal.[37]showedtheimportanceofhighqualityLU/LCdata usedintheWRFandUCMmodelsinthepredictionofUHIduring aheatwaveinGuangzhou,China.LiandBou-Zeid[36]studiedthe caseofaheatwaveinBaltimore,USA,andshowedthatUHIinten- sitywasincreasedowing todifferencesinthelatentheatamount available in rural and urban areas. Similarly to Meng et al. [37], they usedonly twomeasurement pointsinmodel validationand recommendedincreasingthatnumberinfurtherstudies.Gutiérrez etal. [23] analyzed a heat wave caseforNew York andused as manyas 36measurement pointsto validate theresults obtained
Table 1
Cities included in the study.
City Country Area [km 2] Altitude range [m a.s.l.] Population (year)
Bratislava Slovakia 368 126–450 419,678 (2015)
Brno Czech Republic 230 200–525 377,000 (2015)
Kraków Poland 327 145–459 761,873 (2014)
Szeged Hungary 281 46–143 162,593 (2015)
Vienna Austria 414 141–581 1766,746 (2014)
Explanations: area within the administrative border, altitude range within the domain taken for analyses (extracted from DEM). Source of population data: http://ec.europa.eu/eurostat/web/cities/data/database .
with the WRF model. On that account, the aims of the present studyareto:1)definethediurnalvariabilityofthespatialpattern ofthe airtemperature in five Central European cities: Bratislava (Slovakia),Brno (CzechRepublic), Kraków (Poland), Szeged (Hun- gary),andVienna(Austria),duringoneofthesummerheatwaves of 2015, using micro-climate model MUKLIMO_3 which incorpo- ratesdetailed information aboutrelief, LU/LC andmeteorological conditions,2) validateMUKLIMO_3modelsimulationresultswith data from automatic measurements networks, 3) define the ar- easmostendangered byexcessiveheat loadinthestudied cities, in relation to the impact of particular factors included in the analyzes.
Considering thatall the investigatedcities(except Szeged)are locatedinareaswithdiversifiedrelief,theinteractionofmicrocli- maticprocessesgeneratedby bothurban LU/LCandrelief creates acomplicatedspatialstructureofairtemperature. Theanalysisof thatstructuremakesitpossibletoestimatetheroleofbothnatural andanthropogenicfactorsingeneratingtheexcessiveheatstressin urbanareas.
2. Studyareas
The analyzes were performed for five cities located in Cen- tral Europe (Table 1, Fig. 1). Various studies, previously com- pleted for the selected cities, made it possible to achieve the recognition of their present urban climate features (e.g. [2,8–
10,12,13,17,20,31,61,62,67]).AccordingtotheKöppen-Geigerclimate
classification [28,44], Bratislava,Brno, Kraków andViennaare lo- catedintheCfbzone,whileSzegedintheCfazone.Basicclimatic dataaboutthecitiesstudiedareshowninAppendixA.
Bratislava is located in southwestern Slovakia and it occupies both banksof theDanube riverandthe left bank ofthe Morava river. It is the country’s largest city. The historical city center is located between the Danube and south-eastern slopes of the Carpathian mountain range, the Malé Karpaty Mts. City districts areprimarily locatedinthelowermostareas.Complexorographic conditionsinthe Bratislava regiongeneratethedistinct andvari- able nature of the climate in the city and its surroundings. The Malé KarpatyMts.especiallyaffectoverallaircirculationandmost oftheclimatecharacteristics.
Brnoissituatedinthesouth-easternpartoftheCzechRepublic.
Its areaischaracterizedby abasinpositionwithcomplexterrain.
Lower and flatterterrain is typical for the southern andeastern partsof thestudyarea. There isa largewater reservoir(with an areaofapproximately2.6km2)locatedonthenorth-westernbor- derofthebuilt-uppart.Thestudyarealiesinoneofthewarmest andthedriestregionsintheCzechRepublic.
Krakówislocatedinsouthern Poland,inthevalleyoftheVis- tulariverwhichpassesfromwesttoeast.Thehistoricalcitycenter isatthebottomoftheVistularivervalley(about200ma.s.l.)and onalimestonetectonichorst(WawelHill),emergingfromtheriver valley.The cityareaissurroundedbyhills north,south,west,but noteast.Theurbanizedareascanbefoundintherivervalleywith itsterracesandinconvexlandformstothenorthandsouthofthe citycentre[10].
Fig. 3. a) Taylor diagram [59] for hourly air temperature (at 2 m) during the heatwave period (4–14th August) in 2015. Each symbol represents a measurement point. The diagram shows correlation coefficient between modelled and observed air temperature (azimuthal angle), root-mean-square error (proportional distance from the point on the x-axis) and standard deviation (radial distance from the origin) between simulations and observations. b) Mean hourly bias of air temperature over all available weather stations from each city during the whole heat wave period and the mean absolute error for the cities.
A. Bokwa, J. Geleti ˇc and M. Lehnert et al. / Energy & Buildings 201 (2019) 53–69 57
Fig. 4. Spatial distribution of modelled air temperature on 8th August at 10.00 in Bratislava (BRA), Brno (BRN), Kraków (KRW), Szeged (SZE) and Vienna (VIE).
SzegedislocatedinthePannonianPlaininCentralEurope.The urbanized area covers only about 30 km2 of the city. The Tisza River is the axisof the town andthe city has a regular avenue- boulevardstructure.Itischaracterizedbyadenselybuilt-upcentre withhistoricalbuildings,blocksofflatsinthenorthernpart,anda largeareaoffamilyhousesandwarehousesmostlyinthewestern part[60].
ViennaisthecapitalcityofAustriaandthelargestcityusedin this study.It is located atthe easternmost extension of theAlps inatransitionzonetothePannonianPlainwiththeDanubeRiver passing through the city. The urbanized area is characterized by thehistoricalcentresurroundedbyagreenbelt,densebuilt-upar- easintheinner districts,andlow-densityresidential areasonthe hillsidesin thewestern partofthe cityandin theflat terrainin the south andeast direction. Mostofthe industrial areasare lo- catedintheeasternandsouthernpartofthecity.
3. Dataandmethods
The studyperiodis 4–14August 2015,when thearea of Cen- tral Europe experienced a heat wave. There are manydefinitions ofa heatwave [47]andinthepresentpaperthephenomenonis definedasaperiodofatleast3dayswithmaximumairtemper- ature ≥30°C.In all thecitiesstudied, themaximum temperature wasover30°Ceachdayofthestudyperiodchosen.Summer2015 wasone ofthemostextremesummerseasonsinEuropeinterms
ofthermalconditionsandthe hightemperatureswere causedby acombinationofforcedresponses andinternal atmosphericvari- ability[14].Intheinterpretationoftheresultsobtained,adistinc- tion ismade betweenthe spatialpattern ofair temperatureand UHI,asprevious studies (e.g.[9]) showedthat inurban areas lo- catedinconcavelandforms,UHIisoftenanelementofacomplex spatialpatternofairtemperature. Forexample,inthecaseofair temperatureinversion, UHI intensityis modifiedby the presence ofcoldandwarmairstrata inthevalley. Furthersubsectionsde- scribemethods usedinthe presentstudywhichconsist ofMUK- LIMO_3modelingandstatisticalanalyzeswhiledatausedinclude LU/LCandmeteorologicaldata.
3.1. MUKLIMO_3model
MUKLIMO_3 belongs to the group of computational fluid dy- namics(CFD)modelsdesignedtosimulateatmosphericflowfields in the presence of buildings [49,50,55]; e.g. ENVI-met [16], MI- TRAS [46], MIMO [15] or PALM-4U [42] can be mentioned as other examples. By coupling MUKLIMO_3 to regional numerical weatherpredictionmodels,statementsonthebehaviorofkeyat- mosphericvariablesconsidering theLU/LCcharacteristicsonalo- cal spatial (about 100–300m) resolution can be made. Further- more,thethermo-dynamicalversionofthemodelwithparameter- izationofunresolvedbuildings[52]shortwaveandlongwaveradi- ation,balanced heat andmoisture budgets in thesoil [53] and a
Fig. 5. Spatial distribution of modelled air temperature on 8th August at 16.00 in Bratislava (BRA), Brno (BRN), Kraków (KRW), Szeged (SZE) and Vienna (VIE).
vegetationmodel based on Siebert et al.[48] allows simulations oftheurban environmentonalargerspatialscalethanother mi- croscale models, including the effects of orography. The numeri- caltreatmentofunresolvedbuilt-upareasandtreesincludesheat, radiation,andwatervaporbalance atcorresponding surfacesand adequateparametrization dependingon thecharacteristics ofthe built-upandgreenareas[51,52].Thenumericalapproachforthe calculationofshortwaveirradiancesatthe ground,thewalls, and theroofsofbuildingsinan environmentwithunresolvedbuilt-up isdescribedbySieversandFrüh[54].Theflowbetweenbuildings isparameterizedthroughaporousmediaapproachforunresolved buildings[22].Theunresolvedbuildingsarecharacterizedwiththe volume fraction (building area and height) and the wall area of thebuildingswithin thegridcell.Themodeluseshigh-resolution orographyandLU/LCdistributiondata.ForeachLU/LCclass,a set ofparameters is definedto describe LU/LC propertiesand urban structures:fractionof builtarea (
γ
b), meanbuilding height (hb), wall area index (wb), fractionof pavement ofthe non-built area (v), fraction of tree cover (σ
t) andfraction of low vegetation oftheremainingsurface(
σ
c),treeheight(ht),andheightofthelowvegetation(hc).Fractions
γ
b andσ
t are relative tothe totalgrid cellarea. Fractionv isrelative to the area withoutbuildings and treesandσ
cisrelativetotheremainingsurface(seeAppendixB).The model does not include cloud processes, precipitation, hori- zontal runoff, or anthropogenic heat, but can simulate the daily cycleof temperature, relative humidity, and wind characteristics
onahighresolutionspatialscale.Themodeldomaincoveringthe urban andsurroundingareasvariesamongcities.The simulations inthisstudywerecarriedout onahorizontalresolutionof100m andverticalresolutionvarying between10and50mwithdenser grid spacingnear surfaceuntilabout 1000m vertical height. The boundaryconditionsaregivenbyatime-varying1Dversionofthe MUKLIMO_3modelthat simulatesthedaily cycleoftemperature, wind,relativehumidity,andenergyfluxesatthereferencestation representative foratmosphericconditionsoutsideofthe city.LCZ classificationasdescribedinSection3.2wasusedtoobtainmodel input dataonLU/LC,while initialmeteorologicaldata weretaken fromALAROmodelandreferencestations,describedinSection3.3. MUKLIMO_3provideshourlymicro-scaleatmosphericinformation takingintoaccountdetailsofcitystructureswithahorizontalres- olution of 100m. Illustration of the model workflow is given in Fig.1.
3.2. Landuse/landcoverdata
TheLocal ClimateZone (LCZ)classification[58] hasbeenused to define LU/LC distribution in the cities studied. The LCZ sys- tem was initially designed for the classification of urban mea- surement sites, but meanwhile several methods for LCZ map- ping have been proposed [6,17,26,34]. For Kraków, Vienna, and Szeged, LCZs were delineated usingthe WUDAPT method(World UrbanDatabaseandAccessPortalTools;[5,6]).Forthestudyareas
A. Bokwa, J. Geleti ˇc and M. Lehnert et al. / Energy & Buildings 201 (2019) 53–69 59
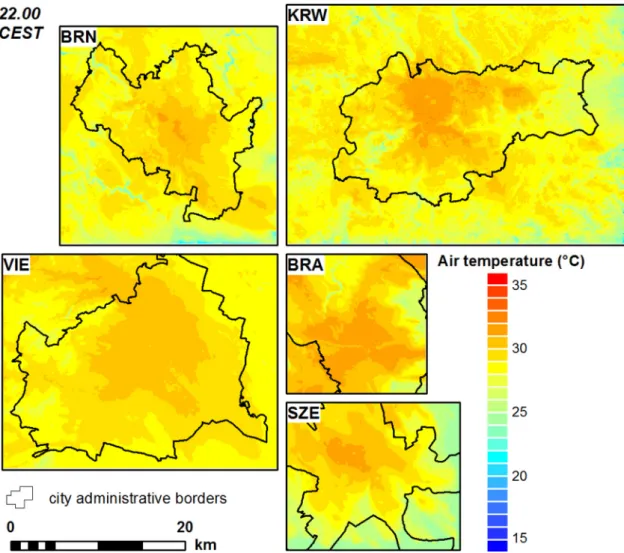
Fig. 6. Spatial distribution of modelled air temperature on 8th August at 22.00 in Bratislava (BRA), Brno (BRN), Kraków (KRW), Szeged (SZE) and Vienna (VIE).
Table 2
Reference stations for the cities studied.
City Station name WMO ID Altitude [m] Coordinates
Bratislava Bratislava-Ivanka, airport 11816 142 48.18 °N, 17.20 °E Brno Brno/Tu ˇrany, airport 11723 246 49.15 °N, 16.68 °E Kraków Kraków/Balice, airport 12566 237 50.06 °N, 19.78 °E Szeged Szeged/HMS meteorological station 12982 83 46.25 °N, 20.08 °E
Vienna Groß-Enzersdorf 11037 153 48.18 °N, 16.55 °E
includedinthepresentpaperweusedmultipleimagesfromdiffer- entseasons,astheclassificationgivesbetterresultswithincreased spectralinformationapplied.LocalenvironmentalspecificsinBrno andBratislavadidnotallowtheuseoftheWUDAPTmethodwith sufficient accuracy, hence other LCZ classification methods were implemented [17,26]. LCZ maps ofall the citiesare presentedin Fig.2andLCZssymbolsareexplainedinAppendixB.LCZcompo- sition inparticularcitiesisan importantfactoraffecting airtem- peraturedistributionwhichwillbediscussedfurther.
3.3. Meteorologicaldata
Meteorological dataforthe MUKLIMO_3model wereobtained fromthelimited-areanumericalweatherpredictionmodelALARO (horizontal resolution of 4.8km) and from the measurements at reference stations located in rural areas close to the cities stud-
ied. The ALARO modeloperated at the Zentralanstalt für Meteo- rologieundGeodynamik(ZAMG)usesthedynamicalcorethatwas previouslydevelopedfortheALADINmodel[7,68],withaphysics packagespecifically conceivedto be runatconvection-permitting scales [27].Thehydrostaticversion ofthe modelhasbeeninde- ployment since 2011 performing integrations of up to 72-hlead timebasedonECMWFIFSoutput.Fortheevaluationofthemodel performanceduringthesummerheat waveperiodin 2015,infor- mation on the geopotential height, total cloud cover, and verti- cal profiles of temperature, humidity, andwind characteristics of the ALARO 00 UTC run with +6h forecast were extracted for a 4×4 grid domain close to the reference station of each city. In each city studied, a reference station was defined as a meteo- rological station witha standard range of measurements andlo- catedinaruralareaclosetothecity,notdirectlyaffectedbyUHI (Table2).
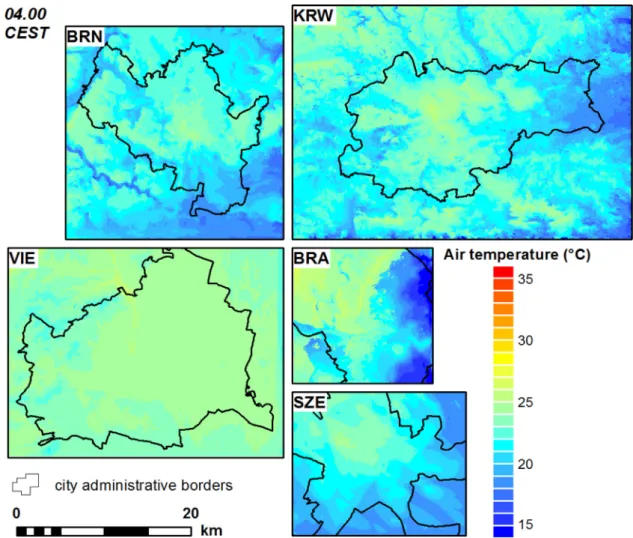
Fig. 7. Spatial distribution of air temperature on 9th August at 04.00 in Bratislava (BRA), Brno (BRN), Krakow (KRW), Szeged (SZE) and Vienna (VIE).
Table 3
Meteorological measurement networks operating in the cities studied.
City No. of stations References with information about networks
Bratislava 17 [38]
Brno 14 [13,20]
Kraków 22 [10]
Szeged 24 [62]
Vienna 9 [21]
The datafrommeasurementstationswerefirstusedtochoose thestudyperiod.Apartfromthecriterionofmaximumairtemper- ature≥30°C,cloudinessandprecipitationwereconsidered.Onlyin Krakówwere theretwo dayswithprecipitation,i.e.5thand12th August,andthose dayswere excluded fromfurtheranalyzes ow- ingtomodel limitations.Stationdata wereusedto providesome initialparametersforthemodel(Section3.1).Additionally,ineach citythereexistsanetworkofautomaticmeasurementpointsused formodelvalidation.Detailsaboutmeasurementnetworksarepro- videdinTable3.
3.4.Statisticalanalyzes
The firststepofthemodeloutputsanalysiswasthevalidation ofmodelresultswiththemeasurementdatafromtheperiod4–14 August2015.Twosamplepairedt-testandF-testwereusedforthe
airtemperaturemeasurementseriesforparticularpointsfromthe automatic networks andthe air temperature seriesfor the same locations produced by the model. A Taylor diagram was used to presentstatisticalparameters such asthe Pearson correlationco- efficient,theroot-mean-square(RMS)error, andthestandard de- viationdescribingthecorrespondencebetweenbothtypesofdata [59].
In the second step, the diurnal variability of spatial patterns ofairtemperatureforparticularcities,basedonmodeloutcomes, wasanalyzed.TheheatwavewasmostintensiveintheCentralEu- ropean region on 7thand 8thAugust 2015 [63].8th August was chosen for further analyzes instead of evaluating the entire heat wave. This approach was chosen with emphasis on the highest available accuracyofthesimulation,owingtoweather conditions dominated by processes driven by intensive solar radiation and lackofprecipitationinallthecitiesstudied.Basedontheprelimi- naryresults,fourtermswerechosenfortheanalysisofthespatial patternofairtemperature(hoursinCEST,i.e.UTC+2):10.00repre- sentingbefore-noonstructureofUHI,16.00representingafternoon structureofUHI,22.00representingevening-timestructureofUHI, and04.00ofthesubsequentdayrepresentingnight-timestructure ofUHI.Foreachcityandeachofthehours mentioned,themodel outputsintheformofamapofairtemperaturedistributionwere obtained, making it possibleto analyze theinfluence ofdifferent landforms andLU/LC types(represented by LCZs). Heatloadwas definedwiththefollowingindicescalculatedforthehourschosen:
1.airtemperaturerangeinparticularLCZs,comparedinboxplots,
A. Bokwa, J. Geleti ˇc and M. Lehnert et al. / Energy & Buildings 201 (2019) 53–69 61
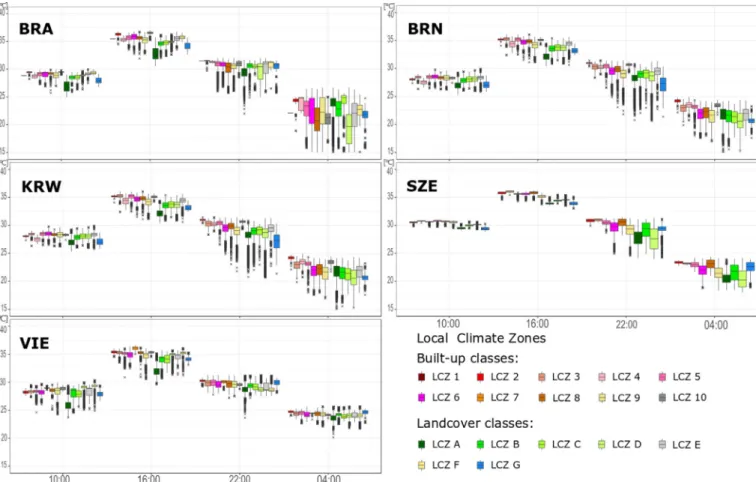
Fig. 8. Box-plots for LCZs on 8th August at 10.0 0, 16.0 0, 22.0 0 and 9th August 04.0 0 CEST. The lower part of the box is the first quartile, and the upper is the third quartile.
Whiskers indicate the lowest value still within 1.5 IQR (IQR = third quartile −first quartile) and the highest value still within 1.5 IQR. Black crosses indicate outliers.
2.airtemperaturediversityinurbanized(No.1–10)andnon-built- up (symbolA–G)LCZs definedwiththemedianvalues range,i.e.
thedifferencebetweenthehighestandthelowestmedianvaluein aparticularLCZsgroup,3.theshareofacity’sareabelongingtoa particularLCZwithairtemperatureexceeding25°Cand30°C;for 04.00 the threshold20°C was usedadditionally. Additionally, for each city exceptSzeged, the mean modeled airtemperature was calculatedforpixelsbelongingtoLCZ5(i.e.openmid-rise)andlo- cated atdifferentaltitudes (Szeged is not includedowing to low altitudevariability) at10.00,16.00,22.00and4.00CEST.LCZ5is themostcommonoftheurban onesandthereforeitcanbeused toseetheimpactofreliefinurbanareas.
4. Results
4.1. Modelvalidation
Inordertoassessthemodelperformance,thesimulatedhourly values of air temperature at 2m above ground were compared with the hourly observational data from 86measurement points (seetable3)duringtheheatwaveperiod4–14August2015.Statis- ticaltestsdescribedinSection3.4wereused(AppendixC)andthe results,whichwerepresentedusingaTaylordiagram(Fig.3a), in- dicate that the modelwas able to describe the main features of the spatiotemporal variability of air temperature in all the ana- lyzedcities.Thesimulatedtemperaturevaluesgenerallyagreewell with the observations. Theyhave highcorrelation (between 0.80 and0.95) andrelatively low RMSerrors (between1°Cand 3°C).
The performance ofthemodel variesprimarilybetweendifferent
measurementpointswithin thecity,andsecondarilybetweenthe cities,asisillustratedinFig.3aaswell.Themodelresultsatmost of the measurement pointsshow a correlation higher than 0.90.
Fig.3b indicates the performance of the MUKLIMO_3model and showsthemeanhourlytemperaturebiasaveragedoverallmeteo- rologicalstationsineachcityduringtheheatwaveevent.Thebest model performance was achieved in Vienna (mean absolute er- ror,MAE:1.46°C), followedbySzeged(MAE: 1.55°C),Brno(MAE:
1.83°C),Kraków (MAE:2.12°C)andBratislava(MAE: 2.75°C). The evaluationshowslargertemperaturebiasesinKrakówandSzeged during the evening time, whereas in Bratislava and Brno larger temperaturebiasesoccurinthemorninghours.
4.2.Spatiotemporaldistributionofairtemperature
AsmentionedinSection3.4,8thAugustwasoneofthehottest daysin 2015 inall thecities (e.g. [35, 63]) and thereforeit was chosenforthestudyofspatiotemporalpatternsofairtemperature using the modeloutcomes. For the representativeness of the re- sults,itisimportanttoemphasizethatthespatiotemporalpattern ofairtemperatureonthatdayreflectswellthegeneralpatternsfor mostoftheotherdaysoftheheatwave.Basedonthemodelsim- ulations, the maximum dailytemperatures were mostlybetween 32.0and37.0°Cdependingontheparticularcityandlocation.The day could be additionally considered as a hot day with a tropi- calnightasduringthefollowingnightthecondition:tmin ≥20.0°C wasfulfilledinallcitiesanalyzed.Thissectionpresentsthespatial patternsof the elementsofheat load (as definedin Section 3.4) forthefourhourschosen,forallthecitiesstudied.
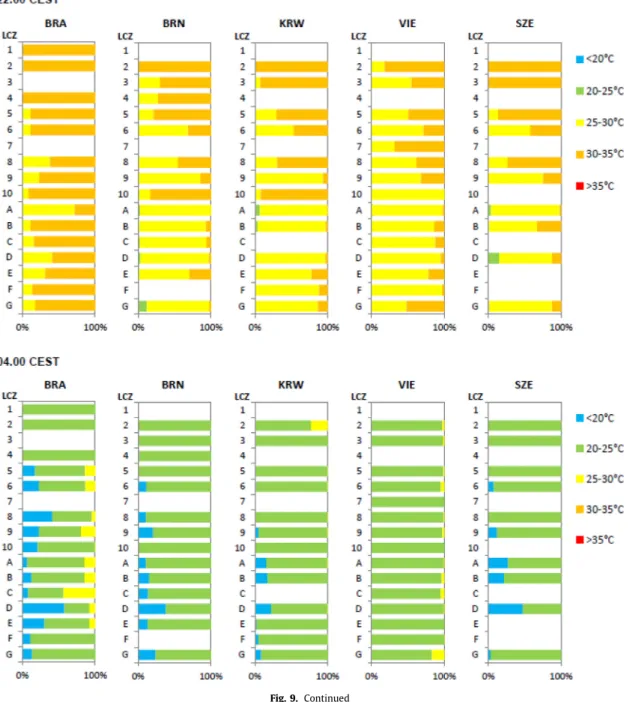
Fig. 9. Share (%) of the LCZs area in particular cities with air temperature < 20 °C, 20–25 °C, 25–30 °C, 30–35 °C and > 35 °C on 8th August at 10.0 0, 16.0 0, 22.0 0 and 9th August 4.00 CEST. For explanations see App. B and Fig. 4 .
Figs. 4–7show thespatialdistribution ofmodeledairtemper- atureatthechosen momentsof8thAugust2015.Inthemorning (10.00)the dominant influence of the relief on the formation of the airtemperature pattern wasobserved; the modeled temper- atureswere predominantlyhigher in low locationsthan in areas locatedseveraltensofmetersabovethevalleyfloorsUHIwasnot distinctivelyformedinBratislava,Brno,Kraków andViennabutit hadalreadybeguntoforminSzeged,wherethereliefvariabilityis low(Fig.4).
In the afternoon (16.00) air temperature reached the maxi- mum daily values compared to other hours. In Brno, Bratislava, Kraków and Vienna, the model calculated that elevated loca- tions (predominantly beyond the compact urban built-up area) remained relatively cooler. UHI was well developed in all cities studied and covered virtually all of the compact built-up areas (Fig.5).
Spatial differentiation of temperature patterns increased at night,ina time ofnegativeenergeticbalance,severalhours after sunset (22.00).The influence ofthe relief wasevident mainly in the narrow valleys near Bratislava, Brno and Kraków, where the modelshowedarapiddecreaseoftemperaturewhiletheairtem- peratureinurbanizedareasremainedsignificantlyhigher(Fig.6).
InthecaseofSzeged,thesimulationshowedmostprobablythe effect of the advection of warmer air from the city to the sur- rounding countryside. InBratislava, Brno, Kraków,andVienna, in ruralareas,airtemperatureinversioncanbeobserved,i.e.airtem- perature in the valley floors is the lowest compared to the sur- roundingslopesandhilltops.
Late at night (04.00) UHI was well-developed and maximum UHI magnitudevalues (which occurredatdifferent hours inpar- ticularcities,accordingtothemeasurementdata)reached6.4Kin Bratislava,5.7KinBrnoandinKraków,5.4KinSzeged,and5.0in
A. Bokwa, J. Geleti ˇc and M. Lehnert et al. / Energy & Buildings 201 (2019) 53–69 63
Fig. 9. Continued
Vienna.Themodelsimulationsshowedairtemperatureinversions, withhighertemperaturestobefoundinelevatedlocationsthanin thevalleys(Fig.7).
Fig. 8 provides data tostudy airtemperature range inpartic- ular LCZs air temperature diversity in urbanized (No. 1–10) and non-built-up (symbol A–G)LCZs defined withthe medianvalues range,i.e.thedifferencebetweenthehighestandthe lowestme- dian value in aparticular LCZs group. At10:00, the airtempera- turerangeobserved inparticularLCZs ismuchsmaller inSzeged than in other citieswhich is linked to its southernmost location andtheearliest sunrisehour. At10:00,16:00and22:00, thermal conditionsweremorediversifiedinnon-built-upareas(LCZsA–G) thaninurbanizedones(LCZs1–10),exceptKrakówat22:00.Me- dian range forLCZs A–G reached: from0.7Kin Szeged to 3.5in Vienna, from0.7KinSzegedto3.3KinVienna,andfrom1.4Kin Viennato2.3KinBrno,respectively.ForLCZs1–10thevalueswere from 0.2Kin Szeged to 1.0Kin Vienna, from0.9K in Szeged to 1.4KinKraków,andfrom0.8KinViennato1.9KinBrno (while in Kraków: 1.5K and2.7K),respectively. In thecaseof thecities
studied, land use/land cover of rural areas is much less diversi- fiedthanthat ofurbanonesbutitistheopposite withtherelief (Fig.2),andthatisthereasonforthedifferenceinmedianvalues mentionedabove.
At 4:00, in the case of urbanized areas (LCZ 1–10), the me- dianrangewasmuchlargerinBratislava(4.1K),Brno(2.6K),and Kraków (2.9K) than in Vienna (0.6K) and Szeged (2.0K). In the ruralareas(LCZ A–G), the medianrangeinBratislava (5.2K)was much larger than in the remaining cities (from 1.4K in Brno to 2.4KinViennaandSzeged).InKraków,similarlytothesituationat 22.00,thethermalconditionswerestillmorediversifiedinurban- izedareas than innon-urbanizedones andthe samepatternoc- curredinBrno,whileinother citiesitwastheopposite.At04.00, the intra-class variability of air temperature, i.e. large tempera- turedifferenceswithin particular LCZs, reachedmaximum values ofabout5KinBratislava,andthosewerethehighestvaluesfrom allhoursinallcitiescompared.
Figs. 9 and 10 show the share of a city’s area belonging to a particularLCZ withair temperatureexceeding 25°C and30°C;
Fig. 10. Share of the domain areas (with division to LCZs) in particular cities with modelled air temperature ≥25 °C on 8th August at 10.00, ≥35 °C at 16.00, ≥30 °C at 22.00 and ≥20 °C on 9th August at 4.00. For explanations see App. B and Fig. 4 .
for04.00 thethreshold 20°C wasused additionally. At 22:00, in allcitiesandinall LCZsthat thresholdof25°Chadalreadybeen reachedallovertheirarea, withtheexceptionofLCZAinVienna where13.8%oftheareahadalowerairtemperature.Thethreshold of30°CwasexceededinSzegedin97–100%oftheareasbelonging toLCZs1–10 whileinruralareastheshareincreasedfromabout 2.1%inLCZAtoabout90.3%inLCZD.Inothercities,theairtem- peratureexceeded30°ConlyinthecaseofLCZFinKraków(10.1%
ofthezonearea)andVienna(1.2%).At16:00,inallthecities,the thresholdof30°Cwasexceededallovertheirareasandatempera- tureabove35°Coccurredin43.1%oftheareainBratislava,4.9%in Brno,8.0%inKraków,45.2%inVienna,and20%inSzeged.InBrno, Kraków,andSzeged,sucha highairtemperatureoccurredalmost exclusivelyinurbanizedareas,butinBratislavaandViennaquitea largesharebelongedtonon-urbanizedareas.At22:00,thethresh- old of 25°C was exceeded in all the cities all over their areas, butthere were three exceptions, i.e.LCZs areas where the share wasbelow 90%: LCZDinVienna(89.1%) andSzeged (84.6%)and LCZGinBrno(87.8%).However,amoreimportantissueistheoc- currence ofair temperatures above 30°C, in spite of such a late hour,aswasnotedin63.5%oftheareainBratislava,8.1%inBrno, 12.1%inKraków,21.6%inViennaand19.8%inSzeged. Sohighair temperaturewaspredictedbythemodelmainlyforurbanizedar- eas.There are no regularities common for all cities. In the case ofnon-built-up areas(LCZ A–G), theshare ofarea with airtem- peratureexceeding 30°CismuchlargerinBratislava(28.4–88.6%) thaninothercities(0.1–52.4%).Therearetwomajorfactorswhich areresponsibleforthehighervalues:1)theelevated anddensely forestedmountainareain thenorthernpart oftheBratislava do- mainisgenerallyorientedtothesouth.Othercitiesarelocatedei- therinflatterareas(likeSzeged)ortheirareaismuchmorecom- plex(in the caseofBrno); 2) landcover classesinBratislava are quitespecific(seeFig.2a).LCZAisoftenorientedtothesouth(as
mentionedabove),andparallel,largeareasofLCZEcanbe found mainlyinthesouthernpart.Theratiooftheseclassesis,incom- parisonwithothercities,significantlyhigher.Additionally,LCZA-G arerelatively closetobuilt-upareasandmaybe moreinfluenced by UHI than are remote non-urbanized areasof other cities. The presenceofheavy industry mainlyintheSE partofthecitymay influence the temperature in surrounding rural areas aswell. At 4:00,airtemperaturedidnotexceedthethresholdof30°Cinany city,butthethresholdof25°CwasexceededinBratislava,Kraków, andVienna.In Krakówit wasmainlyinLCZ2 (26.5%ofthe area with that LCZ type).In Vienna, airtemperature wasabove 25°C mainlyinLCZE(7.3%ofthearea)andin6(5.2%).Incomparisonto thosetwocities,Bratislavaisacity withamuchlargerheat load.
Inurbanizedareas,thethresholdof25°CwasexceededinLCZ5, 6,8,and9(4.8%to21.2%)andinruralareasinallLCZs exceptG (2.2%to46.3%).ThethresholdwasnotexceededinanycityinLCZs 1, 4, 7,and G. As already mentioned, it was a so-called tropical nightandairtemperature wasabove 20°C ineach city andeach LCZ.Theshareofareaofthedomainwiththatthresholdexceeded was73.9%in Bratislava,77.6% inBrno,85.1% inKraków, 65.3%in Szeged,and100%inVienna.
Fig.11showsmeanmodeledairtemperatureforpixelsbelong- ingtoLCZ5(i.e.open mid-rise)andlocatedatdifferentaltitudes.
At 10:00, the differenceswere from 0.7in Kraków to 2.2 in Vi- enna.At 16:00, theyreached about2K inall cities,whichshows the contribution of concave landforms to higher heat loadcom- paredwiththeconvexlandforms.At22:00,temperatureinversion canbeobservedintheairstratumfromthevalleyfloorupto50m aboveitinBratislava,Brno,andKraków,whilehigherup temper- ature decreases withhigheraltitude. At 4:00, inBratislava, Brno, andKraków,inLCZ5theinversion inthestratum of50m above thevalley floorintensifiedcomparing to22.00,whileinViennaa slightairtemperaturedecreaseinthewholeprofilewasobserved.
A. Bokwa, J. Geleti ˇc and M. Lehnert et al. / Energy & Buildings 201 (2019) 53–69 65
Fig. 11. Mean modelled air temperature for LCZ5 at different altitude in particular cities (Szeged is not included due to low altitude variability) on 8th August at 10.00, 16.0 0, 22.0 0 and 9th August 4.0 0 CEST. For explanations see App. B and Fig. 4 .
5. Discussionandconclusion
The analyzespresentedaboveshow thattheheat loadpattern (as defined in Section 3.4) varied among the cities studied. The medianrangeisanindexthatindicatesthedegree ofairtemper- aturespatialvariabilityandinthepresentstudyitshowedsignifi- cantdifferencesamongthefivecities.InBratislava medianranges forparticularhoursdifferalot,bothinurban(from0.7Kat10.00 to 4.1K at04.00) and ruralLCZs (from 1.8Kat 22.00 to 5.2K at 04.00).Thisisaunitedeffectofboththemodelperformance(i.e.
underestimationofthetemperatureintheeasternmostpartofthe city)and theimpact ofthe relief;accordingtothe measurement datausedtovalidatethemodel,therecanbeadifferenceofabout 3°CinairtemperaturebetweentwostationsinthesameLCZtype, butwithdifferentrelativealtitudes.Thereisapossibilitythatitis aresultoftheinfluenceoftheneighboringLCZs.Someoftheme- teorologicalstations usedforvalidationare placedalong themo- torway network and usually belong to LCZ class E (bare rock or paved). However this class is usually represented by narrow and longareasandthereforetheinfluenceoftheneighborhoodshould not be omitted.The leastdifferentiated medianranges are those forViennainthecaseofurbanones(from0.6Kat04.00to1.2Kat 16.00)andthoseforKrakówforruralones(from1.6Kat04.00to 1.9Kat16.00).ExceptinVienna,theairtemperaturerangesinpar- ticularLCZs havea tendencytoincrease frommorning tillnight- time. At 22.00 and 4.00, in Bratislava, Brno, and Kraków, there arealarge numberofoutlierairtemperaturevaluesformostLCZ types (Fig. 8) which can be linked to the airtemperature inver-
sions; insuch situationsareas belongingtothe sameLCZ canbe locatede.g. underorabove theinversionlayer, andthe reliefim- pactwillbe decisive inthe formationof an airtemperaturepat- tern.At10.00,thethresholdof30°Cwasexceededpracticallyonly inSzegedandforthathourSzegedcanbeconsideredthecitywith the largestheat load, asin many urban LCZs (1–10)the median valueswerethelargestcomparedwithothercities.Themainrea- sonmaybethesouthernmostlocationofSzegedincomparisonto othercitiesstudied.Followingthe criterionofthelargestnumber ofurbanLCZtypeswiththehighestmedianvalues,at16.00,both Szeged andBratislava seem to haveexperienced comparable lev- els of heat load, larger than the other cities; at22.00 those are BratislavaandKraków,whileat4.00itisVienna.Regardingurban LCZswiththehighestheatload,LCZ2and3havethehighestme- dianvaluesinmostcitiesfrom16.00to4.00,whileat10.00there is no such clear patternand in each city a differentLCZ can be considered astheone which experiences thehighestairtemper- ature.Also takinginto considerationthe percentage ofLCZ areas withan airtemperature above 30°C at 22.00 (asat other hours that criteriondoesnot show differencesamongthe cities),LCZ 2 istheonewiththehighestheatload. LCZ9,onthecontrary,can be considered the one with the lowest heat load as regards the medianvalues.
Theresults indicatethat inthe caseofthe citiesstudied, UHI needs to be considered as an element of a complicated spatial patternofairtemperaturewhich seemsto be substantiallyinflu- enced by processes generated by the surrounding landforms, as suggested in earlier empirical studies (e.g. [10]). The intra-zonal
and inter-zonal variability of air temperatures, and in particular LCZs,islargelythesameincitieswithasimilartypeofrelief,i.e.in BrnoandKraków,whichare surroundedby hillsandinBratislava andViennawhichhavesome hillsonone sidebutan openwide valleyon theother one.Szeged, onthe contrary,islocated inan area with little diversified relief, so there are no katabatic flows orcold air reservoirs beingformed during thenight. On theba- sisofthemodelsimulation results,itcanbe summarizedthat in themorning(forenoon)hoursofahotdayduringaheatwave,un- shadedopen localities (particularlyLCZDorLCZ F) arerelatively warmer than other LCZs as well as localities with open low or mid-risedevelopmentwith a highpercentageof impervious sur- facefraction(particularlyLCZ10).Thispatternofairtemperature intheforenoonagreedwellwithalandsurfacetemperaturediffer- entiationofLCZs[18].Intheafternoon,theairtemperaturepattern withthehighestvaluesindenselybuilt-upareas(esp.LCZ2,LCZ 3,LCZ8andLCZ10)wasformed.ParticularlyinBrno,Kraków,and Szegedthispatterngenerallylasteduntil04.00.Simulatednoctur- nal air temperaturedifferences among LCZs particularlyin Brno, Kraków,andSzeged correspondgenerallywell withthoseempir- ically measured in those [33,34] and other cities (e.g. [1,32]). In ViennaandBratislava,mostprobablythelocalcirculationpatterns substantially influenced results. Consequently, nocturnal air tem- peraturedifferencesamongLCZswerelowerthanintheafternoon regardless ofthe fact that afternoon temperature differencesbe- tweenparticulartypesofLU/LC(LCZs)areusuallylesspronounced asairismixedowingtothewell-developedturbulence[40,41,56]. It should be noted, however, that during the nocturnal cooling, simulationsoftheMUKLIMO_3aregenerallylessaccurate[19,20]. Additionally,some microclimatic effects (e.g. connected withthe pre-heatingofthebuildingsonprecedingdays)cannotbeincluded intheanalyzes,owingtothemodellimitations.
The modeling of spatialpatternsof urban climateand valida- tionofmodelresultsisone ofthemainchallengesincontempo- rary urban climate research. Our attempt to model spatiotempo- ral patterns ofair temperatureduring the2015 heat wave event infiveCentralEuropeancitiesshowedthatMUKLIMO_3isableto properlysimulatethemainfeaturesofthetemperaturepatternin urban areas. The accuracy of models based on RANS, where the entire turbulence spectrum is parameterized, is limited, but the modelwasable toprovide accurate andvaluableinformation for manypurposes.Nevertheless,anyfurtherapplicationofthemodel to cities worldwideis limited by input dataand their validation availability[20],andinsufficientvalidationofmodelresultsisone of the major problems of urban climate modeling [43]. For in- stance,inthecaseofLU/LCdataweuniformlyusedtheLCZcon- cept, however the non-uniform quality of data entering the LCZ classification,the chosen classification algorithmitself, orthe se- lectionoftrainingareas could affected theresults [17,66].There- foreinagreementwithHammerbergetal.[25]we encouragethe scientific community to work on the unification of geodatabases forurban areas for RANS-based modeling, witha preference for higheraccuracy.
The results of the analyzes presented showed the occurrence ofveryhightemperaturesparticularlyindenselyurbanizedareas, andtheyshouldbeincludedinurbanspatialplanningprocedures.
ThespatialvariabilityofairtemperatureinparticularLCZs shows thatthereisnosimpleconnectionbetweenLU/LCandairtemper- ature,andthe localimpact ofrelief hasto be takeninto consid- eration;e.g.thehighestdaytime airtemperaturesoccurinvalley floors.The role of greenareas inthe modification ofairtemper- atureinurbanareasiscomplex,too;open greenareaswithlittle shadecancontribute tothegeneration ofrelativelyhighairtem- peraturewhileforestedareasexperiencerelativelylowertempera- tures.Togetadeeperunderstandingoftheinfluenceofthosefac- tors,further work on the refinementof modeloutputs andtheir
validation is necessary. Only accurate information on the factors affectingthe urbanclimatewill leadto well-tailoredmeasures to mitigatethermalstress andreduceits healthimpact inurban ar- eas.
Conflictofinterest None
Acknowledgements
The results presented in the paper were partially obtained within the project “Urban climate in Central European cities and global climate change” which has been realized within the framework ofthe InternationalVisegradFund Standard Grantno.
21410222intheyears2014–2015.J.Holec,P.Šťastný andM.Garaj wanttoacknowledgetheproject"Effectofimpermeablesoilcover on urban climate in the context of climate change" supported by Slovak Research and Development Agency under contract no.
APVV-15-0136. Thisstudy wassupported by the Ministryof Hu- manCapacities,Hungary grant20391-3/2018/FEKUSTRAT.N.Skar- bit andT. Gál were supported by NKFI 120346. M.Žuvela-Aloise andB. Hollósi wantto acknowledge Austrian Federal Ministry of Education,ScienceandResearch.
AppendixA
Mean annual air temperature (T)and precipitation (P) in the citiesstudiedintheperiod1971–2000
City Station name
WMO ID Altitude [m a.s.l.]
Coordinates T ( °C) P (mm)
Bratislava Bratislava- Ivanka
11816 142 48.18 °N, 17.20 °E
10.1 557 Brno Brno/
Tu ˇrany
11723 246 49.15 °N, 16.68 °E
9.0 479 Kraków Kraków 12566 237 50.06 °N,
19.78 °E
8.1 667 Szeged Szeged 12982 83 46.25 °N,
20.08 °E 10.6 499 Vienna Wien/Hohe-
Warte
11035 209 48.25 °N, 16.37 °E
10.2 615 Source of data: NOAA/NCEI GHCN data base.
AppendixB
Parameters for land cover properties in MUKLIMO_3 model:
fractionofbuiltarea(
γ
b),meanbuildingheight(hb),wallareain- dex(wb), fractionof pavementofthe non-built area (v),fraction oftreecover(σ
t) andfractionoflowvegetationoftheremainingsurface(
σ
c),treeheight(ht)andheightofthelowvegetation(hc).Fractions
γ
b andσ
t are relative to the total grid cell area. Frac- tionvisrelativetotheareawithoutbuildingsandtreesandσ
cisrelativetotheremainingsurface.
Local Climate
Zones γb
(%)
h b(m) w b V (%) σt
(%) σc
(%) h t
(m) h c
(m) 1 Compact
high-rise
0.60 25.00 6.67 1.00 0.00 0.90 0.0 0.10 2 Compact
midrise
0.45 16.50 3.42 0.70 0.00 0.90 0.0 0.10 3 Compact
low-rise 0.45 9.20 2.40 0.40 0.00 0.80 0.0 0.10 4 Open high-rise 0.30 25.00 7.00 0.20 0.00 0.60 0.0 0.10 5 Open midrise 0.30 18.60 4.40 0.45 0.00 0.80 0.0 0.10 6 Open low-rise 0.30 6.50 2.10 0.40 0.00 0.70 0.0 0.10
( continued on next page )

![Fig. 3. a) Taylor diagram [59] for hourly air temperature (at 2 m) during the heatwave period (4–14th August) in 2015](https://thumb-eu.123doks.com/thumbv2/9dokorg/1285368.102721/4.892.83.801.763.1052/fig-taylor-diagram-hourly-temperature-heatwave-period-august.webp)