CORVINUS UNIVERSITY OF BUDAPEST
DOCTORAL THESES
ZSUZSANNA DEÁK
CORPORATE ENVIRONMENTAL RESPONSIBILITY AND THE CAPITAL MARKETS
Budapest 2012
2
The Council of the Life-sciences Doctoral School of the Corvinus University of Budapest has appointed the following Board of Review on December the 4th, 2012:
REVIEW BOARD:
Chairman:
Dr. Csaba Forgács
Members:
Dr. Gyula Zilahy Dr. Mária Csete Dr. Éva Erdélyi Dr. Szabóné Dr. Mária Fekete Dr. Farkasné
Opponents:
Dr. Szilárd Podruzsik Dr. István Kapronczai
Secretary:
Dr. Karolina Kajári
3
Doctoral School:
CORVINUS UNIVERSITY OF BUDAPEST
Landscape Architecture and Landscape Ecology (Landscape Architecture Environmental Modeling)
Field: Agro-technical
Head of PhD School: Prof. Attila Csemez, DSc.
CORVINUS UNIVERSITY OF BUDAPEST Faculty of Landscape Architecture
Dept. of Landscape Planning and Regional Development
Supervisor: Dr. habil. Hajdu Istvánné, Csc.
CORVINUS UNIVERSITY OF BUDAPEST Faculty of Food Science
Department of Food Economy
The applicant met the requirements of the PhD regulations of the Corvinus University of Budapest and the theses are accepted for the defense process.
Head of Ph.D. School Supervisor
4
TABLE OF CONTENTS
1 BACKGROUND AND AIM OF RESEARCH ...5
1.1 Research Background... 5
1.2 Aim of Research ... 7
1.3 Research Hypotheses ... 7
2 SAMPLE AND METHODOLOGY ...8
3 RESULTS ...9
3.1 Cross-sectional Analysis ... 9
3.1.1 By Type of Environmental News ... 9
3.1.2 By Company Specific Variables ... 11
3.2 Longitudinal Analysis ...13
3.2.1 Trend analysis ... 13
3.2.2 Analysis of Stochastic Population Similarity ... 13
3.3 Verification of Hypotheses ...16
3.4 Novel Scientific Results ...17
4 CONCLUSIONS AND PROPOSALS ... 18
4.1 Conclusions and Proposals from the Analysis of the Type of Environmental Events ...18
4.2 Conclusions and Proposals from the Analysis of Company Specific Variables ...18
4.3 Conclusions and Proposals from the Longitudinal Analysis ...19
5 SCIENTIFIC PUBLICATIONS ... 20
5 1 BACKGROUND AND AIM OF RESEARCH 1.1 Research Background
In the nineteenth century the basic focus was on the most efficient and fastest utilization of our natural resources in order to increase profitability. By the twentieth century, however, it became clear that the current rate of utilization will result in unsustainable social and economic development. As a result, the role of appropriate state regulations, socially responsible management and their effects on profitability has become the topic of discussion. The philosophy of sustainable development gave birth to quite an extensive literature, but does the market reward, and if yes, to what extent such behavior. Does it pay to be green?
Environmental regulation has been around for many years, but it is a generally accepted fact that its beneficial effects on environmental pollution is not effective (DASGUPTA & LAPLANTE 2001, ZSÓKA et al. 2005). Since the “command-and-control” approach seems to have failed many times, in recent years so called “market-based instruments” to enforce regulations have emerged (environmental taxes, tradable permits, etc.). One such instrument, considered by many economists as the most efficient, is the “information-based regulation” that relies partly on the investor community for monitoring and enforcing environment-friendly behavior (KONAR &
COHEN 1997, TIETENBERG 1998, BARON 2001). In this context information takes on a new role, and can create incentives for companies to adopt a more environment-friendly behavior.
In the first phase of my research I was reviewing the general concepts of environmental protectionism and sustainability, and the history of research in these topics. There emerged two seemingly competing views in economics: for some investing in environmentally sound operations is merely extra cost, for others it is a competitive advantage. In recent times articles published in the corporate social responsibility topic- especially those focusing on the financial benefits of CSR- researchers urged a more holistic approach to the subject matter (MAROM 2006, GARCIA-CASTRO et al. 2010, SCHRECK 2011). According to this, a socially responsible management practice does not preclude profitability, but it is essential to know who conducts what kind of CSR activity and when, that is the financial benefit of the acticvity greatly depends on the company’s then existing situation.
In the second part of my study I was focusing on socially responsible investing (SRI). There were major changes in this area in the last decade. After the initial attempts of non-profit groups to evaluate firms’ CSR performance, the issue was taken on by investment funds who have optimized and standardized these efforts. The advancement of information technology and the growing role of media have played essential roles in popularizing the causes of environmentalism and sustainability. Without them the information-based regulation could not have worked efficiently. Of course, for the ethical mutual funds to have survived, they have to have shown positive financial performance. A firm’s financial success is often measured by its stock market performance. In measuring a company’s social performance investors are looking at three measurements: social, governance and environmental (ESG) aspects. From these three pillars in my research I am focusing on the environmental aspect.
Reviewing the topic of sustainable production and consumption the role of food industry had to have emerged. Research done by both the UN and the EU has been increasingly focusing on the effects of the food sector on our environment (ETC/SCP 2009 and 2011). Despite of this, reviewing the international and Hungarian literature has uncovered relatively few articles dealing
6
with the study of the relationship between environmental and financial performance in the industry. Several scientists working in the CSR field has recognized that considering the importance of the food industry, this research topic would require greater attention (BARNETT 2007, HARTMANN 2011). Food is primarily a staple, and a sufficient and safe food supply is at least as important for national security as energy independence. Besides this, food production is not only influencing our environment but to a great deal also dependent upon it. In the next step, therefore, I have evaluated the major global trends shaping the agro-food sector (healthy consumption, food safety and quality, sustainability etc.), since these challenges are not only affecting financial profitability but also the image and long-term viability of the industry.
In the next step of the literature review I have described the direction, methodology and results of the prior researches discussing the relationship between financial and environmental performance. I have introduced the benefits and drawbacks of the three methodologies most frequently used to demonstrate correlation between financial and non-financial company results (the event study, the accounting based firm valuation model and the portfolio analysis) and have shown the econometric methods used to analyze financial time series data. Several studies have dealt with the analysis of market reactions to both positive and negative environmental news (HAMILTON 1995, GILLEY et al. 2000, KONAR & COHEN 2001, KING & LENOX 2002, KARPOFF et al. 2005). Even though, in general, it has been found that companies experience a drop (increase) in their market value following adverse (favorable) environmental news, empirical findings are by no means homogenous. This level of heterogeneity in results could only be explained by differences coming from various industry aspects, company specific variables and the different timing of the studies (CHAND 2006, CORMIER & MAGNAN 2007, WAGNER 2010).
Based on the above, in my dissertation I am investigating the environmental performance of the food industry as proxied by the news items published in the media and their corresponding effects on the stock market with special emphasis on certain financial and non-financial variables and the development of stock market reactions in the last twenty years. By choosing the subject (food industry) and the time frame (last two decades) of the investigation I was aiming to fill a gap observed in the international literature reviewed and to uncover those complex interactions that can influence market reactions to environmental news. The object of my research is to discover which environmental events generate significant stock market reactions, which firm- level variables might influence these reactions, and whether or not these reactions have varied with the changing of time.
7 1.2 Aim of Research
My research is proceeding in two main directions, a cross-sectional and a longitudinal analysis, and within that I phrased three main research questions.
In the first part of the cross-sectional analysis I wanted to find out if the stock market reacts to all company related environmental news equally. Whether the negative types of events such as government interventions and lawsuits; or the pro-active, positive company initiated actions play a more prominent role. Do the negative, discrediting campaigns by environmental activist, or the green rankings issued by investment firms receive more attention?
In the second part of the cross-sectional analysis I was aiming to discover which firm-level variables might affect market decisions. There are several financial variables, such as size, profitability, indebtedness or market riskiness that can influence investor decisions. Besides the financial figures, it was also important to look at the companies’ environmental reputation. Here I have investigated two non-financial variable, media coverage and company green score.
My third research question was focusing on the change in reactions to environmental news items on the stock market. The question of environmental protectionism and sustainability has advanced significantly in the last two decades. On the one hand, publicity of the topic has been growing; on the other hand the question itself has also gained a much more positive view. The role of food production and consumption in sustainability has also become more obvious. These transformations could all significantly affect market reactions. Therefore, I have analyzed market reactions to food companies’ environmental news items in the last twenty years.
During my research I have collected and analyzed the market, financial and media figures of twenty-three large multinational food companies. In the statistical evaluation I was aided by the fact that researchers have adapted the more sophisticated methods developed in the financial investment literature to the environmental topic. Therefore, in my study I have utilized the GARCH method which accounts for the specific behavior of financial time-series.
1.3 Research Hypotheses
H1: Markets do not react to all types of environmental news equally. It could be expected that the markets may not react at all to some news categories as they are not perceived to be value creating/destroying.
H2: Various financial indicators, such as size, profitability or risk would influence market reactions. It is to be expected, for example, that stock prices of smaller, less profitable firms would have a more pronounced reactions.
H3: The level of media coverage could influence market reactions. It is to be expected that companies with a lower frequency of appearance in publications would have stronger market reactions than firms with continued media attention
H4: Market reaction could also depend on the firm's environmental reputation. It is to be expected that good environmental reputation would shelter companies from market reactions in response to negative events.
8
H5: Market reactions could change as a function of time. It is to be expected that with the increased importance of environmentalism and the growing role of publicity market reactions have become more differentiated.
2 SAMPLE AND METHODOLOGY
A database of multinational food companies was assembled with the help of Dunn&Bradstreet and Hoover services. Stock prices of companies from 33 various food industry segments with sales over 1 million USD that were traded on the New York Stock Exchange (NYSE) and NASDAQ between the periods of January 1990 and December 2010 were collected.
The study excludes all alcoholic and tobacco related products as they would skew the results due to reputational preconceptions.
Environmental news items were downloaded from the Wall Street Journal Factiva database.
After purging the data of duplications, overlaps and other disturbances I have gained a sample of twenty-three companies with 880 usable environmental events.
To calculate the dependent variable, that is abnormal returns, I needed the company stock prices going back for twenty years and a broad-based stock index to proxy for the market portfolio (in this case the Standard and Poor’s 500).
To distinguish the effect of specific events, the news sample is first divided, a priori, into positive and negative events and then to external and internal events based on whether the event was the result of actions initiated by the companies themselves or opinions and actions of third party observers. Thus I have received the following four subcategories:
Event type 1 (E1): News relating to penalties, government action, lawsuits etc. against the companies.
Event type 2 (E2): Actions taken by the companies to improve environmental performance or perception.
Event type 3 (E3): Awards, rankings issued by an outside source about the company
Event type 4 (E4): Other external non-classifiable negative events (boycotts, external company reports and studies etc.)
For the firm-level variables (financial ratios, media coverage and reputational rating), due to the availability and volatility of data, only a subset of the last four years was used (2007-2010).
Therefore, for the cross-sectional analysis I had 526 environmental events available.
Based on the literature review, the financial variables I have utilized were size (assets, A), profitability (return on equity, ROE), riskiness (beta, B), and leverage (long-term debt to equity, LEV). For company media coverage (COV), I have looked at the number of articles related to environmental issues published in the printed media. For environmental reputation (REP) I have computed an average environmental „green score” (based on a scale of 1-100).
To attain satisfactory answers to my three research questions I had to utilize somewhat differing econometric approaches, although they were all based on the calculation of 3-day average abnormal returns in the framework of GARCH (1, 1) regression equations. To compute an average result for all companies the coefficients gained from the equations had to be
9
combined. For this purpose, I have employed the methodology developed by SAVICKAS (2003) and later also utilized by JUNKER (2005).
Since using a single regression equation with dummy variables for the longitudinal analysis could produce misleading results, I had to employ a different approach. For the empirical analysis I have created a graphical representation of the four portfolios from the development of the 3-day CARs gained from the GARCH model for each event type for the twenty-year span examined to visualize the various trends and thus create suitable time periods to be compared. To determine whether or not the time intervals thus created are significantly different the group medians were assessed with a Kruskal-Wallis test. Consequently, a post-hoc Mann-Whitney pair-wise comparison was performed on the CARs gained from the portfolios. Because of the large number of pair wise comparisons there is an increased chance of committing a Type I error.
Therefore, I had to run the analysis in a Bonferroni corrected and uncorrected form.
3 RESULTS
3.1 Cross-sectional Analysis
With the cross-sectional analysis my primary aim was to investigate the market reactions to the four event types and the effect of the company-level variables on these reactions.
3.1.1 By Type of Environmental News
In the first step, I have analyzed market reactions to the various environmental event types.
The most news items were published in the two positive categories. As it could be expected, the companies put greater effort into covering up unfavorable news, while supporting and are themselves reporting more frequently events that are helpful in creating a positive image.
First, I have calculated the average abnormal return for all companies. The three day cumulated average abnormal return (CAR) for the four event types of all food companies examined can be seen in Table 1.
Table 1. Cumulated Average Abnormal Returns by Event Types and their Significance (N=23)
E1 E2 E3 E4
CAR -1.0431 1.0539 0.1154 -0.2605
t stat -3.96*** 4.38*** 0.87 -1.04
Note: ***, **, and * denote significance at the 1%, 5% and 10% respectively (one-tailed test).
The E2 and E3 type events generated positive reactions while the E1 and E4 types negative ones. Third party reports or actions, be that positive or negative, have not generated significant results. The E2 type, company initiated environmental improvement actions, on the other hand, produced significantly positive abnormal returns (have increased company value on average by 1.05 %). Those events that can have actual adverse monetary consequences, such as non- compliance or lawsuits (E1), have on average decreased company value by -1.04%. The various other third party exposés, boycotts etc., do not seem to be relevant events in the eyes of the investors.
10
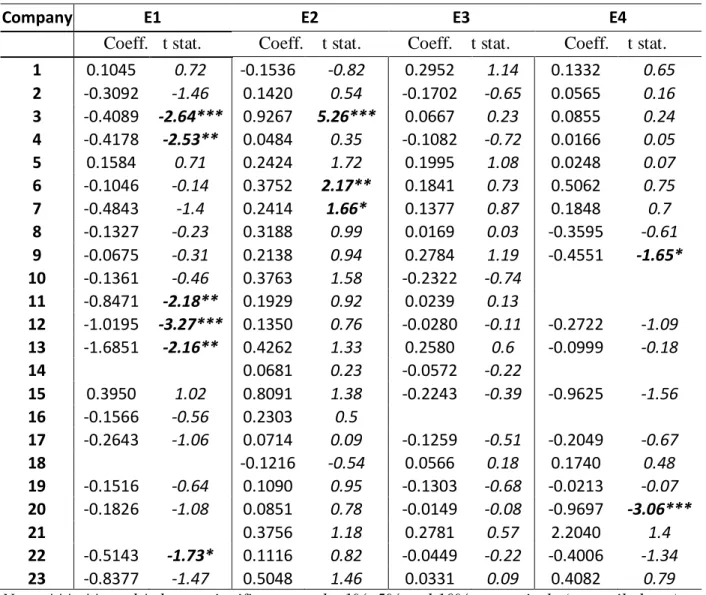
In the second stage the companies were examined one by one. The detailed abnormal returns by company can be seen in Table 2.
Table 2. Cumulated Abnormal Returns by Company and their Significance
Company E1 E2 E3 E4
Coeff. t stat. Coeff. t stat. Coeff. t stat. Coeff. t stat.
1 0.1045 0.72 -0.1536 -0.82 0.2952 1.14 0.1332 0.65 2 -0.3092 -1.46 0.1420 0.54 -0.1702 -0.65 0.0565 0.16 3 -0.4089 -2.64*** 0.9267 5.26*** 0.0667 0.23 0.0855 0.24 4 -0.4178 -2.53** 0.0484 0.35 -0.1082 -0.72 0.0166 0.05 5 0.1584 0.71 0.2424 1.72 0.1995 1.08 0.0248 0.07 6 -0.1046 -0.14 0.3752 2.17** 0.1841 0.73 0.5062 0.75 7 -0.4843 -1.4 0.2414 1.66* 0.1377 0.87 0.1848 0.7 8 -0.1327 -0.23 0.3188 0.99 0.0169 0.03 -0.3595 -0.61 9 -0.0675 -0.31 0.2138 0.94 0.2784 1.19 -0.4551 -1.65*
10 -0.1361 -0.46 0.3763 1.58 -0.2322 -0.74 11 -0.8471 -2.18** 0.1929 0.92 0.0239 0.13
12 -1.0195 -3.27*** 0.1350 0.76 -0.0280 -0.11 -0.2722 -1.09 13 -1.6851 -2.16** 0.4262 1.33 0.2580 0.6 -0.0999 -0.18
14 0.0681 0.23 -0.0572 -0.22
15 0.3950 1.02 0.8091 1.38 -0.2243 -0.39 -0.9625 -1.56 16 -0.1566 -0.56 0.2303 0.5
17 -0.2643 -1.06 0.0714 0.09 -0.1259 -0.51 -0.2049 -0.67
18 -0.1216 -0.54 0.0566 0.18 0.1740 0.48
19 -0.1516 -0.64 0.1090 0.95 -0.1303 -0.68 -0.0213 -0.07 20 -0.1826 -1.08 0.0851 0.78 -0.0149 -0.08 -0.9697 -3.06***
21 0.3756 1.18 0.2781 0.57 2.2040 1.4
22 -0.5143 -1.73* 0.1116 0.82 -0.0449 -0.22 -0.4006 -1.34 23 -0.8377 -1.47 0.5048 1.46 0.0331 0.09 0.4082 0.79 Note: ***, **, and * denote significance at the 1%, 5% and 10% respectively (one-tailed test).
As we can see from the above, market reactions are by no means homogeneous. Although the aggregate CAR for the E1 and E2 type events was quite convincing, this results is not always reflected on the individual company level. Out of the twenty-three companies examined only six had significantly negative reactions to E1 type events and four significantly positive ones for E2 type events. On the other hand, we can also see two significantly negative reactions to E4 events which were not visible in the aggregated number. The E3 type events did not generate significant reactions even in their disaggregated form. We can also find some explanation as to why the E1 and E2 events became robustly positive or negative when combined while the E3 and E4 events did not. While the sign of the CARs in response to news generated by internal actions almost always agree, only half of the third party news items elicit reactions in the expected direction.
11 3.1.2 By Company Specific Variables
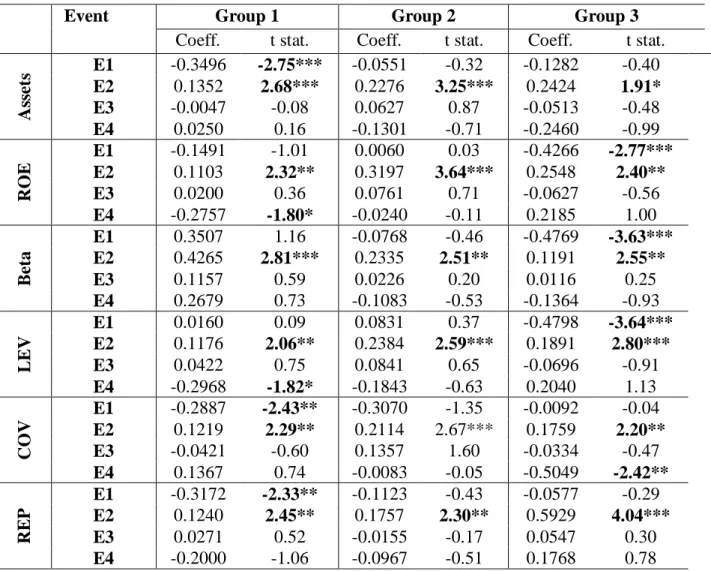
After determining that market reactions were varying by event types but at the same time also different on company level, in the next step, I examined the effect of firm level variables on abnormal returns. The results of the 18 regressions can be seen in Table 3:
Table 3. The Effects of Firm-level Variables on Abnormal Returns
Event Group 1 Group 2 Group 3
Coeff. t stat. Coeff. t stat. Coeff. t stat.
Assets E1 -0.3496 -2.75*** -0.0551 -0.32 -0.1282 -0.40
E2 0.1352 2.68*** 0.2276 3.25*** 0.2424 1.91*
E3 -0.0047 -0.08 0.0627 0.87 -0.0513 -0.48
E4 0.0250 0.16 -0.1301 -0.71 -0.2460 -0.99
ROE
E1 -0.1491 -1.01 0.0060 0.03 -0.4266 -2.77***
E2 0.1103 2.32** 0.3197 3.64*** 0.2548 2.40**
E3 0.0200 0.36 0.0761 0.71 -0.0627 -0.56
E4 -0.2757 -1.80* -0.0240 -0.11 0.2185 1.00
Beta
E1 0.3507 1.16 -0.0768 -0.46 -0.4769 -3.63***
E2 0.4265 2.81*** 0.2335 2.51** 0.1191 2.55**
E3 0.1157 0.59 0.0226 0.20 0.0116 0.25
E4 0.2679 0.73 -0.1083 -0.53 -0.1364 -0.93
LEV
E1 0.0160 0.09 0.0831 0.37 -0.4798 -3.64***
E2 0.1176 2.06** 0.2384 2.59*** 0.1891 2.80***
E3 0.0422 0.75 0.0841 0.65 -0.0696 -0.91
E4 -0.2968 -1.82* -0.1843 -0.63 0.2040 1.13
COV
E1 -0.2887 -2.43** -0.3070 -1.35 -0.0092 -0.04
E2 0.1219 2.29** 0.2114 2.67*** 0.1759 2.20**
E3 -0.0421 -0.60 0.1357 1.60 -0.0334 -0.47
E4 0.1367 0.74 -0.0083 -0.05 -0.5049 -2.42**
REP
E1 -0.3172 -2.33** -0.1123 -0.43 -0.0577 -0.29
E2 0.1240 2.45** 0.1757 2.30** 0.5929 4.04***
E3 0.0271 0.52 -0.0155 -0.17 0.0547 0.30
E4 -0.2000 -1.06 -0.0967 -0.51 0.1768 0.78
Note: ***, **, and * denote significance at the 1%, 5% and 10% respectively (one-tailed test).
3.1.2.1 Analysis of Financial Variables
Similarly to the analysis of event types, in this case also only the E1 and E2 (internal) events have produced usable (significant) results, while third party E3 events not at all and the E4s only on two occasions. Within the financial variables size and profitability, and market risk and indebtedness move together, therefore I present the results for these variables together.
Size and Profitability:
Group 1 contains companies that are greater in size and are more profitable while Group 3 has smaller and less profitable firms. The positive internal events (E2) have generated significant
12
positive market reactions in all three categories. The abnormal returns are greater (around 0.25) for smaller companies than for larger ones (between 0.11 and 0.13) showing that investors reward smaller companies to a greater extent for their positive environmental efforts. The positive external events (E3) do not elicit any reaction from the market. The unfavorable internal events (E1) create significant negative reactions in case of the larger and less profitable firms.
Since the more prominent companies are more frequently in the center of attention they have to face larger penalties and besides the investors and market analysts are also regularly focusing on them.
Market Risk and Indebtedness:
For the two financial variables measuring riskiness, beta and debt, category 1 includes companies that are less stable, while category 3 includes companies that are less risky and carry less long-term debt. Results for beta are clear-cut. The more volatile, riskier a company is the higher is the reward for positive environmental behavior (E2). In the case of debt ratio, positive environmental news increases stock returns of companies in all categories; however, the trend is the opposite to that of beta: the impact is larger for companies with moderate debt ratio, followed by low- and high-debt companies. This might seem reasonable, if we consider that a great portion of these positive news events involves additional capital outlay by the companies, and investors do not necessarily view this as prudent for firms with already high debt burden. Again, external positive news (E3) has no impact on stock returns. Negative internal events (E1) only decreases stock returns of companies in better conditions; that is, companies with low beta and debt ratio (by about 0.48). Here, investors are obviously penalizing companies in better financial positions, as these negative events are reducing their future expectations for these firms.
3.1.2.2 Analysis of Non-financial Variables
For the non-financial indicators, coverage and reputation, positive internal events (E2) increase stock returns of companies in all categories. The impact is larger for companies with moderate level of media coverage, followed by companies with fewer and more media coverage.
Further, the impact of positive news is smaller for companies with higher environmental reputation and larger for companies with lower reputation. However, positive external events (E3) again do not have any significant impact. Thus, the better the company’s reputation and the more frequently the media covers them, the less financial benefit they can reap from their environmental efforts, at least in the stock market. This corresponds well with the efficient market hypothesis, which asserts that if the event is well anticipated by market participants, then its effects are built into the stock price before the event date. For companies with high media coverage and with good environmental reputation, negative internal events (E1) result in about 0.30 drop in stock returns, as investors are more surprised in these cases.
While specific opinions (positive or negative) of outside parties do not directly seem to influence company stock prices, they undoubtedly do play an important role in influencing the overall reputation of companies, and as we have seen this in turn plays a direct role in how the market reacts to internal company initiatives.
13 3.2 Longitudinal Analysis
My next research topic examines the change of market reactions to environmental news with the passing of time. As part of the investigation, first I have looked at the development of news items by event types through a trend analysis. Subsequently, I have inspected the change in abnormal returns of the four portfolios created from the various event types, so that I can determine the appropriate breaks in time along which I can group the events. Lastly, I have tested the dissimilarity of the time periods thus created by looking at the medians of the cumulated average abnormal returns.
3.2.1 Trend analysis
While the number of negative news items (E1, E4) published leveled off over time, reports relating to positive company events (E2, E3) were growing exponentially. The jump in positive news items can be observed from the first quarter of 2005 (the Kyoto protocol came into force on February 16, 2005). News originating from outside evaluations, both positive and negative, have only appeared regularly in the written media after the year 1999. This reflects two distinct trends:
first the companies have realized the importance of the role of media and are placing greater emphasis on managing their image, and second the non-governmental organizations and investing communities have become increasingly active in monitoring the corporate responsibility and environmental activities of companies’.
The internal company environmental improvement actions, as we have already seen in the cross-sectional analysis, clearly pay off financially. From the scatter graph, it also becomes clear that as there is a continued upward trend in CARs (+0.02%). So the market places an increasing emphasis on these types of events. On the other hand, both negative event type CARs are increasingly less negative (E1 by 0.06% and E4 by 0.08%), that is the companies are penalized to a lesser extent. However, outside rankings, awards and evaluations seem to have lost some of their appeal, as we can see a decreasing trend of 0.4% in cumulated abnormal returns.
We can also notice variances in event dispersion. Although, the average mean deviation, d (X), show a declining trend for all event types, the two positive events (E2 and E3) have decreased to a greater extent (-0,02% and -0,05%) while the two negative types (E1 and E4) basically remained constant (-0,00% and -0,01%). The biggest consolidation can be observed in the E3 type events (positive outside opinions), while reactions to outside negative events (E4) are still quite volatile.
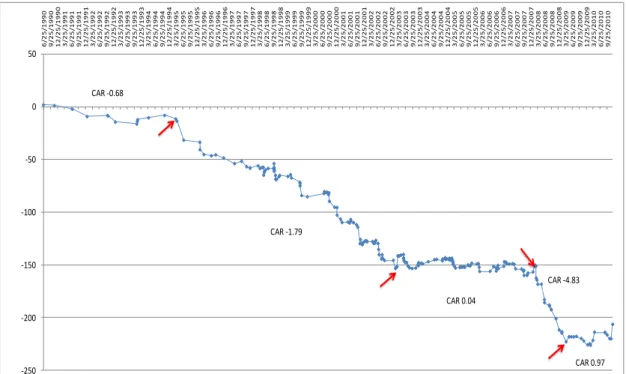
3.2.2 Analysis of Stochastic Population Similarity
For a deeper insight into the long term developments I have created a graphical representation of the four portfolios for the twenty-year span of the abnormal returns per event type (Figs, 1-4). With the help of these graphs, the various trends and breaks in the time line became visible, and thus suitable time-intervals could be created for each event type to be compared. While all event types show a trend in the generally expected direction, E1 and E2 type events are more homogeneous while E3 and E4 are more cyclical. This is one explanation as to
14
why the E3 and E4 events did not generate significant cumulated CARs during the cross- sectional analysis.
Generally speaking the tipping points per event type do not coincide, with some interesting exceptions. In April of 2007, for example, due to a landmark judicial decision in the United States and a crucial IPCC (Intergovernmental Panel on Climate Change) report sentiments toward climate change and the environment improved significantly. As a result, we can see an upward movement in CARs for E2 events and a corresponding dip in CARs for E4 and E1 type events.
-250 -200 -150 -100 -50 0 50 6
/25/1990 9/25/1990 12/25/1990 3/25/1991 6/25/1991 9/25/1991 12/25/1991 3/25/1992 6/25/1992 9/25/1992 12/25/1992 3/25/1993 6/25/1993 9/25/1993 12/25/1993 3/25/1994 6/25/1994 9/25/1994 12/25/1994 3/25/1995 6/25/1995 9/25/1995 12/25/1995 3/25/1996 6/25/1996 9/25/1996 12/25/1996 3/25/1997 6/25/1997 9/25/1997 12/25/1997 3/25/1998 6/25/1998 9/25/1998 12/25/1998 3/25/1999 6/25/1999 9/25/1999 12/25/1999 3/25/2000 6/25/2000 9/25/2000 12/25/2000 3/25/2001 6/25/2001 9/25/2001 12/25/2001 3/25/2002 6/25/2002 9/25/2002 12/25/2002 3/25/2003 6/25/2003 9/25/2003 12/25/2003 3/25/2004 6/25/2004 9/25/2004 12/25/2004 3/25/2005 6/25/2005 9/25/2005 12/25/2005 3/25/2006 6/25/2006 9/25/2006 12/25/2006 3/25/2007 6/25/2007 9/25/2007 12/25/2007 3/25/2008 6/25/2008 9/25/2008 12/25/2008 3/25/2009 6/25/2009 9/25/2009 12/25/2009 3/25/2010 6/25/2010 9/25/2010
CAR -1.79
CAR 0.04
CAR -4.83
CAR 0.97 CAR -0.68
Figure 1. E1 portfolio: Cumulative Average 3-day Returns for E1 Type Negative Internal Events
-50 0 50 100 150 200 250 300
3/20/1990 6/20/1990 9/20/1990 12/20/1990 3/20/1991 6/20/1991 9/20/1991 12/20/1991 3/20/1992 6/20/1992 9/20/1992 12/20/1992 3/20/1993 6/20/1993 9/20/1993 12/20/1993 3/20/1994 6/20/1994 9/20/1994 12/20/1994 3/20/1995 6/20/1995 9/20/1995 12/20/1995 3/20/1996 6/20/1996 9/20/1996 12/20/1996 3/20/1997 6/20/1997 9/20/1997 12/20/1997 3/20/1998 6/20/1998 9/20/1998 12/20/1998 3/20/1999 6/20/1999 9/20/1999 12/20/1999 3/20/2000 6/20/2000 9/20/2000 12/20/2000 3/20/2001 6/20/2001 9/20/2001 12/20/2001 3/20/2002 6/20/2002 9/20/2002 12/20/2002 3/20/2003 6/20/2003 9/20/2003 12/20/2003 3/20/2004 6/20/2004 9/20/2004 12/20/2004 3/20/2005 6/20/2005 9/20/2005 12/20/2005 3/20/2006 6/20/2006 9/20/2006 12/20/2006 3/20/2007 6/20/2007 9/20/2007 12/20/2007 3/20/2008 6/20/2008 9/20/2008 12/20/2008 3/20/2009 6/20/2009 9/20/2009 12/20/2009 3/20/2010 6/20/2010 9/20/2010 12/20/2010
CAR 0.098
CAR 1.04
Figure 2. E2 portfolio: Cumulative Average 3-day Returns for E2 Type Positive Internal Events
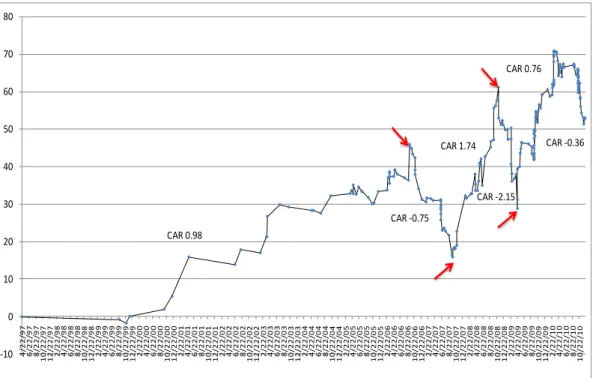
15
-10 0 10 20 30 40 50 60 70 80
4/22/97 6/22/97 8/22/97 10/22/97 12/22/97 2/22/98 4/22/98 6/22/98 8/22/98 10/22/98 12/22/98 2/22/99 4/22/99 6/22/99 8/22/99 10/22/99 12/22/99 2/22/00 4/22/00 6/22/00 8/22/00 10/22/00 12/22/00 2/22/01 4/22/01 6/22/01 8/22/01 10/22/01 12/22/01 2/22/02 4/22/02 6/22/02 8/22/02 10/22/02 12/22/02 2/22/03 4/22/03 6/22/03 8/22/03 10/22/03 12/22/03 2/22/04 4/22/04 6/22/04 8/22/04 10/22/04 12/22/04 2/22/05 4/22/05 6/22/05 8/22/05 10/22/05 12/22/05 2/22/06 4/22/06 6/22/06 8/22/06 10/22/06 12/22/06 2/22/07 4/22/07 6/22/07 8/22/07 10/22/07 12/22/07 2/22/08 4/22/08 6/22/08 8/22/08 10/22/08 12/22/08 2/22/09 4/22/09 6/22/09 8/22/09 10/22/09 12/22/09 2/22/10 4/22/10 6/22/10 8/22/10 10/22/10
CAR -0.75
CAR -2.15 CAR 1.74
CAR 0.76
CAR -0.36
CAR 0.98
Figure 3. E3 portfolio: Cumulative Average 3-day Returns for E3 Type Positive External Events
-70 -60 -50 -40 -30 -20 -10 0 10
3/28/1991 6/28/1991 9/28/1991 12/28/1991 3/28/1992 6/28/1992 9/28/1992 12/28/1992 3/28/1993 6/28/1993 9/28/1993 12/28/1993 3/28/1994 6/28/1994 9/28/1994 12/28/1994 3/28/1995 6/28/1995 9/28/1995 12/28/1995 3/28/1996 6/28/1996 9/28/1996 12/28/1996 3/28/1997 6/28/1997 9/28/1997 12/28/1997 3/28/1998 6/28/1998 9/28/1998 12/28/1998 3/28/1999 6/28/1999 9/28/1999 12/28/1999 3/28/2000 6/28/2000 9/28/2000 12/28/2000 3/28/2001 6/28/2001 9/28/2001 12/28/2001 3/28/2002 6/28/2002 9/28/2002 12/28/2002 3/28/2003 6/28/2003 9/28/2003 12/28/2003 3/28/2004 6/28/2004 9/28/2004 12/28/2004 3/28/2005 6/28/2005 9/28/2005 12/28/2005 3/28/2006 6/28/2006 9/28/2006 12/28/2006 3/28/2007 6/28/2007 9/28/2007 12/28/2007 3/28/2008 6/28/2008 9/28/2008 12/28/2008 3/28/2009 6/28/2009 9/28/2009 12/28/2009 3/28/2010 6/28/2010 9/28/2010
CAR 0.25
CAR -1.85
CAR 0.18 CAR -1.37
Figure 4.E4 portfolio: Cumulative Average 3-day Returns for E4 Type Negative External Events
As it can be seen from the above, the graphical representation was necessary for several reasons. First of all, this way the time periods to be compared were not based on some arbitrary date but were created along visible fault lines. Second, it has become clear that the event types are not developing parallel to each other, but each has a distinct pattern and thus has to be examined separately. To examine the dissimilarity of the groups thus created first a Kruskal- Wallis test was run, followed by a pair-wise comparison of median CARs of the various time intervals (Mann-Whitney test). Based on the Kruskal-Wallis test performed the grouping was relevant for all four event types (p<0.05). Results of the pair-wise comparison, with the exception of E4 type events, remained significant even after the Bonferroni correction, therefore, the chosen time intervals could be accepted as suitably different from each other.
16 3.3 Verification of Hypotheses
H1: Markets do not react to all types of environmental news equally: Results confirm prior studies. The market does not react to certain types of news as it does not deem them financially relevant. Market prices increase in response to positive and decrease to unfavorable environmental news. Those events that originate from internal company initiatives (positive or negative) significantly influence market prices while third party reports and opinions do not H2: Various financial indicators, such as size, profitability or risk would influence market reactions: Results show that market reactions differ in view of the firm-level financial variables.
Positive internal events generate greater reactions in case of smaller, less profitable companies.
Environmental improvement actions are also more valued for companies that are deemed riskier by the market. Those companies that have large long-term debt benefit the least from these actions. The negative news items effect the larger and the less profitable companies the most.
H3: The level of media coverage could influence market reactions: It has been proven that for both positive negative internal news companies that are less frequently appear in the media are affected more strongly than those that are constantly in the center of media attention. In case of penalties and lawsuits, on the other hand, larger publicity leads to larger losses. This is also influenced by the size factor (as already stated in H2).
H4: A Market reaction could also depend on the firm's environmental reputation:
Although, company environmental image does influence market reactions, the direction of the effect does not match prior studies. On the contrary, favorable environmental impression does not reduce market responses to negative news but increases those while the expected dampening effect could be observed in reactions to positive news items. Companies with a bad image, on the other hand, profit more from their positive initiatives and are penalized less for their misdemeanors.
H5: Market reactions could change as a function of time: With the increased importance of the environmental topic and the growing role of publicity, market reactions have become more differentiated. The various event types did not develop parallel to each other but have travelled on diverging life-cycles. The difference between internal and external news items is again clearly observable. While abnormal returns of the former one are more homogeneous, the later ones are more cyclical. Reactions to positive internal initiatives are showing a slight upward trend, while to positive external opinions they are decreasing. Negative environmental news items are penalized to a progressively lesser extent.
17 3.4 Novel Scientific Results
As a result of my research I have reached the following innovative and original scientific achievements:
1. I have utilized the event study methodology with GARCH specification to the analysis of market reactions to company environmental news for the first time in Hungarian research circles.
2. By specifically selecting the food industry in examining the relationship between the environmental and financial performance of companies, I have also aimed to fill a void in the international literature which, due to the growing role of the food sector in sustainability, has become increasingly relevant.
3. With the study of market reactions to environmental news I have proven that the market is selective and does not value every effort uniformly. By dividing the news items into various event types, I have shown that the stock market primarily rewards those company actions that can bring concrete –real or expected- monetary gains.
4. By introducing the firm-level variables into the equation, I have confirmed that stock market reactions vary with specific company characteristics. Larger, more recognized companies have to endure greater negative reactions while smaller, less environmentally friendly firms could profit more from their positive environmental initiatives.
5. The long term analysis of market reaction to environmental news has uncovered the necessity of dividing the news items into various types. I have shown that not only do market reactions change in time, but depending on the type of event they have varying life cycle.
18 4 CONCLUSIONS AND PROPOSALS
4.1 Conclusions and Proposals from the Analysis of the Type of Environmental Events
In the first part of my dissertation I have investigated whether the various environmental news items elicit similar reactions to the stock prices of companies?
As it was expected, after the review of the related literature, market reactions are differing based on event types. The results confirm that stock returns increase in response to environmental improvements, while they decrease in response to environmental violations.
From the event division utilized in my dissertation, it can be ascertained that the market does not place as high an emphasis on reports, reviews and evaluations originating from a third party as it was expected. The main reason behind the highly significant reactions to the E1 and E2 type (internal) events could be that these initiatives have actual, direct monetary consequences, thus the investors primarily hold these events value creating or destroying.
Further differentiation of the events (such as between proactive and reactive actions) could provide companies with valuable information as to which environmental efforts should they be focusing on.
4.2 Conclusions and Proposals from the Analysis of Company Specific Variables Other than the event types, firm-level variables could also influence market reactions. Prior studies showed that analyses that cover many industries, or do not consider firm-level characteristics would lead to ambiguous, non-interpretable results. Therefore, narrowing my study to one industry, I could exclude certain market influences that affect the whole food sector and could focus on specific firm attributes.
The analysis of the financial variables has uncovered some interesting findings. Although it is the smaller and less profitable companies that have the least available capital, it is exactly these companies that could benefit the most from their positive efforts. Therefore, these companies should already from the onset invest in environmentally friendly technologies. At the same time, the bigger, more prominent companies, regardless of financial situation, have to strive to become “model citizens” as the investors and the media are keeping a close eye on them. These firms are the primary targets of environmental activists, and even governments like to impose bigger fines on them.
Results gained form the two non-financial variables are the most complex and the hardest to interpret. Companies with good environmental reputation that appear in the media frequently have to pay the closest attention to their environmental performance. They have to put much greater effort into their positive initiatives in order to achieve financial benefits, and their miss- steps are much harder penalized by the market. At the same time, the “bad-boys”, enjoy a certain leniency when it comes to environmental behavior.
While specific opinions (positive or negative) of outside parties do not directly seem to influence company stock prices, they undoubtedly do play an important role in shaping the overall reputation of companies and the general market sentiments.
Further suggested research could focus on the interaction between the various categories, that is, to see whether certain combinations of effects together, for example, size and media or image and media, might influence results differently.
19
4.3 Conclusions and Proposals from the Longitudinal Analysis
From the longitudinal study of market reactions to environmental news, it can be shown that the market, that is the investors, change their posture depending on the overall attitude of society towards environmental stewardship. The political and judicial changes also play an important role in influencing investor behavior. Company efforts that are focusing on sustainable development and building good environmental image could only be effective as part of a long term strategy. The long-term reputational losses that a company has to face from their environmental transgressions are much greater than what they can save from their short-sighted destructive behavior.
The four event-types have differing life-cycles. The positive, internal initiatives show an evident and growing upward trend. They are non-cyclical and their volatility is decreasing.
Reactions to these types of events are the most predictable. Positive news items coming from outside sources have lost their initial appeal, and even though their dispersion has decreased they are still very susceptible to market trends and reorganizations. Reactions to negative internal news items showing a clear downward sloping trend, but with decreasing intensity, that is market reactions are diminishing. The explanation probably can be found in the introduction of new accounting rules that require companies to report any expected liabilities coming from environmental events. Both negative news types continue to show significant outliers (in both direction) which highlight the surprise value of these events. Here an additional influencing factor is that negative events create stronger reactions and also that these news items are much more difficult to be managed by the companies than favorable ones.
As it can be seen from the above, companies should adjust their environmental management strategy not only to their individual situations, but also to the general socio-political conditions.
20 5 SCIENTIFIC PUBLICATIONS
Journals
Deák Zsuzsanna (2008). Élelmiszer vagy bioüzemanyag? – Lehetőségek és kockázatok, Élelmezési Ipar, LXII. évf. (2008) 7. szám, pp.193-197, ISSN 0013-5909
Deák Zsuzsanna - Hajdu Istvánné (2010). Fenntartható fejlődés és a fogyasztói társadalom, Agrár és Vidékfejlesztési Szemle, 2010 Vol. 5, pp. 516-521, ISSN 1788-5345
Deák Zsuzsanna - Hajdu Istvánné (2011). Az élelmiszeripari vállalatok környezeti teljesítményének megítélése a nemzetközi médiában, Élelmiszer Tudomány Technológia, LXV.
évf. (2011) 3. szám, pp. 1-6, ISSN 2061-3954
Deák Zsuzsanna - Hajdu Istvánné (2011). Az élelmiszer-ipari vállalkozások környezeti teljesítménye és a pénzügyi eredmények, Gazdálkodás, 55. Évf. (2011) 7. Szám, pp. 662-667, ISSN 0046-5518
Zsuzsanna Deák – Istvánné Hajdu (2012). Environmental Reputation of Food Production Industry and its Financial Connotations, International Journal of Sales, Retailing and Marketing, Vol.1. No. 4, pp. 17-26, ISSN 2045-810X
Zsuzsanna Deák – Istvánné Hajdu (2012). The Role of Socially Responsible Investing and Media in the Environmental Stewardship of Food Industry Companies, Acta Alimentaria, Vol.
41. (Suppl.), pp. 25-39, ISSN 0139-3006 IF 0.444
Deák Zs., Hufnagel L., Hajdu I. (2013). The Impact of Perceived Corporate Environmental Performance on the Behavior of Capital Market Decision Makers: Analysis of Food Industry Companies,Applied Ecology and Environmental Research, ISSN 1785-0037 IF 0.547 (in press) Conference Proceedings
Hungarian (full paper)
Deák Zsuzsanna (2009). A felelős vállalati magatartás és a tőkepiaci érték – amerikai esettanulmány és magyarországi vonatkozásai. Lokalizáció - Megoldás a fenntarthatóságra? LI.
Georgikon Napok, Keszthely, 2009. október 1-2. pp. 170-179. ISBN 978-963-9639-35-5
Deák Zsuzsanna - Hajdu Istvánné (2011). Az élelmiszeripar zöld törekvései, Erdei Ferenc VI.
Tudományos Konferencia, Kecskemét, 2011. augusztus 25-26. II. Kötet, pp. 47-52. ISBN 978- 615-5192-00-5
21 Hungarian (abstract)
Deák Zsuzsanna (2009). Corporate Responsibility and the Capital Markets - Comparative Case Study between the United States and Hungary. 51st Georgikon Scientific Conference, Keszthely, 2009. október 1-2. Conference Abstracts, 1-2. pp. 38. ISBN 978-963-9639-34-8
Deák Zsuzsanna (2009). Környezettudatos vállalati magatartás és a tőkepiaci érték. Lippay János-Ormos Imre-Vas Károly Tudományos Ülésszak, 2009. október 28-30. pp. 224. ISBN 978- 963-503-397-3
International Conferences (full paper)
Deák Zsuzsanna (2011). Market Reactions to Environmental Information in The Food Production Industry, Journal of International Scientific Publication, Economy & Business (2011) Vol.5., pp. 369-381, ISSN 1313-2555
Zsuzsanna Deák – Istvánné Hajdu (2012). Reputational Surveys and Company Perceptions: a Case Study in Hungary, World Congress of Administrative and Political Sciences, Antalya, Turkey, November 29- December 2, 2012. ISSN 1877-0428
International Conferences (abstract)
Zsuzsanna Deák – Istvánné Hajdu (2012). Environmental Reputation of Food Production Industry and its Financial Connotations, 9th Circle International Conference. Ibiza, Spain, 11- 13th April, 2012. Book of Abstracts, p. 62. ISBN 978-1-56592-479-6