"This accepted author manuscript is copyrighted and published by Elsevier. It is posted here by agreement between Elsevier and MTA. The definitive version of the text was subsequently published in [Applied Surface Science, 480, 138-147, 2019, https://doi.org/10.1016/j.apsusc.2019.02.177]. Available under license CC-BY-NC-ND."
Applied Surface Science 480, 138-147, 2019
Role of water molecules in the decomposition of HKUST-1: evidence from adsorption, thermoanalytical, X-ray and neutron scattering measurements
Andrea Domána, Orsolya Czakkelb, Lionel Porcar b, János Madarászc, Erik Geisslerd, Krisztina Lászlóa*
aDepartment of Physical Chemistry and Materials Science, Budapest University of Technology and Economics, Budapest, Hungary, H-1521,
bInstitut Laue Langevin, CS 20156, F – 38042 Grenoble Cedex 9, France
cDepartment of Inorganic and Analytical Chemistry, Budapest University of Technology and Economics, Budapest, Hungary, H-1521
d Université Grenoble Alpes, CNRS, LIPhy, 38000 Grenoble, France
Abstract
HKUST-1 is a strictly microporous crystalline metal organic framework with pore sizes of 5, 11, and 13.5 Å. Detailed gas adsorption measurements show that its adsorption capacity for water at 20 °C is higher than that for nitrogen at -196 °C, and far exceeds that for methane at 0 °C. Extended exposure to water vapour at high relative humidity, or consecutive adsorption-desorption cycling of water vapour, destroys both the MOF crystal structure and its adsorption capacity, after a reduced number (< 5) of cycles. Destruction proceeds through mesoporous defects that open within the crystal structure, as attested both by the development of hysteresis in the adsorption isotherms and by changes in the small angle X-ray scattering pattern. In the pristine crystal, the structure of the water in the micropores closely resembles that of bulk liquid water. Small angle neutron scattering demonstrates that water is adsorbed preferentially over methane, and that the size of the spherical cavities occupied by the adsorbed water molecules in the intact crystal is consistent with the known pore size structure in this system.
Keywords: Metal organic frameworks, nitrogen adsorption, water vapour adsorption, methane adsorption, small angle X-ray scattering, small angle neutron scattering, effects of aging.
Introduction
The spectre of climate change concentrates minds wonderfully on alternative energy sources, and especially on their means of storage. The huge advantage of natural gas as a high
* Corresponding author: Krisztina László
Full postal address: Műegyetem rkp. 3. Budapest, 1111, Hungary Telephone:+36-1-463-1893
e-mail address: klaszlo@mail.bme.hu
energy/carbon ratio fuel is offset by the limited means available for its effective and safe storage. Adsorptive natural gas storage (ANG) could prove to be a solution to this problem, but a suitable adsorbent is lacking. [1] Formerly it was reported that, confined in highly porous activated carbon matrices, methane hydrates can be synthesized and stored under relatively mild conditions [2]. It was in this context that expectations were briefly raised by the high storage capacity of metal organic frameworks (MOFs) for methane, the main component of natural gas. [3, 4] MOFs consist of transition metal ions or clusters bound together by organic ligands. They owe their excellent adsorption properties to their open framework with ordered pore structure and permanent porosity. [5] The fatal defect of many MOFs, however, is their poor long term stability in the presence of water vapour, due the weakness of the metal – ligand bonds [6]. In a related study, Casco et al. reported that pre-humidified MOFs also promote methane hydrate formation at 2 °C and 3-5 MPa, either within their inner cavities or in the interparticle space, depending on their hydrophilicity. Among the factors controlling the nucleation process the pre-humidification conditions were found to play a crucial role [7].
This article describes a multi-technique investigation into the adsorption of water molecules in one of the most widely studied MOFs, copper benzene-1,3,5-tricarboxylate (CuBTC MOF, Cu3(BTC)2 or HKUST-1). HKUST-1 is one of the most promising candidates to achieve the US DoE (Department of Energy) target (263 cm3 CH4/cm3 MOF at 35 bar) established for economical natural gas storage [8]. In the octahedral crystals of HKUST-1, copper(II) ions and benzene-1,3,5-tricarboxilate organic ligands build up the three-dimensional open pore structure through coordination bonds. The three typical microporous sites in the structure, of diameter 5, 11, and 13.5 Å, have different hydrophilic characters. The basic building unit consists of 2 copper ions, coordinated with each other and with 4 carboxylate groups from 4 different BTC ligands. The 13.5 Å coordination site of the copper ion can easily accommodate water molecules. [4, 9] Water adsorption on this substrate is therefore complex, possessing several levels of site that can also depend on the history of the sample preparation [10].
The instability of HKUST-1 in the presence of water, both in vapour [11] and liquid [12] state, is well known. The complexity of the system has been described from multiple points of view [6, 13, 14]. DeCoste et al. studied the aging of commercially available HKUST-1 (BasoliteTM C 300). Structural and surface changes were reported and the formation of carboxyl groups was observed during decomposition. They concluded that the relative humidity and the temperature applied during the ageing determine the rate of decomposition [15]. Gul-E-Noor et. al. were able to follow structural changes in HKUST-1 by using 1H and 13C solid-state NMR with magic angle spinning, detecting several different crystalline adsorption sites for the water molecules.
The 1H spectra indicated a dynamic water adsorption/desorption process at the free coordination site of copper at room temperature. The network structure was fairly stable when a small amount of water was adsorbed. At higher adsorbed water the HKUST-1 network slowly decayed, yielding various products depending on the conditions [16]. The results clearly indicate that the water molecules preferentially interact with the copper sites. The vacant Cu pair is occupied, on average, by one water molecule before a second water molecule is taken up. They also imply the possibility of water exchange among the binding sites [17]. Fan et al. published a comprehensive study of the hydrothermal stability of CuBTC exposed cyclically to streams of humid air. Water uptake was slow, and they concluded that adsorption most likely operates under non-equilibrium conditions. They also demonstrated that the relative humidity and the water exposure time must be controlled in order to maintain the integrity of the adsorbent [11].
In spite of these recent studies, however, the mechanism of water adsorption in the HKUST-1 structure still remains uncertain.
Measurements by X-ray diffraction (XRD) on MOFs and MOF-activated carbon composites have been reported on HKUST-1, notably in its dry state [18-21], while numerical calculations have been used to investigate its methane adsorption characteristics at low pressures [22]. Methane adsorption capacity depends on sample preparation, on solvation temperature, on thermal history and on exposure to water vapour, parameters that affect the crystal structure and the amorphous component of the MOF, as detected by XRD. These systems, synthesized in water-ethanol mixtures, have been shown by Schlichte et al. [23] to possess good thermal stability to heating to almost 300 ºC: although solvent removal by evacuation under heating can exceed 30% of the total mass, loss of water from the crystal lattice in this temperature range generates only minor changes in the structure. The stability of MOFs to water vapour and other solvents is, however, less robust [24, 25]. By contrast, little work seems to have been reported using small angle neutron scattering on metal organic frameworks [26].
The present paper investigates adsorption of water vapour by Cu-BTC MOF using gas adsorption techniques, thermogravimetry, as well as small and wide angle X-ray scattering (SAXS and WAXS) and small angle neutron scattering (SANS). The SANS measurements include adsorption of methane/water vapour mixtures performed in the low pressure (< 1 bar) regime.
The paper is organized as follows: first the experimental conditions are described under which the samples were investigated, and then the results of the different gas adsorption measurements are examined, by comparing nitrogen and water vapour. Information drawn from
SAXS measurements is used to provide a picture of the changes in the structure arising from repeated adsorption and removal of water molecules. Next, findings from thermogravimetry measurements are discussed showing that evaporation of water from MOF samples prepared under different conditions of hydration gives rise to a variety of adsorption sites for the water molecules that are consistent both with adsorption and the SAXS measurements. The same methods were also used to follow aging of the samples under ambient conditions at constant relative humidity. Finally, it is shown that adsorbed methane gas is stored in the nanopores of pristine MOF crystals, but the SANS measurements demonstrate that this gas is subordinate to, and is displaced by, water vapour, which is adsorbed preferentially.
Experimental Sample preparation
HKUST-1 (C18H6Cu3O12, Mw 604.87 g/mol) was synthesized under solvothermal conditions after Wang et al. [27]. 10 cm3 of 83.3 mM H3BTC dissolved in ethanol was mixed with the stoichiometric amount of aqueous solution Cu(NO3)2.3H2O (125 mM,10 cm3) After 10 minutes argon gas was bubbled through the mixture for 5 minutes to eliminate air from the autoclave prior to sealing. The mixture was heated to 80 °C (heating rate 0.5 °C min-1), kept there for 24 hours and allowed to cool to room temperature. The turquoise crystals thus obtained were filtered and thoroughly washed with ethanol. The material was then dried in air for 24 hours at ambient temperature and stored for further use in a desiccator filled with freshly activated silica. The fine as-prepared crystalline material was investigated without further crushing or grinding. The theoretical composition of the solvent-free HKUST-1 is 31.5 w/w%
copper and 68.5 w/w% organic ligand.
The nitrogen and methane adsorption measurements were made with a Quantachrome Nova 2000e at -196 °C and with a Quantachrome Autosorb 1 instrument at 0 °C, respectively.
The water vapour adsorption isotherms were measured on a volumetric Hydrosorb apparatus (Quantachrome) at 20 °C. The nominal resolution of the instrument is 0.005 mg sorbed water.
The equilibration pressure changed by no more than 0.05 mmHg over a period of 60 s. Unless the pressure fell too far from its target value (< 0.05% of p0), data points were recorded after 2000 s whether or not the pressure had equilibrated. The cross-sectional area of water used in the calculations was 12.5 Å2 [28].
The SAXS measurements were performed on the small angle instrument of the French CRG beam line BM02 at The European Synchrotron (ESRF). A 2D charge coupled device (CCD) indirect illumination camera with pixel size 50 µm was used as detector. The X-ray
response is detected in transmission geometry, the resolution being defined by the solid angle subtended by the CCD pixel size at the sample-detector distance D, which was varied between 180 cm and 6 cm. The range of transfer momentum q=(4/) sin() explored was 210-3 Å-1<
q < 5 Å-1, where is the wavelength of the incident X-rays and is the scattering angle as defined in conventional X-ray crystallography. The selected beam energy was 18 keV, with resolution /=310-4. For these observations, the HKUST-1 samples were first heated to 110
°C and evacuated for 24 hrs, then placed in 1.5 mm capillary tubes in a thermostated bath at 20 ºC, and exposed for one month prior to the measurements to water vapour from saturated solutions of LiCl and KCl, with respective relative humidity RH=11.3% and 85%. In addition, a sample of the air-dried crystals was placed directly in a capillary tube without further treatment. The capillary tubes were then sealed and the SAXS measurements were performed at 20 ºC.
The SANS measurements [29], intended to measure the adsorption of methane gas by the structure of the MOF, were made on the D22 small angle instrument at the Institut Laue- Langevin, Grenoble, with incident wavelength =8Å and resolution /=10%. To avoid detector saturation from Bragg reflections, the transfer momentum range explored was 210-3
< q < 0.25 Å-1. The granular sample was placed in an annular aluminium sample holder with effective sample thickness 2 mm, and placed in a vacuum oven at 110 ºC overnight. On being cooled to room temperature, the sample holder was inserted into the cryostat and evacuated through a capillary tube that was connected to an adsorption apparatus (Hiden Isochema), after which it was cooled to 0 ºC. The capillary tube served both to evacuate the sample and to introduce the methane gas at known pressure. During the data analysis it was discovered that some water vapour evacuated by pumping was not in fact entirely removed from the system, but had condensed at a cold point higher up in the capillary tube. Thus, when aliquots of methane gas were introduced into the sample cell during the SANS measurements, they were accompanied by water molecules that evaporated from this reservoir, which were re-adsorbed by the sample. This unexpected mixture of water vapour and methane enabled us to evaluate the preferential adsorption of water over methane.
Thermal analysis was performed using a simultaneous TG/DTA apparatus (STD 2960 Simultaneous DTA-TGA, TA Instruments Inc., USA). Approximately 10 mg of sample were placed in an open Pt crucible, then heated at a rate of 10 °C min−1, under a flow of dry air at 130 cm3 min−1.
X-ray diffraction was performed with a copper anode diffractometer (X’pert Pro MPD, PANanalytical Bv., The Netherlands) on a zero-background Si-single crystal sample holder [30].
Results
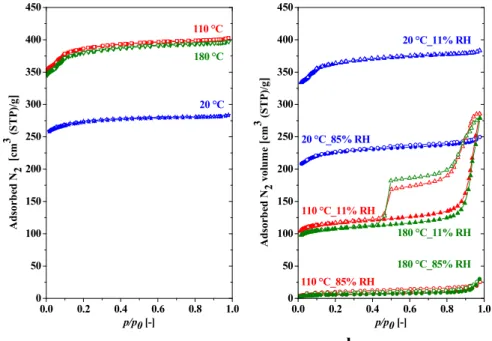
The low temperature nitrogen adsorption isotherms of the HKUST-1 system are shown in Figure 1. Prior to these N2 adsorption measurements, the samples were evacuated for 24 hours at three different temperatures, 20 ºC, 110 ºC and 180 ºC, to remove excess water molecules. For comparison, all the nitrogen adsorption data are related to the mass of the water- free sample. Fig. 1a shows that the number of adsorption sites available for nitrogen molecules increases appreciably when the samples are evacuated above 100 ºC. These samples display no hysteresis. However, the initial shape of the adsorption cycle both for the 110 ºC and the 180 ºC case is more complex than for 20 ºC, a sign that the sites from which water molecules are removed by heating differ from those when the sample is not heated. This also implies that the space available to other gases may be “tuned” by adjusting the temperature of sample evacuation.
0.0 0.2 0.4 0.6 0.8 1.0
0 50 100 150 200 250 300 350 400 450
Adsorbed N2 [cm 3 (STP)/g]
p/p0 [-]
180 °C 110 °C
20 °C
0.0 0.2 0.4 0.6 0.8 1.0
0 50 100 150 200 250 300 350 400 450
Adsorbed N2 volume [cm 3 (STP)/g]
p/p0 [-]
110 °C_85% RH
180 °C_85% RH 180 °C_11% RH 110 °C_11% RH
20 °C_85% RH
20 °C_11% RH
a b
Figure 1 a: Nitrogen adsorption isotherms at -196ºC of as-prepared sample after 24 h evacuation at 20 °C (blue stars), at 110ºC (red squares), at 180ºC (green triangles). b:
Dependence of N2 adsorption/desorption on previous history. These samples were evacuated at the stated temperature for 24 hrs prior to exposure to two different RH atmospheres for 21 days.
All specimens were evacuated at 180 °C for 24 hrs before the N2 adsorption measurements.
Blue triangles: evacuation at 20 °C, exposure to 11% RH; blue circles: evacuation at 20 °C, exposure to 85% RH; red triangles: evacuation at 110 ºC, exposure to 11% RH; green triangles:
evacuation at 180 ºC, exposure to 11% RH; red circles: evacuation at 110 ºC, exposure to 85%
RH; green circles: evacuation at 180 ºC, exposure to 85% RH. Full and open symbols are used to distinguish adsorption and desopriton points, respectively. Hysteresis in the sample evacuated at 110 ºC or 180 ºC and then exposed to water vapour at 11% RH is the signature of mesoporosity. All nitrogen uptakes are normalized with respect to water-free mass.
Following the N2 adsorption measurements, samples with the same pre-treatment as in Figure 1a were exposed for 21 days to water vapour at varying degrees of relative humidity (RH), and then evacuated for a second time (180 °C, 24 h) prior to the nitrogen adsorption measurement. The resulting nitrogen adsorption isotherms now depend both on the temperature of pre-treatment and on RH (Figure 1b). The sample evacuated first at room temperature, for example, then exposed to 11% RH and evacuated again at 180 ºC for 24 hrs, displays slightly lower adsorption capacity for nitrogen than the sample first activated at 180 °C (green line, Fig.
1a). After exposure to 85% RH and evacuation at 180 ºC, however, its capacity falls abruptly.
By contrast, the sample evacuated at 110 ºC, after exposure to 11% RH and a second evacuation at 180 ºC, loses more than two thirds of its micropores, but gains in mesopores, as attested by the conspicuous hysteresis. Remarkably, this behaviour is almost identical to that of the sample first evacuated at 180 ºC, then exposed to RH 11% and evacuated again at 180 ºC. Meanwhile, the adsorptive capacity of samples that are first evacuated at either 110 ºC or 180 ºC, then exposed to RH 85% and evacuated at 180 °C, collapses completely. As discussed later, the WAXS responses confirm that the original HKUST-1 crystal structure does not survive in this case.
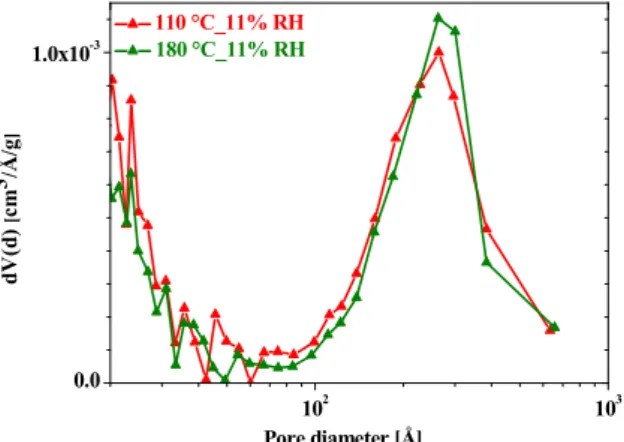
The pore size distributions derived from the N2 adsorption curves of Fig. 1b for the samples exposed to 11% RH are shown in Figure 2. Contrary to the sample evacuated at 20 ºC, which possesses negligible porosity in the size range above 100 Å, those evacuated both at 110 ºC and 180 ºC and exposed to 11% RH have become strongly mesoporous.
102 103
0.0 1.0x10⁻³
110 °C_11% RH 180 °C_11% RH
dV(d) [cm3/Å/g]
Pore diameter [Å]
Figure 2. Pore size distribution of HKUST-1 samples after first evacuation at 110 ºC (red triangles) and 180 ºC (green triangles) and then exposure for 21 days to 11 % RH.
Figure 3 shows the adsorption isotherms of water vapour at 20 ºC, normalized with respect to the sample weight after evacuation, in three specimens evacuated respectively at room temperature, 110 ºC and 180 ºC. Approximately 25% of the as-prepared sample dried in air at room temperature is removed on pumping [28]. The initial concave shape of the isotherms indicates that the water uptake starts on hydrophilic sites. It is also significant that at the highest relative pressure water uptake is substantially greater than the total nitrogen adsorption [31, 32].
As in the case of nitrogen adsorption, water uptake increases with higher evacuation temperature. All samples display appreciable hysteresis, with the desorption curves failing to return to zero. This behaviour implies that, once the sample is evacuated, the water molecules do not in general reoccupy their initial positions. For the room temperature treated sample, both uptake and hysteresis are more moderate. After evacuation at 20 °C the water uptake is 12.9 mol/mol dry HKUST-1, while after evacuation at 110 and 180 °C it is 15.5 mol H2O/mol dry HKUST-1, which leaves ca. 2.6 mol retained water in the system after the low temperature evacuation. The evidence of these isotherms, as well as of the N2 isotherms in Fig. 1a, suggests that water molecules removed at higher temperatures are not from the same sites as those in the pores, and that they therefore belong to the HKUST-1 crystal structure, directly coordinated to the three Cu atoms in the HKUST-1.
0.0 0.2 0.4 0.6 0.8 1.0
0 50 100 150 200 250 300 350 400 450 500 550 600 650
Adsorbed H2O[cm 3 (STP)/g]
p/p0 [-]
180 °C 110 °C
20 °C
Figure 3. Water vapour adsorption in HKUST-1 evacuated at the indicated temperatures.
Desorption branches designated by hollow symbols. All water uptakes are normalized with respect to water-free mass.
Structural disorder, however, is not confined to higher temperatures: evacuation at room
temperature alone is sufficient to inflict substantial damage. Figure 4 illustrates this point by showing how successive water vapour adsorption cycles affect the adsorption capacity. Here, a series of adsorption and evacuation cycles at 20 ºC produces the same collapse as seen in Fig.
1b for samples previously evacuated at higher temperatures and then exposed to either 11% or 85% RH. The dramatic change in the initial slope of the repeated isotherms is a sign that the system becomes increasingly hydrophobic.
0.0 0.1 0.2 0.3
0 50 100 150 200 250 300 350 400 450
5th run 2nd run
1st run
Adsorbed H2O volume [cm 3 ,STP/g]
p/p0 [-]
Figure 4. Effect of repeated H2O uptake measurements at 20 ºC on the same sample, each cycle being followed by re-evacuation (without heat treatment or removal from the sample port) at 20 °C. All water uptakes are normalized with respect to water-free mass.
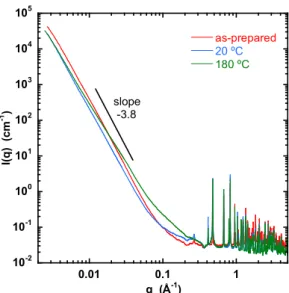
Figure 5 shows the changes in the SAXS response when water is removed from the structure. The three HKUST-1 samples are: as prepared (red), evacuated for 15 hours at 20 °C (blue), and evacuated for 15 hours at 180 ºC. These samples were prepared 3 weeks before the SAXS measurements.
Figure 5. SAXS response of HKUST-1 as-prepared (red), after evacuation for 15 hours at 20
°C (blue), and after evacuation for 15 hours at 180 ºC (green) then sealed in their capillaries.
The power law slopes in the lower q range correspond to scattering from rough surfaces. The increased scattering visible in the 180 ºC sample around 0.1 Å-1 is the signature of incipient mesoporous defects in the crystal structure.
In the double logarithmic figure of Fig. 5 the power law response, I(q)q-m, in the low q regime (q <0.01 Å) with slope m>3 is consistent with scattering from rough surfaces. [33, 34, 35] In the sample heated to 180 ºC the increased scattering intensity observed in the range 0.02 ≤ q ≤ 0.1 Å-1 (i.e., pore diameter d=2/q between about 60 and 300 Å) indicates moderate mesoporosity, in apparent contradiction with the absence of hysteresis in the nitrogen isotherms in Fig. 1a. This discrepancy, however, could be due to aging: the SAXS samples were prepared 3 weeks before the measurements were made. In the higher q range (q > 0.4 Å-1) of this figure, the positions of the Bragg scattering peaks coincide with those predicted by the basic cubic structure of unit cell size 26.2 Å. [23]
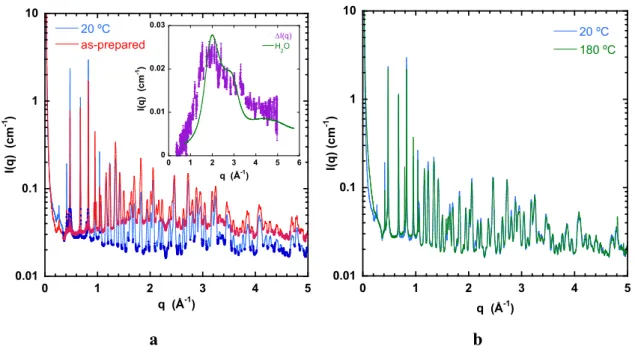
Inspection of the higher q region in Fig. 5 (q ≥ 0.3 Å-1) reveals a substantial difference between the baselines of the as-prepared sample and that evacuated at 20 ºC (Figure 6). The inset shows the intensity difference I(q) between these two responses, taken from regions of q where Bragg peaks are absent. The similarity between I(q) and the SAXS response of bulk liquid water (continuous curve in inset) suggests that this signal stems largely from amorphous water located inside the pores, rather than from molecules belonging to the crystal structure.
This interpretation is
10-2 10-1 100 101 102 103 104 105
0.01 0.1 1
as-prepared 20 ºC 180 ºC
q (Å-1)
I(q) (cm-1 ) slope
-3.8
a b
Figure 6. WAXS responses on linear q scale (same data as in Fig. 5). a) as-prepared sample (red) and that evacuated at 20 ºC (blue), with regions between crystallographic reflections highlighted (vertical scale logarithmic). Inset: Intensity difference I(q) from highlighted regions in main figure. Continuous green curve is WAXS response of pure water, reduced by factor f = 7 [36]; b) comparison of WAXS responses of sample evacuated at 20 ºC with that at 180 ºC.
supported by the absence of difference in background signal between the samples evacuated at 20 ºC and at 180 ºC. The intensity of the amorphous signal is approximately one seventh of that of pure water. Taking into account the filling factor of the MOF powder in the capillary tube, ca. 50-60%, this finding indicates that the water in the air-dried samples amounts to approximately 30% of the total weight. It is noteworthy in this context that attempts to measure the mobility of the adsorbed water by pulsed field gradient NMR were unsuccessful: the dipolar magnetic field of the copper ions shortens the transverse relaxation time T2 of the protons to such an extent that no echo signal is visible.
The intensities of the Bragg peaks in Figs. 5 and 6 yield additional information on the water adsorption sites. Water of crystallization located within the crystal lattice contributes to the overall lattice symmetry. If some of these molecules are removed, the internal cubic symmetry of the unit cell is broken, even though the principal features of the structure remain face centred cubic (fcc). These defects modify the resulting peak intensities, notably those with odd indices. In Fig. 6 the weak reflections (111), (311) and (331) in the sample evacuated at 20 ºC with respect to the virgin as-prepared sample are enhanced by a factor 3 or 4. This finding reinforces the earlier suggestion that room temperature evacuation removes water molecules not only from the pores but also from the crystal structure [23].
0.01 0.1 1 10
0 1 2 3 4 5
20 ºC as-prepared
I(q) (cm-1 )
q (Å-1)
0 0.01 0.02 0.03
0 1 2 3 4 5 6
I(q) H2O
I(q) (cm-1)
q (Å-1)
0.01 0.1 1 10
0 1 2 3 4 5
20 ºC 180 ºC
q (Å-1) I(q) (cm-1 )
a b
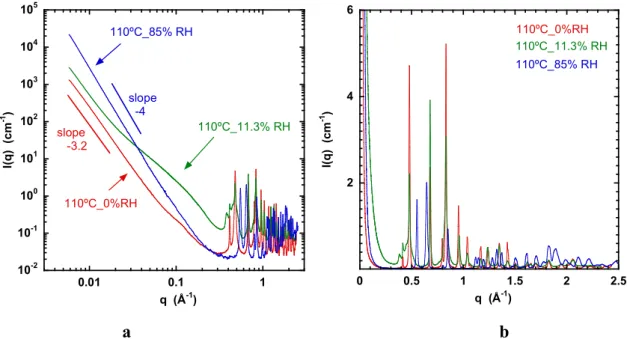
Figure 7. a) SAXS response of HKUST-1 samples evacuated at 110 ºC and then exposed for one month to water vapour at 20 °C at the RH values indicated, before sealing. The system undergoes a phase transition from cubic at low humidity (0% and 11.3% RH) to a hybrid structure at higher humidity (85% RH). [37] The intermediate curve at 11.3% RH displays strong extra scattering in the lower q range arising from mesopores. Its diffraction pattern, however, resembles that of the dry sample; b) zoom of the WAXS region in a linear representation, highlighting the difference between the undisturbed cubic MOF structure (red) and the hybrid structure (blue).
Figure 7a shows the effect on the scattering response of an HKUST-1 sample after evacuation at 110 °C for 24 hours and then exposure to different RH for one month. Three states of subsequent hydration are shown. After evacuation, the dried sample (red curve) was directly sealed in a 1.5 mm X-ray capillary tube. The same dry material was also placed in two other capillaries and left for one month at 20 ºC in contact with RH 11.3 and 85%, respectively, as described in the experimental section. The curves in Fig 7 are thus those of the HKUST-1 at three degrees of relative humidity, 0% RH, 11.3%, and 85% RH.
In the high q region of Fig. 7 the WAXS response of the system reveals a phase transition from cubic with large unit cell size at low humidity (red and green curves) to a hybrid structure at RH 87% (blue curve) [37]. This corresponds to the fully collapsed state observed in Figs. 1b and 4. The intermediate curve at 11.3% RH displays enhanced scattering in the SAXS region in the range 0.02 Å-1≤q≤0.25 Å-1 arising from mesopores. It is notable, however, that the reflections in its diffraction pattern remain similar to those in the dry state. Figure 7b shows details of the high q region, in which the difference between the MOF structure and that of the hybrid is highlighted.
10-2 10-1 100 101 102 103 104 105
0.01 0.1 1
I(q) (cm-1 )
q (Å-1) slope -4
110ºC_0%RH
110ºC_85% RH
110ºC_11.3% RH slope
-3.2
2 4 6
0 0.5 1 1.5 2 2.5
I(q) (cm-1 )
q (Å-1)
110ºC_0%RH 110ºC_85% RH 110ºC_11.3% RH
As in Figs. 5 and 6, all samples exhibit surface scattering in the low q region, with power law slopes steeper than -3. With 110ºC_85%RH, however, the slope is close to -4, characteristic of smooth surfaces [38]: the increased intensity of this scattering feature indicates that the transition to the hybrid structure fractures the system into much smaller crystallites. For the other two cases the slope is -3.4, corresponding to rough surfaces [33 - 36]. Differences in the surface scattering slopes among the samples of Figs. 5 and 7 arise from differences in batch preparation. In the intermediate q-range of sample 110ºC_11.5%RH the presence of mesoporous defects in the crystal structure is particularly conspicuous, as is confirmed by the pore size distribution in Fig. 2.
The thermogravimetric response of HKUST-1 and its dependence on previous sample history are shown in Figure 8a and b. The curves corresponding to the pre-heated and RH- retreated samples provide information about the re-allocation of water molecules in the HKUST-1 after partial (evacuation at 20 °C) or complete (evacuation at the higher temperatures) removal of the water molecules from the as-prepared sample. Due to the long incubation time, in addition to re-adsorption, these water molecules may react chemically with HKUST-1. Comparison of the signals shows that the fate of the returning water is influenced by the amount and localization of the water molecules remaining in the pores, i.e., by the temperature of the pre-treatment. On the other hand, the potential of the water, i.e., the RH conditions, also play a manifest role in the re-population. The TG signal of the air dried shows that in this sample about 25% of the total mass is loosely
50 100 150 200 250
0 1 2 3 4 5
Deriv. Weight [%/min]
20 °C_11%
20 °C_85%
110°C_11%
110°C_85%
180 °C_11%
180°C_85%
HKUST-1_original
Temperature [°C]
0 10
a b
Figure 8 Thermogravimetric response of HKUST-1 in dry air. a) Direct (TG), and b) time derivative thermogravimetric (DTG) signals. Preparation history: as-received sample (black), plus samples first evacuated at 20 °C, at 110 ºC, and at 180 ºC, and also each exposed to 11%
(solid blue, solid red, solid green, respectively) and to 85% RH (dotted blue, dotted red, dotted green, respectively). This figure reveals different levels of adsorption sites in the MOF that depend on its thermal history and exposure to water vapour.
bound adsorbed water that is released in the temperature range below 110 ºC. The residual 9%
of more strongly bound water molecules can thus be identified with water of crystallisation. As already noted, however, its removal does not modify the basic fcc structure. [39] The double adsorption site behaviour closely resembles that when the as-prepared sample is evacuated at 20 ºC and is then exposed to water vapour at 11%. Exposure of the same sample to 85% RH, however, reveals only loosely bound water, as is the case when the sample is first evacuated at either 110 ºC or 180 ºC and then exposed to water vapour at RH 11%. The latter two correspond to those samples in Figure 1b that, on being evacuated, display strongly mesoporous character.
Finally, the samples that are first evacuated at either 110 ºC or 180 ºC, and then exposed to RH 85%, exhibit at least five different adsorption sites, of which the highest release temperature is greater than 200 ºC [40]. These conditions are those in Fig. 1b in which catastrophic loss of adsorption capacity occurs upon evacuation at 180 ºC. In the collapsing structure the most strongly bound surviving site (>200 ºC) is close to the copper ion [41].
Aging
Aging of HKUST-1 was also investigated on a sample prepared at 80 ºC and air-dried at 20 ºC, then stored in a closed container at room temperature. Measurements were performed over a three-year period. The N2 adsorption isotherms and the TG curves of these samples are shown in Figures S1 and S2 in the Supplementary Information. Over this period, the N2
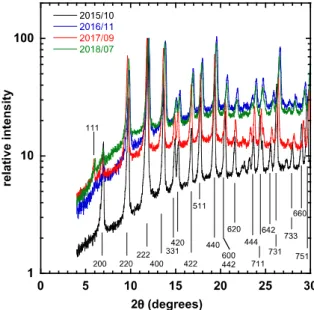
adsorption capacity decreases by 50 %. XRD diffractograms using the X’pert Pro MPD goniometer (as opposed to the SAXS beamline measurements of Figs. 5-7) show however that the chemical structure sheds H2O molecules and becomes more disordered. Figure 9 shows the diffractograms in a in semi-logarithmic form, log[I(2)] vs 2, where the principal Bragg peaks in the angular range up to 2=30º are indexed. (Figure S3 in the Supplementary Information displays these plots on a linear scale over the full angular range investigated.) The curved baseline of increasing intensity is the signature of increasingly abundant amorphous water within the system as the samples age, and is analogous to the water background in Fig. 6. In the initial response of 2015_10 the 200 reflection at 2=6.2º is weak, while the 222 reflection at 2=11.6º dominates in the low angle region of the diffractogram. At later times the former of these becomes very small, at the same time as the 111 line at 2=5.81º increases. Loss of the 200 line indicates a defective cubic structure. Upon aging, the 220 and 400 reflections become more prominent. At 2~15º the neighbouring 331 and 420 reflections appear at first invariant
with age, but at later times all the reflections tend to move to slightly higher angles. This means that the crystal structure remains cubic, but the lattice parameter shrinks marginally, from 26.2 to 26.0 Å.
Figure 9. X ray diffractograms in a semi-logarithmic representation in the range 4º≤2≤30º, normalised with respect to the 220 reflection. Indices are those of a cubic lattice of size 26.2 Å. The same XRD data in the full angular range are shown in the conventional linear
representation in Figure S3.
The absence in these XRD spectra of reflections characteristic of the collapsed structure seen in Figure 7 indicates that the basic cubic structure of HKUST-1 survives for several years if protected from changes in relative humidity. The measurements nevertheless reveal reorganisation and release of water molecules occurring within this structure that significantly diminish its adsorption capacity.
Methane adsorption
The underlying driving force that originally stimulated research into HKUST-1 is its high adsorption capacity for methane. It is thus natural to compare the response of HKUST-1 to methane with the above measurements with nitrogen and water vapour. Figure 10 shows the adsorption isotherms of dry methane at 0 ºC in samples equivalent to those of Fig. 1a, i.e., after evacuation at room temperature, 110ºC and 180 ºC, respectively. Differences in uptake, probably also due to increased removal of water molecules at the higher temperatures, are far smaller than those found with either nitrogen or water vapour. This implies that the methane molecules occupy exclusively the nanopore sites rather than those of water of crystallisation.
Also, over the same pressure range as in Fig 1a, the number of methane molecules adsorbed by HKUST-1 is about 10 times lower than that of nitrogen, and 12 times lower than water vapour.
Unlike with water vapour, however, no hysteresis is observed.
0 200 400 600 800 1000
0 5 10 15 20 25 30 35
40 20 °C
110 °C 180 °C
Adsorbed methane [cm
3 (STP)/g]
Pressure [mbar]
Figure 10. Methane adsorption in HKUST-1 evacuated at the temperature indicated. 20 °C:
blue squares, 110ºC: red circles, 180ºC: green triangles. Measurements performed at 0 ºC. All methane uptakes normalized with respect to water-free mass.
Small angle neutron scattering (SANS): competitive adsorption of methane and water
The SANS measurements were undertaken to investigate adsorption of methane in HKUST-1. As stated in the Experimental section, however, it was found during the data analysis that the adsorbate was not pure methane, but a mixture of pure methane and saturated vapour from water that had condensed at a cold point in the capillary supply tube while the sample was evacuated in the cryostat. To analyse this situation, the following approach is used.
In a SANS measurement the total scattering intensity, Itot, is the sum of two contributions, the coherent intensity Icoh(q) and the q-independent incoherent intensity Iinc. Thus
Itot = Icoh(q) + Iinc (1)
Iinc contains important information on the presence of nuclei possessing a large incoherent scattering cross-section, notably hydrogen. In particular, it reduces the transmission Tr of the sample, such that the amount of hydrogen can be estimated from the variation in Tr. The method by which Iinc and Tr are calculated are detailed in the Supplementary Information. Figure 11 shows how the apparent amount of adsorbed methane gas, calculated from the change in Tr as a function of the amount of methane injected through the capillary tube into the sample holder
is much greater than that predicted by the methane adsorption curve of Fig. 10. Furthermore, in contrast to the adsorption isotherm of the same sample on Fig. 10, that derived from the incoherent neutron signal is grossly irreversible.
0 200 400 600 800 1000
0.00 0.01 0.02 0.03 0.04 0.05
0.06 Iinc
Quantachrome
Adsorbed methane[g/g]
Pressure [mbar]
Figure 11. Adsorbed amount of pure CH4 that, according to the measurements of Fig. 10, would have been adsorbed (green triangles), compared to apparent CH4 content calculated from change in sample transmission (black half-filled circles).
Fig. 11 demonstrates that the adsorbed gas is not characteristic of pure methane. The thermogravimetric measurements of the as-prepared sample in Fig. 8 show that at 110 ºC it has lost some 25% of its initial mass by evaporation. This proportion is similar to that lost when HKUST-1 is evacuated at 20 ºC. After pumping, therefore, the sample retains about 9% by weight of water, in the form of molecules belonging essentially to the crystal structure. With respect to the anhydrous sample these specimens hence contain about 12% w/w water, corresponding to 4 molecules of H2O. For neutron scattering, therefore, we simply assume the composition of the matrix to be C18H6Cu3O12.4H2O (Mw=676.87). The total inverse neutron attenuation length of this material due to scattering and absorption is 1.206dMOFeff cm-1, where dMOFeff is the effective density of the powder in the scattering cell. [42] Note: dMOFeff is not to be confused with the calculated density of the MOF crystals, dMOFdry=1.22 g cm-3 [4]. The value of dMOFeff can then be found simply from the ratio Tr0/Tr1 of the transmission of the empty cell to that with the dry sample. Let us now entertain the assumption that the adsorbed gas is pure methane, the attenuation length of which is 12.653dCH4 cm-1 [42],where dCH4(p) is the pressure
dependent density of methane. As noted in the experimental section, the sample thickness in the present SANS arrangement was 2 mm. It follows that the transmission Tr(p) should then vary with methane pressure p according to the amount of adsorbed gas as
Tr(p) =exp{-[0.241dMOFeff+2.53dCH4 (p)]} (2) The ratio dCH4(p)/dMOFeff, found by inserting the measured values of sample transmission Tr(p) into Eq. 2, defines the adsorbed amount of methane, and is displayed in Fig. 11. The discrepancy between this calculated value and the direct adsorption measurement of dry methane is incompatible with an adsorbate consisting of pure methane. In the present case, the only alternative potential adsorbate in the system was water vapour that condensed in the capillary supply tube during the initial sample evacuation. Prior to the initial evacuation, the starting material was the HKUST-1 evacuated at 110 ºC, the only labile component of which is H2O.
No other contaminant is present. Unlike water vapour, however, methane adsorption in HKUST-1 at 0 ºC is reversible, and the gas can be removed by evacuation. The true amount of adsorbed methane is found from the desorption cycle of Fig. 11. At the end of the adsorption cycle, the sample was heated to 20 ºC and evacuated for 2 hours to release any trapped methane.
The difference between the initial and final points of the desorption branch in Fig. 11 therefore defines the true amount of adsorbed methane, which is manifestly much smaller than the amount of adsorbed water vapour. It is therefore legitimate to re-attribute the variation in transmission defined in Eq. 2 to water (see Supplementary Information, Eq. S1). Thus
Tr(dH2O) =exp{-[0.2412dMOFeff+1.1996 dH2O]} (3) Insertion into Eq. 3 of the values of the transmission Tr at p=0 and p=794 mbar yields for the density of the adsorbed water vapour at the maximum applied pressure
dH2O = 0.055 g cm-3 (4)
with
dH2O/dMOFeff=0.141 (5)
The adsorbate is predominantly water vapour, together with a small percentage of methane.
This percentage, derived in the Supplementary Information using a similar argument, is found from the values of the transmission Tr at the extremum points of the desorption branch in Fig.
11, namely 0.8188 and 0.8144, respectively. Eq. 2 then yields
dCH4 = 0.0021 g cm-3 (6)
i.e., dCH4/dH2O = 3.8% (7)
The Supplementary Information also describes the means by which Iinc in Eq. 1 is evaluated.
We are now in a position to address the coherent scattering signal Icoh(q). The chemical composition of HKUST-1 defined above yields for the neutron scattering length density
MOF=0.1634 1010dMOFdry cm-2, where, dMOFdry=1.22 g cm-3[4]. The intensity of the coherent signal scattered by the sample, in the case of water vapour, is then given by
Icoh(q)= (MOF - H2O)2 S(q) (8) where S(q) is the structure factor of the MOF. Owing to their protons, the scattering length density of H2O and CH4 are both negative: H2O= - 0.5602 1010 dH2O cm-2, CH4 = - 3.1271010 dCH4, where dH2O anddCH4 (g cm-3) are the mass densities of the water or methane adsorbed in the sample. The intensity of the coherent signal therefore increases with increasing methane adsorption. In these experimental conditions, however, where the greater affinity for water largely outweighs the effect of methane, the influx of methane gas acts simply as a vector for the H2O molecules, contributing little to the total signal. The applied pressure p of methane can therefore be used as a proxy for the amount of water adsorbed in the sample. The assumption that the structure factor S(q) of the MOF substrate does not vary significantly with increasing methane content is based on the observed invariance of the position of the Bragg peaks from SAXS measurements.
The SANS measurements were carried out in the range 0.003 < q < 0.25 Å-1 in the region below the crystallographic reflections. Figure 12 shows the SANS signal from the sample after subtraction of the incoherent background for two different carrier gas pressures, 0 mbar and 794 mbar. Unlike the SAXS responses of Figs 5 and 7, in this sample both signals display the characteristic Porod I(q)q-4 scattering feature at low q for smooth surfaces [38].
With increasing amount of carrier gas (i.e., methane pressure), the intensity in the high q region increases. As the differences between the signals are small, it is convenient to employ an analytical function to analyse the response. The simulated function adopted here is a sum of three terms, each with a physical significance. The first term is Porod scattering from the smooth surfaces. The second term, intended to account for clusters of molecules at the surfaces or in mesopores, is associated with an Ornstein-Zernike expression, with a correlation length .
The third term represents occupation of the approximately spherical pore sites inside the MOF [40]. Thus
𝐼 (𝑞) = 𝑎 𝑞 +
( ) + 𝑎 [3(sin(𝑞𝑅) − 𝑞𝑅 cos(𝑞𝑅))/(𝑞𝑅) ] (9)
Figure 12. Coherent SANS signal from HKUST-1 at two different methane pressures. Error bars, comparable in size to the data points, are shown.
where and R are respectively the correlation length of the extended region and the effective radius of the pores, and a1, a2 and a3 are the intensities of the corresponding terms. The use of five adjustable variables for the fitting function Eq. 9 is warranted in this case by the consistent and stable values found for the first three parameters, a1, a2 and , at each pressure p. The values a1=(2.43±0.012)10-7 cm-1 Å-4, and = 81.7 ± 0.73 Å are to a good approximation independent of pressure, while a2=6.7±0.2 cm-1 displays no significant variation. The only substantial influence of pressure arises in the values of the intensity a3 and the effective radius R of the spherical component. Figure 13 shows that R increases from about 3.5 Å in the absence of added water to 3.8 Å at the end of the filling cycle, when the water content is 14.1% by weight (Eq. 5). These results confirm that the adsorbed water
Figure 13. Dependence of the intensity a3 and radius R of the spherical term in Eq. 9 on carrier gas pressure. Lines are guides for the eye.
molecules are located essentially inside the pores of the MOF. Since the simulation model of Eq. 9 yields only an average value for the radius R of the spherical cavities the information about which of the different pore sizes is filled preferentially (diameters 5, 11, and 13.5 Å [40]) is indirect. However, the increase in R from 3.5 to 3.8 Å implies that the intensity of the signal from the larger pores increases and that these are filled at the expense of the smallest pores.
From Eq. 8 and the values of a3 in Figure 13, together with the above values of MOF, dMOFdry, and H2O, the maximum density of the water condensed in the pores in these coherent scattering measurements reaches
dH2O = [(a3max/a3min)1/2-1](0.1634/0.5602)
= 0.081 g cm-3. (10)
The value of dH2O found from the coherent scattering intensity is thus some 50% greater than that found independently in Eq. 4 from the incoherent scattering. The discrepancy between these values may at least in part be attributable to the uncertainty in the initial water content of the MOF sample. Both are an order of magnitude smaller than the density of bulk ice at 0 ºC.
The water vapour adsorbed in this set of measurements is therefore in a condensed state that does not fill the pores. This finding suggests another factor that may contribute to the apparent increase in radius R of the pores in the crystal structure as the water content increases. The radius of gyration of a spherical shell of water molecules condensed on the pore surface, which determines the apparent radius in Eq. 9, is greater than that of either the empty or the filled pore.
Finally, the discrepancy between the rough surface scattering behaviour in the SAXS
measurements in Figs. 5 and 7 at low q and those of SANS in Fig. 12 is an indicator of aging.
The latter measurements were performed on freshly prepared MOF specimens, while the SAXS measurements were conducted several weeks after preparation. The surface scattering observations thus suggest that structural decomposition of the HKUST-1 commences at the crystallite surfaces.
Conclusions
The measurements reported here, using gas adsorption, thermogravimetry, X-ray and neutron scattering, of water in the metal organic framework HKUST-1 in its fully hydrated state show that water molecules in the pores are in an amorphous state close to that of bulk water.
Evacuation at room temperature removes not only these water molecules but also some of those that form part of the crystal lattice. On being re-exposed to water vapour, some molecules are adsorbed in pores of average diameter about 8 Å, while others return to sites in the crystal lattice. By contrast, evacuation followed by extended or repeated exposure to humid air creates mesoporous cavities in the lattice that develop and, after a small number of hydration and evacuation cycles (n ≤ 5), completely destroy the nanoporous cubic crystal structure and thus its adsorptive capacity. The scattering observations at small angles revealed in SAXS and SANS show that without external perturbation the surfaces of the crystallites remain smooth only briefly. After a few weeks they spontaneously become rough, thereby facilitating further internal reorganisation. The present nitrogen and water vapour adsorption observations are in agreement with the magic angle spinning NMR observations of Gul-E-Noor et al. [16, 17]
according to which several different sites exist for the water in the MOF structure.
Long term storage at constant relative humidity leads to the reorganisation and release of water molecules that significantly diminish the adsorption capacity. Although the crystal structure remains cubic, the lattice parameter shrinks slightly, from 26.2 to 26.0 Å. In the intermediate stages of decomposition the thermogravimetry measurements reveal a multiplicity of adsorption sites for water.
Comparative adsorption measurements at 0 ºC indicate that the capacity for water adsorption is an order of magnitude greater than that of pure methane. Although, in view of the hydrophilic character of HKUST-1, this finding is not surprising in itself, the small angle neutron scattering measurements show directly that when the two gases are simultaneously present, water vapour is about thirty times more preferentially adsorbed.
Acknowledgements
We are grateful to the European Synchrotron Radiation Facility, Grenoble for access to the French CRG beam line BM02 (expt HC-1727) and to the Institut Laue-Langevin for access to beam line D22 DOI: 10.5291/ILL-DATA.9-12-397). We also extend our warm thanks to C.
Rochas (ESRF), M. Jacques (ILL, D22), S. Baudoin (ILL, SANE) as well as to G. Bosznai and N. Rubos (BME) for invaluable technical assistance. This work was supported by the Hungarian grant OTKA NN110209, the CONCERT-EN-046 NASEMS (JAPAN) and by the BME- Biotechnology FIKP grant of EMMI (BME FIKP-NAT). Financial support from the Hungarian Scientific Research Fund K128410 and VEKOP-2.3.2-16-2017-00013 is acknowledged. The VEKOP project is supported by the EU and by Hungary, co-financed by the European Regional Development Fund. The authors declare no competing financial interest.
References
[1] Mason, J.A., Veenstra, M., Long, J.R. (2014) Evaluating metal–organic frameworks for natural gas storage. Chem. Sci. 5, 32–51. https://doi.org/10.1039/C3SC52633J
[2] Casco, M.E., Silvestre-Albero, J., Ramirez-Cuesta, A.J., Rey, F., Jorda, J.L., Bansode, A., Urakawa, A., Peral, I., Martinez-Escandell, M., Kaneko, K., Rodriguez-Reinoso, F. (2015) Methane hydrate formation in confined nanospace can surpass nature. Nature Communications 6, 6432. https://doi.org/10.1038/ncomms7432
[3] Methane Opportunities for Vehicular Energy, Advanced Research Project Agency – Energy, U.S. Dept. of Energy, Funding Opportunity no. DE-FOA-0000672, 2012. (https://arpa-e- foa.energy.gov/)
[4] Chui, S.S.-Y., Lo, S.M.-F., Charmant, J.P.H., Orpen, A.G., Williams, I.D. (1999) A chemically functionalizable nanoporous material [Cu3(TMA)(H2O)3]n. Science 283, 1148- 1150. https://doi.org/10.1126/science.283.5405.1148
[5] Coudert, F.-X., Fuchs A.H. (2016) Computational characterization and prediction of metal–organic framework properties. Coord. Chem. Rev. 307, 211–236.
https://doi.org/10.1016/j.ccr.2015.08.001
[6] Wang, C., Liu, X., Demir, N.K., Chen, J.P., Li, K. (2016) Applications of water stable metal–organic frameworks. Chem.Soc.Rev. 45, 5107-5134.
https://doi.org/10.1039/C6CS00362A
[7] Casco, M.E., Rey, F., Jordá, J.L., Rudić, S., Fauth, F., Martínez-Escandell, M., Rodríguez- Reinoso, F., Ramos-Fernández, E.V., Silvestre-Albero J. (2016) Paving the way for methane hydrate formation on metal–organic frameworks (MOFs). Chem. Sci. 7, 3658-3666.
https://doi.org/10.1039/C6SC00272B
[8] Tian, T., Zeng, Z., Vulpe, D., Casco, M.E., Divitini, G., Midgley, P.A., Silvestre-Albero, J., Tan, J.-C., Moghadam, P.Z., Fairen-Jimenez, D. (2018) A sol–gel monolithic metal–organic framework with enhanced methane uptake. Nature Materials 17, 174–179.
https://doi.org/10.1038/nmat5050
[9] Mason, J.A., Veenstra, M., Long, J.R. (2014) Evaluating metal–organic frameworks for natural gas storage. Chem. Sci. 5, 32-51. https://doi.org/10.1039/C3SC52633J
[10] Burtch, N.C., Jasuja, H., Walton, K.S. (2014) Water Stability and Adsorption in Metal−Organic Frameworks. Chem. Rev. 114, 10575−10612.
https://doi.org/10.1021/cr5002589
[11] Al-Janabi, N., Martis, V., Servi, N., Siperstein, F.R., Fan, X. (2018) Cyclic adsorption of water vapour on CuBTC MOF: Sustaining the hydrothermal stability under non-equilibrium
conditions. Chemical Engineering Journal 333, 594–602.
https://doi.org/10.1016/j.cej.2017.09.197
[12] Küsgens, P., Rose, M., Senkovska, I., Fröde, H., Henschel, A., Siegle, S., Kaskel, S. (2009) Characterization of metal-organic frameworks by water adsorption. Microporous and Mesoporous Materials 120, 325–330. https://doi.org/10.1016/j.micromeso.2008.11.020
[13] Canivet, J., Fateeva, A., Guo, Y., Coasnecd, B., Farrusseng, D. (2014) Water adsorption in MOFs: fundamentals and applications. Chem. Soc. Rev. 43, 5594 – 5617.
https://doi.org/10.1039/C4CS00078A
[14] Burtch, N.C., Jasuja, H., Walton, K.S. (2014) Water Stability and Adsorption in Metal−Organic Frameworks. Chem. Rev. 114, 10575−10612.
https://doi.org/10.1021/cr5002589
[15] De Coste, J.B., Peterson G.W., Schindler, B.J., Killops, K.L., Browe, M.A., Mahle J.J.
(2013) The effect of water adsorption on the structure of the carboxylate containing metal–
organic frameworks Cu-BTC, Mg-MOF-74, and UiO-66. J. Mater Chem. A 1, 11922-11932.
https://doi.org/10.1039/C3TA12497E
[16] Gul-E-Noor, F., Jee, B., Pöppl, A., Hartmann, M., Himsl D., Bertmer M. (2011) Effects of varying water adsorption on a Cu3(BTC)2 metal–organic framework (MOF) as studied by 1H and 13C solid-state NMR spectroscopy. Phys. Chem. Chem. Phys. 13, 7783–7788.
https://doi.org/10.1039/C0CP02848G
[17] Gul-E-Noor, F., Michel, D., Krautscheid, H., Haase, J., Bertmer, M. (2013) Time dependent water uptake in Cu3(btc)2 MOF: Identification of different water adsorption states by 1 H MAS NMR. Microporous and Mesoporous Materials 180, 8–13.
https://doi.org/10.1016/j.micromeso.2013.06.033
[18] Mallick, A., Schön, E.-M., Panda, T., Sreenivas, K., Díaz Díaz, D., Banerjee, R. (2012) Fine-tuning the balance between crystallization and gelation and enhancement of CO2 uptake on functionalized calcium based MOFs and metallogels. J. Mater. Chem. 22, 14951-14963.
https://doi.org/10.1039/C2JM30866E
[19] Goesten, M.G., Stavitski, E., Juan-Alcañiz, J., Martiñez-Joaristi, A., Petukhov, A.V., Kapteijn, F., Gascon J. (2013) Small-angle X-ray scattering documents the growth of metal- organic frameworks. Catalysis Today 205, 120– 127.
https://doi.org/10.1016/j.cattod.2012.08.044
[20] Klimakow, M., Klobes, P., Thünemann, A.F., Rademann, K., Emmerling F. (2010) Mechanochemical synthesis of metal−organic frameworks: A fast and facile approach toward quantitative yields and high specific surface areas. Chem. Mater. 22, 5216–5221.
https://doi.org/10.1021/cm1012119
[21] Fernández-Catalá, J., Casco, M.E., Martínez-Escandell, M., Rodríguez-Reinoso, F., Silvestre-Albero J. (2017) HKUST-1@ACM hybrids for adsorption applications: A systematic study of the synthesis conditions. Microporous and Mesoporous Materials 237, 74-81.
https://doi.org/10.1016/j.micromeso.2016.09.020
[22] Majano, G., Martin, O., Hammes, M., Smeets, S., Baerlocher, C., Pérez-Ramírez, J. (2014) Solvent‐Mediated Reconstruction of the Metal–Organic Framework HKUST‐1 (Cu3(BTC)2).
Adv. Funct. Mater. 24, 3855-3865. https://doi.org/10.1002/adfm.201303678
[23] Schlichte, K., Kratzke, T., Kaskel, S. (2004) Improved synthesis, thermal stability and catalytic properties of the metal-organic framework compound Cu3(BTC)2. Microporous and Mesoporous Materials 73, 81–88. https://doi.org/10.1016/j.micromeso.2003.12.027
[24] Al-Janabi, N., Hill, P., Torrente-Murciano, L., Garforth, A., Gorgojo, P., Siperstein, F., Fan, X. (2015) Mapping the Cu-BTC metal–organic framework (HKUST-1) stability envelope in the presence of water vapour for CO2 adsorption from flue gases. Chemical Engineering Journal 281, 669–677. https://doi.org/10.1016/j.cej.2015.07.020
[25] Borfecchia, E., Maurelli, S., Gianolio, D., Groppo, E., Chiesa, M., Bonino, F., Lamberti, C. (2012) Insights into adsorption of NH3 on HKUST‑1 metal−organic framework: A multitechnique approach. J. Phys. Chem. C 116, 19839−19850.
https://doi.org/10.1021/jp305756k
[26] Zacher, D., Nayuk,R., Schweins, R., Fischer,R.A., Huber, K. (2014) Monitoring the Coordination Modulator Shell at MOF Nanocrystals Cryst. Growth Des. 14, 4859−4863.
https://doi.org/10.1021/cg501025g
[27] Wang, F., Guo, H., Chai, Y., Li, Y., Liu, C. (2013) The controlled regulation of morphology and size of HKUST-1 by ‘‘coordination modulation method’’. Microporous and Mesoporous Materials 173, 181–188. https://doi.org/10.1016/j.micromeso.2013.02.023
[28] Domán, A., Madarász, J., László, K. (2017) In situ gas analysis assisted thermogravimetric (TG-FTIR and TG/DTA-MS) studies on non-activated copper benzene-1,3,5-tricarboxylate.
Thermochimica Acta, 647, 62-69. https://doi.org/10.1016/j.tca.2016.11.013
[29] Geissler, E., Czakkel, O., László, K., Porcar, L. (2015) Methane adsorption in porous Metal Organic Frameworks. Institut Laue-Langevin (ILL) doi:10.5291/ILL-DATA.9-12-397 [30] Domán, A., Nagy, B., Nichele, L.P., Srankó, D., Madarász, J. László, K. (2018) Pressure resistance of copper benzene-1,3,5-tricarboxylate – carbon aerogel composites. Applied Surface Science 434, 1300–1310. https://doi.org/10.1016/j.apsusc.2017.11.251
[31] Schoenecker, P.M., Carson, C.G., Jasuja, H., Flemming, C.J.J., Walton, K.S. (2012) Effect of water adsorption on retention of structure and surface area of metal–organic frameworks.
Ind. Eng. Chem. Res. 51, 6513 – 6519. https://doi.org/10.1021/ie202325p
[32] Zhao, Z., Wang, S., Yang, Y., Li, X., Li, J., Li, Z. (2015) Competitive adsorption and selectivity of benzene and water vapor on the microporous metal organic frameworks (HKUST- 1). Chemical Engineering Journal 259, 79 – 89. https://doi.org/10.1016/j.cej.2014.08.012 [33] Pfeifer, F., Avnir, D. (1983) Chemistry in noninteger dimensions between two and three.
I. Fractal theory of heterogeneous surfaces. J. Chem. Phys.79, 3558-3565.
https://doi.org/10.1063/1.446210
[34] Avnir, D., Farin, D., Pfeifer, F. Chemistry in noninteger dimensions between two and three.
II. Fractal surfaces of adsorbents. J. Chem. Phys. 79, 3566-3571.
https://doi.org/10.1063/1.446211
[35] Bale, H.D., Schmidt, P.W. (1984) Small-angle X-ray-scattering investigation of submicroscopic porosity with fractal properties. Phys. Rev. Lett. 53, 596-599.
https://doi.org/10.1103/PhysRevLett.53.596
[36] László, K., Czakkel, O., Dobos, G., Lodewyckx, P., Rochas, C., Geissler, E. (2010) Water vapour adsorption in highly porous carbons as seen by small and wide angle X-ray scattering.
Carbon 48, 1038–1048. https://doi.org/10.1016/j.carbon.2009.11.023
[37] Peterson, G.W., Wagner, G.W., Balboa, A., Mahle, J., Sewell, T., Karwacki, C. J. (2009) Ammonia vapor removal by Cu3(BTC)2 and its characterization by MAS NMR. J. Phys. Chem.
C 113, 13906-13917. https://doi.org/10.1021/jp902736z
[38] Porod, G. (1982) General theory. In: Kratky, O., Glatter, O. editors. Small angle X-ray scattering. Academic Press, New York, 17–51.
[39] Hendon, C.H., Walsh, A. (2015) Chemical principles underpinning the performance of the metal–organic framework HKUST-1. Chem. Sci. 6, 3674-3683.
https://doi.org/10.1039/C5SC01489A
[40] ChemTube3D – HKUST-1 Metal Organic Framework
http://www.chemtube3d.com/solidstate/MOF-HKUST-1.html (Accessed 20 September 2018).
[41] Castillo, J.M., Vlugt, T.J.H., Calero, S. (2008) Understanding water adsorption in Cu- BTC metal–organic frameworks. J. Phys. Chem. C 112 15934–15939.
https://doi.org/10.1021/jp806363w
[42] NIST Center for Neutron Research - Neutron scattering lengths and cross sections https://www.ncnr.nist.gov/resources/n-lengths/ (Accessed 20 September 2018).