0139–3006 © 2020 Akadémiai Kiadó, Budapest DOI: 10.1556/066.2020.49.4.14
EVALUATION OF PHYSICO-CHEMICAL COMPOSITION IN BULBS OF RED, YELLOW, AND WHITE ONION (ALLIUM CEPA
L.) GENOTYPES OF SUB-TROPICAL INDIA
I. K *, N. C , A.S. D and M. K
Punjab Agricultural University, Ludhiana, 141001-India (Received: 24 April 2020; accepted: 17 July 2020)
In this study, thirty onion (Allium cepa L.) genotypes grown in sub-tropical region of India were analysed for diff erent physico-chemical attributes. There were signifi cant diff erences among genotypes, and the onion genotypes showed a tendency to be classifi ed according to diff erent colours. The cultivars of the same colour exhibited similar tendencies in terms of accumulating most of the analysed components. About 1.78 fold variation in dry matter (%) and 2 fold variation in fresh weight per bulb were recorded among coloured onions. Red genotype D-888-B possessed maximum contents of TS and NRS, while the yellow coloured genotype POH-5 accumulated highest RS and lowest NRS contents. Maximum values of fructans (3.68 g/100 g DW), AIS (6 g/100 g DW), protein (10.61 g/100 g DW), and FAA (4.24 g/100 g DW) were also found in red coloured genotypes D-715-B, D-97-B, PR-305, and D-PS-121-B, respectively. Proline content in diff erent genotypes was found to vary about 6.9 fold. The correlation studies showed a positive relationship between most of the quality parameters. Our results suggested that red group genotypes were better than yellow and white groups for all the studied parameters except for RS, which makes red genotypes more suitable for processing purposes.
Keywords: coloured onions, biochemical parameters, correlation analysis
Onion (Allium cepa L.) is a bulbous vegetable, belonging to family Alliaceae, cultivated in temperate, tropical, and sub-tropical regions throughout the world. India is the second largest onion growing country in the world after China. Indian onions are famous for their pungency, which are consumed both within the country and exported to several countries as well. Onion genotypes are grouped into red, yellow, and white colours based on fl avonoid contents (R et al., 2017). These diff erent coloured onions have diff erent properties like fl avour, taste, degrees of pungency, etc.
Diff erent biochemical attributes contribute variably towards quality of onion bulb in these coloured types. Sugars contribute to organoleptic properties, sweetness, and are responsible for distinctive fl avour, aroma, and quality. Fresh weight and dry weight of onion are genotypic characteristics. Onion contains signifi cant amount of protein and is considered a high-energy food (B et al., 2013). Amino acids have important role in protein synthesis as well as fl avour and pungency development. Cysteine mainly supplies sulphur for most of the organic sulphur compounds in Allium. All these parameters are important for processing and export quality of bulbs (S , 1995). Onion contributes fl avour to food without signifi cantly raising the caloric content. It is also a good source of biologically active antioxidant components like phenolic compounds, fl avonoids, sulphur active compounds, and various minerals (V & S , 1999; P & S , 2016).
In India, onion cultivation is very important and the growing area is increasing because of favourable climatic and soil conditions, availability of suitable cultivars for diff erent
* To whom correspondence should be addressed.
Phone: +91 8968615353, +91 9988500406; e-mails: inderpalkaur06@gmail.com, inderpal-bcm@pau.edu
seasons and their production technology. The crop is grown in two seasons, i.e. Rabi and Kharif. There are few popular cultivars among the farmers in the subtropical regions of the country, but many other genotypes exist in the diff erent colour groups (red, yellow, and white), which have not been characterised yet. Therefore, the present investigations were undertaken to study the physico-chemical composition of thirty onion genotypes (21 red, 5 yellow, and 4 white). As onion holds a signifi cant place in Indian diet and markets, this data on diff erent onion genotypes will be useful for consumers, farmers, stakeholders, and vegetable breeders for selecting the promising ones among the red, yellow, and white onion genotypes for varied purposes like internal market, processing, and export.
1. Materials and methods
1.1. Trial location and experimental material
The experiment was conducted at Vegetable Research Farm, Department of Vegetable Science, PAU, Ludhiana (latitude 30° 53’ N, longitude 75° 48’ E; elevation 244 m), India during the year 2018. Ludhiana features humid sub-tropical climate with average maximum and minimum temperatures of 35.8 and 2.7 °C, respectively, and annual rainfall of 733 mm.
Thirty genotypes of onions comprising of 20 red ( D-PS-121-B, D-715-B, D-305-B, D-266-B, 65 B, D-31-B, D-4-10-B, D-888-B, Rec-1404, Rec-1410, PDR-1260, PR-10-853, PR-10- 367, PRO-6, Punjab Naroya, PDR-821, Rec-1417, PR-305, POH-2, and POH-3), 6 yellow (D-97-B, D-30-B, PBY10-214, POH-1, POH-4, and POH-5), and 4 white (D-73-B, D-48-B, PW-731035, and Punjab White) genotypes were grown. Planting was done at a spacing of 15 cm between rows and 7.5 cm between plants. The plants were furrow irrigated at 7–10 days intervals, and watering was stopped a fortnight before bulb harvesting. Farmyard manure (20 tonnes per acre) and fertilisers (containing 40 kg nitrogen, 20 kg phosphorus and 20 kg potassium, per acre) were applied to the plants. Whole farmyard manure, phosphorus, potassium, and half of nitrogen were applied before transplanting, and the remaining dose of nitrogen was applied 4 weeks after transplanting. Onions were harvested after maturity, when leaves dried down. The freshly harvested onions were cured in fi eld and transported to the Biochemistry laboratory of Department of Vegetable Science, Punjab Agricultural University for biochemical analysis.
1.2. Physical parameters
For calculating bulb weight, randomly fi ve onions with no visible defect were weighed, and the fi nal weight was calculated by the average of these fi ve in grams. Dry weight (%) was calculated by drying the blended onion samples in hot air oven at temperature of 60±5 °C for 48 hours with proper air circulation in triplicates.
1.3. Biochemical parameters
Outer dried scales were removed and coloured onion fl esh was cut into pieces, dried, and used to estimate the biochemical parameters. The samples were taken as 100 mg dried powder in triplicates. Total soluble sugars (g/100 g DW) of dried samples were estimated by the method described by D and co-workers (1956). Reducing sugars (g/100 g DW) were determined by method of S (1952). Alcohol insoluble solids (g/100 g DW) were extracted and estimated by method of M and H (1948). Fructan content (g/100 g
DW) was estimated by method provided by M R and S (1945). Total soluble protein content (g/100 g DW) in dried onions was determined by the method given by L and co-workers (1951). Free amino acid content was determined by method described by L and T (1966). Proline content was estimated as reported by B (1973).
1.4. Statistical analysis
Results were analysed by the Analysis of Variance using SAS version 9.3 (SAS Institute, Inc, 1992; Cary, NC, USA) with completely randomised design. Mean comparisons were performed by Tukey’s test with signifi cance eff ects P<0.05. Results were presented as mean±standard deviation for triplicates. The data was subjected to the Pearson correlation coeffi cient for the analysis of correlation between parameters.
2. Results and discussion
2.1. Dry weight (DW) and fresh weight (FW)
The results presented in Table 1A and 1B show that there was a signifi cant diff erence in the contents of dry matter (%) and fresh weight per bulb among the 30 onion genotypes. Dry weight ranged from 8.92 g (D-48-B) to 15.87 g (Punjab Naroya), while fresh weight ranged from 57.87 g (D-73-B) to 97.73 g (PR-10-853). The high level of variability could be due to genetic diff erences among the cultivars. A signifi cant diff erence was also observed among the three colour types (Table 2). Highest mean dry weight content and fresh weight per bulb were found in red group onions as 13.01 g and 72.68 g, respectively, while the lowest were recorded in the white group. The mean dry weight values obtained are similar to those reported in previous studies by J and co-workers (2001) and J -M and co-workers (2015). A and co-workers (2015) reported signifi cant diff erences in moisture content and fresh weight among the red and yellow coloured cultivars, having maximum values in red cultivars and minimum in yellow ones.
Table 1A and 1B Physico-chemical parameters in diff erent coloured onion genotypes
Colour Genotype DM FW TS RS NRS
Red D-PS-121-B 11.61±0.01jk 72.80±2.04ef 47.22±0.70ef 15.86±0.08bc 31.36±0.66defgh D-715-B 13.14±0.44ef 48.00±3.27n 51.09±0.64c 10.17±0.25l 40.92±0.62b D-305-B 10.14±0.03n 61.00±2.01kl 47.48±0.49de 14.11±0.25f 33.37±0.25cdef D-266-B 13.61±0.01de 80.87±3.24cd 42.91±0.32hijk 15.09±0.09e 27.83±0.38ij 65 B 10.56±0.03mn 69.87±1.41fghij 47.22±0.85ef 11.33±0.19jk 35.89±0.93c D-31-B 14.79±0.13b 71.33±0.96fg 55.52±0.48b 15.13±0.15e 40.39±0.62b D-4-10-B 14.83±0.05b 63.07±0.82hijkl 42.13±0.75ijk 12.50±0.13hi 29.63±0.85ghi D-888-B 13.56±0.1de 58.73±1.26lm 61.65±0.68a 14.26±.11f 47.39±0.79a Rec-1404 13.48±0.22de 70.73±0.93fgh 44.00±1.45ghij 12.40±0.1hi 31.60±1.4defgh Rec-1410 12.65±0.08fg 71.00±1.02fgh 50.39±0.5cd 10.95±0.2k 39.44±0.59b PDR-1260 11.95±0.09hij 80.00±1.8de 45.65±0.7efgh 15.54±0.17cde 30.11±0.87ghi PR-10-853 14.39±0.13bc 97.73±1.32a 47.17±0.37ef 13.44±0.1g 33.74±0.47cde
Colour Genotype DM FW TS RS NRS PR-10-367 14.42±0.36b 90.40±1.23ab 41.43±0.55ijk 15.70±0.1bcde 25.74±0.54jk PRO-6 11.60±0.07jk 79.67±1.57de 41.04±0.59jkl 16.26±0.12b 24.78±0.70jkl Pb. Naroya 15.87±0.07a 83.67±1.25 40.83±0.77kl 11.49±0.07jk 29.34±0.70 hi PDR-821 11.98±0.01hij 85.80±1.72bcd 41.87±0.59ijk 12.18±0.11i 29.69±0.70ghi Rec-1417 13.90±0.04cd 52.40±1.98mn 38.04±0.96lm 15.38±0.16cde 22.67±0.89klm PR-305 12.16±0.08ghi 70.60±2.24fghi 44.26±0.81fghi 9.96±0.31l 34.30±0.92cd POH-2 12.67±0.04fg 68.13±1.64fghijk 36.17±0.92mno 15.82±0.16bcd 20.35±1.07mn POH-3 13.74±0.11d 61.80±1.72kl 36.91±0.64mn 14.24±0.15f 22.68±0.68klm Yellow D-30-B 10.92±0.02lm 69.87±1.55fghij 43.52±0.59ghijk 13.16±0.18g 30.36±0.67fghi D-97-B 12.08±0.04hij 88.67±6.59bc 42.61±0.43hijk 9.91±0.18l 32.70±0.51cdefg PBY10-214 11.18±0.08kl 82.40±1.23bcd 46.09±1.21efg 15.19±0.10de 30.90±1.16efghi POH-1 11.87±0.07ij 63.20±1.07hijkl 40.96±1.26jkl 13.02±0.17gh 27.94±1.42ij POH-4 10.50±0.06 61.93±1.48jkl 41.43±0.86ijk 17.67±0.19a 23.76±0.78 kl POH-5 12.42±0.03gh 68.67±0.96fghijk 37.09±0.59mn 17.69±0.16a 19.40±0.71n White D-73-B 9.10±0.06o 57.87±1.55lm 30.57±1.21p 8.20±0.17m 22.37±1.12lmn
D-48-B 8.92±0.01o 61.47±1.88kl 33.70±1.12op 8.15±0.28m 25.54±0.88jkl PW-731035 10.14±0.07n 62.67±1.57ijkl 34.13±0.92no 8.37±0.18m 25.76±0.81jk Pb. White 10.12±0.08n 63.67±1.25ghijkl 34.26±0.48no 11.89±0.13ij 22.38±0.47lmn
MEAN 12.28±0.05 70.60±1.56 42.91±0.75 13.17±0.19 29.74±0.82
CD (5%) 0.51 8.06 3.13 0.66 3.21
DM: Dry matter (%); FW: fresh weight per bulb (g); TS: total soluble sugars (g/100 gm DW); RS: reducing sugars (g/100 gm DW); NRS: non-reducing sugars (g/100 g DW);
Values are mean ± SD of triplicates; values with diff erent letters in the same column are signifi cantly diff erent (Pp
< 0.05).
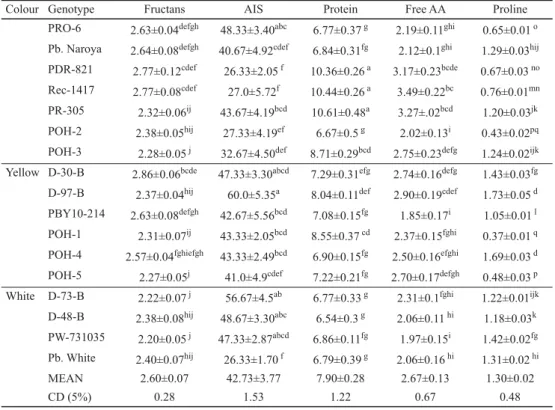
Table 1B Physico-chemical parameters in diff erent coloured onion genotypes
Colour Genotype Fructans AIS Protein Free AA Proline
Red D-PS-121-B 2.92±0.08bc 40.67±5.35cdef 9.92±0.45ab 4.24±0.25a 1.04±0.02 l D-715-B 3.68±0.1a 48.67 ±2.87abc 6.77±0.44g 2.38±0.26fghi 1.51±0.02ef D-305-B 2.39±0.07hij 49.67±3.40abc 8.48±0.22cde 2.09±.09ghi 1.49±0.02ef D-266-B 2.40±0.07hij 39.0±4.08cdef 7.20±0.35fg 3.48±0.09bc 1.34±0.02gh 65 B 2.58±0.03fghi 38.0±3.74cdef 7.29±0.27efg 3.53±0.25bc 2.35±0.02 b D-31-B 2.97±0.07bc 51.67±4.11abc 6.68±0.39 g 2.42±0.13fghi 2.58±0.01a D-4-10-B 2.61±0.05efgh 46.0±4.08abcd 7.00±0.3fg 2.30±0.11fghi 2.20±0.03 c D-888-B 3.11±0.05b 38.33±4.11cdef 6.54±0.28 g 2.33±0.11fghi 2.32±0.02 b Rec-1404 2.75±0.13cdef 51.67±3.68abc 10.22±0.28 a 3.62±0.15ab 0.97±0.03 l Rec-1410 2.91±0.05bcd 44.67±3.68bcd 7.64±0.22defg 2.32±0.11fghi 1.76±0.03 d PDR-1260 2.63±0.09defgh 50.0±4.08abc 9.62±0.24abc 3.19±0.22bcd 1.18±0.02 k PR-10-853 2.72±0.04cdefg 38.67±4.11cdef 10.10±0.31 a 3.58±0.19ab 0.79±0.01 m PR-10-367 2.47±0.05ghij 42.33±2.87bcde 6.99±0.22fg 2.14±0.13ghi 1.53±0.02 e
Colour Genotype Fructans AIS Protein Free AA Proline PRO-6 2.63±0.04defgh 48.33±3.40abc 6.77±0.37 g 2.19±0.11ghi 0.65±0.01 o Pb. Naroya 2.64±0.08defgh 40.67±4.92cdef 6.84±0.31fg 2.12±0.1ghi 1.29±0.03hij PDR-821 2.77±0.12cdef 26.33±2.05 f 10.36±0.26 a 3.17±0.23bcde 0.67±0.03 no Rec-1417 2.77±0.08cdef 27.0±5.72f 10.44±0.26 a 3.49±0.22bc 0.76±0.01mn PR-305 2.32±0.06ij 43.67±4.19bcd 10.61±0.48a 3.27±.02bcd 1.20±0.03jk POH-2 2.38±0.05hij 27.33±4.19ef 6.67±0.5 g 2.02±0.13i 0.43±0.02pq POH-3 2.28±0.05 j 32.67±4.50def 8.71±0.29bcd 2.75±0.23defg 1.24±0.02ijk Yellow D-30-B 2.86±0.06bcde 47.33±3.30abcd 7.29±0.31efg 2.74±0.16defg 1.43±0.03fg D-97-B 2.37±0.04hij 60.0±5.35a 8.04±0.11def 2.90±0.19cdef 1.73±0.05 d PBY10-214 2.63±0.08defgh 42.67±5.56bcd 7.08±0.15fg 1.85±0.17i 1.05±0.01 l POH-1 2.31±0.07ij 43.33±2.05bcd 8.55±0.37 cd 2.37±0.15fghi 0.37±0.01 q POH-4 2.57±0.04fghiefgh 43.33±2.49bcd 6.90±0.15fg 2.50±0.16efghi 1.69±0.03 d POH-5 2.27±0.05j 41.0±4.9cdef 7.22±0.21fg 2.70±0.17defgh 0.48±0.03 p White D-73-B 2.22±0.07 j 56.67±4.5ab 6.77±0.33 g 2.31±0.1fghi 1.22±0.01ijk D-48-B 2.38±0.08hij 48.67±3.30abc 6.54±0.3 g 2.06±0.11 hi 1.18±0.03k PW-731035 2.20±0.05 j 47.33±2.87abcd 6.86±0.11fg 1.97±0.15i 1.42±0.02fg Pb. White 2.40±0.07hij 26.33±1.70 f 6.79±0.39 g 2.06±0.16 hi 1.31±0.02 hi
MEAN 2.60±0.07 42.73±3.77 7.90±0.28 2.67±0.13 1.30±0.02
CD (5%) 0.28 1.53 1.22 0.67 0.48
Fructans (g/100 g DW); AIS: alcohol insoluble solids (g/100 g DW); protein: total soluble protein (g/100 g DW);
free AA: free amino acids (g/100 g DW); proline (g/100 g DW)
Values are mean ± SD of triplicates; values with diff erent letters in the same column are signifi cantly diff erent (Pp
< 0.05).
Table 2. Average biochemical contents of red, yellow, and white type onion groups
DM FW TS RS NRS Fructans AIS Protein Free AA Proline
Red 13.01a 72.68a 45.03a 13.41a 31.61a 2.68a 42.2c 8.23a 2.83a 1.38a Yellow 11.37b 69.21ab 41.82a 15.35b 26.47b 2.53ab 43.5b 7.41ab 2.43a 1.0a White 9.57c 61.42a 33.16b 9.15c 24.01a 2.30b 44.8a 6.74b 2.10b 1.28a
CD (5%) 0.87 7.71 3.63 1.43 4.08 0.20 0.74 0.91 0.41 0.49
DM: Dry matter (%); FW: fresh weight per bulb (g); TS: total soluble sugars (g/100 gm DW); RS: reducing sugars (g/100 gm DW); NRS: non-reducing sugars (g/100 g DW); fructans (g/100 g DW); AIS: alcohol insoluble solids (g/100 g DW); protein: total soluble protein (g/100 g DW); free AA: free amino acids (g/100 g DW); proline (g/100 g DW)
Values with diff erent letters in the same column are signifi cantly diff erent (P <0.05).
2.2. Total soluble sugars (TS), reducing sugars (RS) and non-reducing sugars (NRS) contents
The total soluble sugars, reducing sugars, and non-reducing sugars contents of 30 onion cultivars fell in the ranges of 30.57 to 61.65 g/100 g DW, 8.15 to 17.69 g/100 g DW, and 19.40 to 47.39, respectively (Table 1A). The maximum and minimum content of TS, RS, and
NRS was recorded in D-888-B and D-73-B, POH-5 and D-48-B, D-88-B and POH-5, respectively. A signifi cant variability was also observed among the three colour types (Table 2). Highest TS and NRS contents were found in red group onions as 45.03 g/100 g DW and 31.61 g/100 g DW, respectively, while the lowest was observed in white group onions as 33.16 g/100 g DW and 24.01 g/100 g DW, respectively. For RS content, the maximum average content (15.35 g/100 g DW) was found in yellow group, while the minimum (9.15 g/100 g DW) was recorded in white group. In previous studies it was observed that red coloured genotypes possessed higher sugar contents than yellow and white genotypes (J -M et al., 2015; A et al., 2015; and A et al., 2018). Similarly, D and co-workers (2007) reported that among two red and one white coloured cultivars, the red cultivar (N-2-4-1) had the highest contents of total reducing and non- reducing sugars as 16.1, 6.69 and 9.56 g/100 g, respectively, and white colour genotype (Phule Safed) had the lowest contents.
2.3. Fructans and alcohol insoluble solids (AIS)
The data presented in Table 1B reveal that among the 30 genotypes studied, the maximum fructans content was recorded in D-715-B (3.68 g/100 g DW), while the lowest amount was found in PW-731035 (2.20 g/100 g DW). J and co-workers (2001) and S and C (1989) reported higher contents of fructans than those found in our studies. There was a signifi cant diff erence among the studied genotypes with regard to contents of AIS, the highest detected in D-97-B (60.0 g/100 g DW) and the lowest in both PDR-821 and Punjab White (26.33 g/100 g). K and co-workers (2019) found that AIS content was in the range of 226.67–740.00 mg g–1 DW during storage of onion.
As far as the contents of fructans and AIS among diff erent colour groups of onion are concerned, the mean maximum content (2.68 g/100 g DW) of fructans was recorded in red group onions, while the mean minimum (2.30 g/100 g DW) was recorded in white type onions. On the contrary, the average content of alcohol insoluble solids was found to be maximum (44.8 g/100 g DW) in white group onions, while the minimum (42.2 g/100 g DW) was recorded in red type onions (Table 2).
2.4. Total soluble protein content, free amino acids (FAA) content, and proline content In this study, total soluble protein, free amino acids, and proline contents ranged from 6.54 (D-888-B) to 10.61 (PR-305) g/100 g, 1.85 (PBY10-214) to 4.24 (D-PS-121-B) g/100 g, and 0.37 (POH-1) to 2.58 (D-31-B) g/100 g DW, respectively (Table 1B). The results pertaining to total soluble protein content are in agreement with the previous studies that reported maximum total soluble proteins content in red coloured cultivars of onion followed by yellow coloured cultivars (A et al., 2015). A and co-workers (2018) reported protein content ranging 9.84–13.4 g/100 g DW in the studied onion cultivars. K and B
(1963) also found very little variation for free amino acid content in between the cultivars with content ranging from 4.7 to 5.6 g/100 g. Similar range of free amino acids in the yellow and white onion cultivars was also reported by I and co-workers (2016).
The average total soluble protein content among three colour types was found to be maximum in red type onions (8.23 g/100 g), while the minimum (6.74 g/100 g) was recorded in white type onions (Table 2). Similar trend was seen for the average contents of free amino acids and proline among diff erent colour groups, where the mean maximum amounts of free amino acids and proline were found in red group (2.83 g/100 g and 1.38 g/100 g, respectively),
while the mean minimum was recorded in white and yellow group onions (2.10 and 1.0 g/100 g, respectively). In earlier studies carried out under abiotic stress conditions versus non-stressed growing conditions, proline content was found to be in the range 3.57 to 7.63 μmol g–1 FW in non-stressed plants (H & C , 2015), which is similar to results reported in our study.
2.5. Correlation coeffi cient between biochemical parameters
Table 3 shows signifi cant maximum positive correlation (r=0.917) amongst all quality parameters recorded for TS and NRS, indicating a direct relationship between these parameters. Similarly, positive correlation between NRS and fructans (r=0.657), proline (r=0.516), and AIS (r=0.241) was recorded. For protein and free amino acids contents signifi cant positive correlation at P<0.01 (r=0.703) was observed. The proportion of high molecular weight compounds increased as dry matter increased, as evidenced by linear positive relationship between DW and TS (r=0.378), between DW and RS (r=0.306), and between DW and NRS (r=0.253), while a lesser relationship was observed between dry matter and protein, proline, and free amino acids. J and co-workers (2001) reported strong positive correlation between fructans and sugars of studied onion cultivars.
Table 3. Pearson correlation coeffi cients between diff erent parameters studied for thirty onion genotypes
DM FW TS RS NRS AIS Fructans Protein Free AA
FW 0.286 1
TS 0.378* 0.095 1
RS 0.306 0.176 0.209 1
NRS 0.253 0.024 0.917** –0.198 1
AIS –0.171 0.037 0.124 –0.287 0.241 1
Fructans 0.337 –0.125 0.687** 0.077 0.657** 0.015 1
Protein 0.143 0.209 0.062 0.055 0.040 –0.167 0.027 1
Free AA 0.167 0.212 0.188 0.142 0.130 –0.110 0.162 0.703** 1
Proline 0.161 0.030 0.465** –0.123 0.516** 0.339 0.264 –0.363* –0.209 DM: Dry matter (%); FW: fresh weight per bulb (g); TS: total soluble sugars (g/100 gm DW); RS: reducing sugars (g/100 gm DW); NRS: non-reducing sugars (g/100 g DW); AIS: alcohol insoluble solids (g/100 g DW); fructans (g/100 g DW); protein: total soluble protein (g/100 g DW); free AA: free amino acids (g/100 g DW); proline (g/100 g DW)
*: Correlation is signifi cant at the P<0.05 level (2-tailed)
**: Correlation is signifi cant at the P<0.01 level (2-tailed)
3. Conclusions
The study demonstrated that there are considerable diff erences for various physico-chemical attributes in red, yellow, and white onion genotypes. Among the three, red genotypes had higher fresh weight, dry weight, total soluble sugars, non-reducing sugars, protein, free amino acids, and proline contents; yellow coloured genotypes showed the highest reducing sugars content, while the maximum AIS content was found in white onion genotypes.
Therefore, these coloured genotypes could be exploited for a wide range of uses like fresh
consumption, processing, and export, and the study would be useful for consumers, farmers, as well as vegetable breeders.
*
The authors gratefully acknowledge the fi nancial support provided by Punjab Agricultural University, Ludhiana for conducting the experiment.
References
A , A.B., S , J., A , A , G., R , P., … M , M.C. (2018): Eff ect of three drying methods on the physicochemical composition of three varieties of onion (Allium cepa L.). J. Food Sci. Nutr., 1(2), 17–24.
A , A.A.A., H , W., Z , K. H , C. (2015): Evaluation of mineral element, sugars and proteins compositions in bulbs of eight onion (Allium cepa L.) varieties cultivated in Tunisia. IRJET, 2(4), 35–39.
B , L.S. (1973): Rapid determination of free proline content of water-stress studies. Plant Soil, 39, 205–207.
B , S., S , A., S , M.H., I , M.A., A , M.M., A (2013): Analysis
of the proximate composition and energy values of two varieties of onion (Allium cepa L.) bulbs of diff erent origin: A comparative study. IJNFS, 2(5), 246–253.
D , K., D , S. P , R. (2007): Assessment of bulb pungency level in diff erent Indian cultivars of onion (Allium cepa L.). Food Chem., 100, 1328–1330.
D , M., G , K.A., H , J.K., R , P.A. S , F. (1956): Colorimetric method for determination of sugars. Anal. Chem., 28, 350–356.
H , F. C , E. (2015): Comparison of salinity and drought stress eff ects on some morphological and physiological parameters in onion (Allium cepa L.) during early growth phase. Bulg. J. Agric. Sci., 21(6), 1204–1210.
I , E.M., C , P.F., S , V.M., L , L., S , M., … G , C.R. (2016): Variation for health-enhancing compounds and traits in onion (Allium cepa L.) germplasm. Food Nutr. Sci., 7, 577–591.
J , L., M -C , M.A., M , E., L -A , F.J. E , R.M. (2001): Eff ect of storage on fructan and fructo-oligosaccharides of onion (Allium cepa L.). J. Agr. Food Chem. 49, 982–988.
J -M , G., G , M. N -P , M. (2015): Comparison of chemical composition of selected cultivars of white, yellow and red onions. Bulg. J. Agric. Sci. 21(4), 736–741.
K , I., C , N. D , A.S. (2019): Evaluating changes in total soluble sugars, fructans and alcohol insoluble solids in onion (Allium cepa L.) genotypes during ambient storage conditions. Int. J. Chem. Studies, 7(5), 1435–1440.
K , J. B , R.A. (1963): An examination of the free amino acids of the common onion (Allium cepa). J.
Food Sci., 28, 298–304.
L , Y.P. T , T. (1966): An improved colorimetric determination of amino acids with the use of ninhydrin.
Anal. Biochem., 14, 71–77.
L , O.H., R , N.J., F , A.L. R , R.J. (1951): Protein measurement with the folin phenol reagent. J. Biol. Chem., 193, 265–275.
M R , W.L. S , M.C. (1945): The colorimetric determination of fructosan in plant material. J. Biol.
Chem., 157, 161.
M , J.C. H , K.C. (1948): Determination of alcohol-insoluble solids and sugar contents of vegetables.
Anal. Chem., 20(5), 472–474.
P , K. S , K. (2016): Bioavailability of micronutrients from plant foods: an update. Crit. Rev. Food Sci., 56, 1608–1619.
R , A.S., A , D.P.F., S -G , J. P -G , M.R. (2017): Onions: A source of fl avonoids. -in: J , G. (Ed) Flavonoids – from biosynthesis to human health. InTech, Doi:10.5772/
intechopen.69896.
S , P.W. (1995): Genetic analysis of pungency and soluble solids in long-storage onions. Euphytica, 82(1), 1–8.
S , M. (1952): Note on sugar determination. J. Biol. Chem., 195(1), 19–23.
S , M. C , J.A. (1989): Fructans in onion bulbs in relation to storage life. Can. J. Plant Sci., 69, 1327–1333.
V , I. S , S. (1999): Fructan: More than a reserve carbohydrate? Plant Physiol., 120, 351–359.