* Corresponding authorsat: Tel.: +36702242605 E-mail address: mahmoud.alramahi@mk.u-szeged.hu
Please cite this article as: AlRamahiM., Keszthelyi-Szabó G., Beszédes S. Coupling hydrothermal carbonization with anaerobic digestion: an evaluation based on energy recovery and hydrochar utilization. Biofuel Research Journal 31(2021) 1444-1453. DOI: 10.18331/BRJ2021.8.3.4
© 2021 BRTeam. All rights reserved.
Original Research Paper
Coupling hydrothermal carbonization with anaerobic digestion: an evaluation based on energy recovery and hydrochar utilization
Mahmood Al Ramahi
1,*, Gábor Keszthelyi-Szabó
2, Sándor Beszédes
31Doctoral School of Environmental Sciences, University of Szeged, H-6724 Szeged, Dugonics ter 13, Hungary.
2Gábor Dénes College, Fejér Lipót u. 70, 1119, Budapest, Hungary.
3Department of Process Engineering, Faculty of Engineering, University of Szeged, H-6725 Szeged, Moszkvai krt. 9, Hungary.
HIGHLIGHTS GRAPHICAL ABSTRACT
ARTICLE INFO ABSTRACT
Article history:
Received 7December2020 Received in revised form 7May2021 Accepted 23July2021
Available online1 September2021 Keywords:
Hydrothermal carbonization Anaerobic digestion Sludge biodegradability Steam gasification Liquid fertilizer Energy balance
This work evaluates the effect of hydrothermal carbonization (HTC) as a pretreatment and post-treatment technique to anaerobic digestion (AD) of dairy sludge. HTC's effect on AD was evaluated based on energy recovery, nutrient transformation, and hydrochar utilization. The first approach was executed by performing HTC under a range of temperatures before mesophilic AD. HTC optimal pretreatment temperature was 210 °C for 30 min residencetime. HTC pretreatment significantly increased the methane yield potential by 192%, the chemical oxygen demand removal by 18%, and the sludge biodegradability during AD by 30%. On the other hand, the application of HTC after AD (post-treatment) increased the total energy production, i.e., in addition to methane, a hydrochar with a caloric value of 10.2 MJ/kg was also obtained. Moreover, HTC post-treatment improved the steam gasification performance of the AD digestate. From the fertilizer quality point of view, HTC implementation generally boosted the concentrations of macro, micro, and secondary nutrients, suggesting its suitability for use as a liquid fertilizer.
Overall, the findings of the present study indicate that if bioenergy production were the main target, HTC post-treatment following AD would lead to the most promising outcomes.
➢Coupling hydrothermal carbonization (HTC) pretreatment with anaerobic digestion (AD) increased methane production by 192%.
➢HTC improved fuel quality and sludge biodegradability of dairy sludge.
➢A positive net energy of 4.28 kWh/kgsludge was obtained by HTC pretreatment.
➢HTC post-treatment to AD resulted in higher net energy gain (5.2 kWh/kgsludge).
➢HTC post-treatment improved steam gasification performance of AD digestate.
Journal homepage: www.biofueljournal.com
Please cite this article as: Al Ramahi M., Keszthelyi-Szabó G., Beszédes S. Coupling hydrothermal carbonization with anaerobic digestion: an evaluation based on energy recovery and hydrochar utilization. Biofuel Research Journal 31 (2021) 1444-1453. DOI: 10.18331/BRJ2021.8.3.4
Contents
1. Introduction
Anaerobic digestion (AD) is practiced worldwide to treat various organic waste streams, including waste sludge generated by the dairy industry. AD is a biological process in which the organic matter is converted into carbon dioxide (CO2) and methane (CH4). However, the high rates of fats, carbohydrates and proteins in dairy sludge limit its conversion rate during AD (Sayed et al., 1988).
Therefore, several studies have dealt with the aspect of coupling the biological treatment (i.e., AD) with several thermochemical processes such as hydrothermal carbonization (HTC) (Nuchdang et al., 2018) and biomass steam gasification to enhance the overall efficiency of AD (Yap et al., 2017; Pecchi and Baratieri, 2019).
HTC is a thermochemical process in which saturated water and vapor pressure are utilized to convert waste biomass into carbon-rich products (Wang et al., 2018). HTC is typically performed in temperature ranges between 150–350 °C and autogenous pressure (Mau et al., 2016). Hence, the water content stays in the aqueous phase during the HTC reaction, but its density and dielectric constant decrease. Similarly, the O and H contents of the feedstock decrease because of the intense dehydration and decarboxylation reactions taking place during the process (Wang et al., 2018). In addition to the solid residues, liquid and gas products are also formed during HTC. The liquid products obtained from the HTC of agricultural wastes (Benavente et al., 2015), sewage and dairy sludge (Danso-Boateng et al., 2015; Atallah et al., 2020), human excreta (Spitzer et al., 2018), and poultry litter (Mau et al., 2016) have been considered for different purposes, such as the production of nanostructured and adsorbent materials for soil amendment and bioenergy production. The characteristics of HTC products under different ranges of conditions have been extensively studied (Mau et al., 2016; Atallah et al., 2020).
HTC-derived hydrochar can easily be separated from its aqueous phase due to its high hydrophobic and friable properties (Wang et al., 2018).
Moreover, HTC hydrochar has a high mass and energy density and, therefore, is suitable for use as a clean energy source (Mau and Gross, 2018). Given its promising attributes, there has been a rapid surge in interest in HTC hydrochar for environmental and renewable energy applications.
For instance, Owsianiaki et al. (2018) highlighted the climate change mitigation potentials of hydrochar, whereas the application of hydrochar for soil amendment has also been well established (Reza et al., 2014). The energy conversion and gas emissions during hydrochar production and incineration have also been investigated previously (Mau and Gross, 2018;
Liang et al., 2020). Different approaches have been suggested to utilize HTC hydrochar and liquid products for bio-oil and syngas generation through fractionation and steam gasification (Gao et al., 2012; Gai et al., 2016). Moreover, HTC aqueous phase has been successfully used as a nutrient source for algal biomass production (Zeslase et al., 2019).
As mentioned earlier, HTC has been investigated previously as a post- treatment to AD to reduce the digestate volume and emissions (Aragón- Briceño et al., 2017) and maximize methane production (Nuchdang et al., 2018). However, more information is needed about the energetics of such a coupling to assess its self-sustainability and evaluate the effects of using HTC digestate in soil. Another domain requiring further research is using hydrochar as an enhancer in the AD process (Pecchi and Baratieri, 2019).
Steam gasification, on the other hand, converts (dry) biomass into syngas and char. In some cases, a non-negligible amount of aqueous phase is also 1. Introduction...
2. Materials and Methods...
2.1. Dairy sludge sampling and collection...
2.2. HTC reactor and experimental design...
2.3. Product recovery and analysis...
2.4. Physicochemical properties...
2.5. FTIR data processing...
2.6. Aqueous phase analysis...
2.7. Biomethane potential (BMP) test...
2.8. Theoretical BMP...
2.9. Anaerobic biodegradability...
2.10. Energy consideration...
2.11. Hydrochar steam gasification...
2.12. Statistical analysis...
3. Results and Discussion...
3.1. The effect of HTC conditions (severity factor) on hydrochar yield...
3.2. Solid-phase characteristics...
3.2.1. Physicochemical properties...
3.2.2. FTIR analysis...
3.3. Aqueous-phase composition...
3.4. Biogas production...
3.5. Energy balance and hydrochar utilization...
4. Conclusions...
Acknowledgments...
References...
Abbreviations
AD Anaerobic digestion
BMP Biomethane potential
BMPexp Experimental BMP
BMPth Theoretical BMP
DOC Dissolved organic carbon
FTIR Fourier transform infrared spectrometry
GC Gas chromatography
Gs Gasification
HHV Higher heating value
HRT Hydraulic retention time HTC Hydrothermal carbonization
ICP Inductively coupled plasma spectrometry SAR Sodium absorption ratio
TAN Total ammonia nitrogen
TC Total carbon
TN Total nitrogen
TOC Total organic carbon
TS Total solids
VS Volatile solids
VFAs Volatile fatty acids
1445 1446 1446 1446 1446 1446 1446 1447 1447 1447 1447 1447 1448 1448 1448 1448 1448 1448 1449 1450 1451 1451 1452 1452 1452
Please cite this article as: Al Ramahi M., Keszthelyi-Szabó G., Beszédes S. Coupling hydrothermal carbonization with anaerobic digestion: an evaluation based on energy recovery and hydrochar utilization. Biofuel Research Journal 31 (2021) 1444-1453. DOI: 10.18331/BRJ2021.8.3.4
produced. Syngas is the gaseous mixture containing CO, H2, CH4, CO2, H2O, and N2, while char is a solid carbonaceous material with a highly porous structure and ash (Benedetti et al., 2018). Similar to HTC, coupling AD with steam gasification has been evaluated previously, but in two approaches only.
In the first approach, steam gasification of the AD digestate was evaluated to increase the energy recovery and eliminate its emissions. While in the second approach, the injection of char inside the AD reactor to enhance the reactor performance was investigated (Pecchi and Baratieri, 2019). However, the main disadvantage of steam gasification is the energy required for drying the feedstock. Hence, hydrothermal pretreatment of biomass is suggested before steam gasification to enhance the mechanical dewaterability of sludge (Escala et al., 2013). In addition, hydrothermal treatment is expected to improve the syngas quality during steam gasification (Feng et al., 2018). To the best of our knowledge, there is yet no study on the HTC of AD digestate for the possibility of subsequent steam gasification.
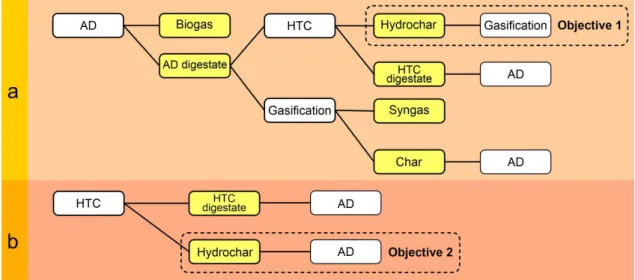
Therefore, the present study was set to investigate the feasibility of AD-HTC coupling and to evaluate the energetics of hydrochar incineration and steam gasification. The current research considered low HTC processing temperatures, short retention time, and the reuse of the process water for the sustainability of the process. In this respect, HTC of raw dairy sludge and AD digestate was performed at temperatures between 180 and 240 °C with 30 °C intervals. Then, the produced hydrochar was used as an enhancer in the AD process (raw sludge) or in the steam gasification process (digestate). Moreover, the effect of HTC pretreatment on sludge biodegradability was evaluated based on Boyle's equation. Figure 1 highlights the novelty of the present study by presenting the recently investigated combinations of AD and HTC and those assessed herein.
2. Materials and Methods
2.1. Dairy sludge sampling and collection
Dairy sludge was collected from a dairy factory located in Szeged, Hungary.
After sampling, sludge was dried at 105 °C for 24 h and stored in a desiccator before carryout the HTC and biomethane potential (BMP) experiments.
2.2.HTC reactor and experimental design
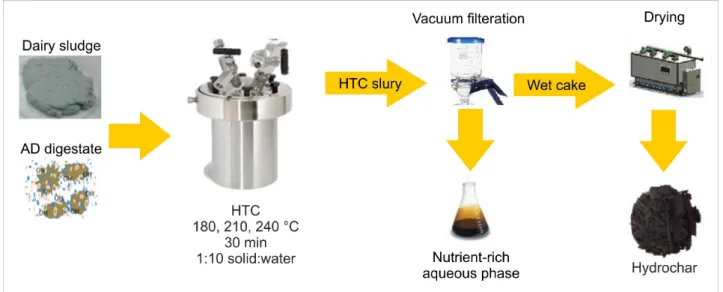
The samples (raw dairy sludge/digestate) were first dried at 105 °C for 24 h.
After that, they were mixed with double distilled water at 1:10 solid: water ratio and then introduced to 50 mL stainless steel tubular cylinder reactors. Each reactor consisted of a 27 mm diameter stainless steel pipe nipple and end cap.
The reactors were heated by immersing them in a preheated Paratherm HR heat transfer fluid (Paratherm, Conshohocken, PA). One reactor was equipped with
a temperature probe to provide a representative measurement of the temperature inside all reactors. Temperatures ranged between 180 and 240
°C with 30 °C intervals, and the reaction time was fixed at 30 min, not including the time needed to reach the desired reaction temperature. A schematic diagram of the HTC experimental setup is shown in Figure 2.
2.3. Product recovery and analysis
Following HTC, reactors were placed in an ice bath to quench the reaction. Hydrochar was produced at three different HTC temperatures;
180, 210, and 240 °C. All combinations of temperature were conducted in triplicates. The solid and aqueous phases were separated by vacuum filtration using a 0.45 µm glass fiber filter. Liquid products were collected in volumetric flasks, and the solid residues were allowed to dry overnight at 105 °C.
2.4. Physicochemical properties
Samples were weighed and oven-dried at 105 °C for 24 h and weighed again to determine the total solids (TS) and hydrochar yield (recovered mass). The organic matter content was determined by combustion in a muffle furnace at 450 °C for 6 h. The ash content was calculated as the remaining component after subtraction of the organic matter content. The elemental compositions of C, H, N, and S were determined with a FlashEATM1112 CHNS-O Analyser (Thermo Fisher Scientific Inc., UK).
The O content was calculated as the remaining component after subtracting the C, H, N, S, and the ash contents. The higher heating value (HHV) was measured using a bomb calorimeter (Thermo Fisher Scientific).
2.5. FTIR data processing
Dairy sludge and hydrochar were analyzed by Fourier transform infrared (FTIR) spectroscopy with a Nicolet 6700 Thermo equipped with a diamond smart ATR holder (Thermo Fisher Scientific Inc., UK) in the range of 4000–650 cm-1 through 36 scans. Spectra were corrected for background transmittance by subtracting the spectrum obtained with an empty holder.
FTIR data processing was performed after spectral acquisition using OPUS spectroscopy software (Bruker Optics). The analyzed absorbance spectral range was 3500 to 650 cm-1. Principal component analysis (PCA) was performed to correlate spectral data and chemical behavior. For the PCA, all FTIR spectra were vector normalized to minimize the noise and the effect of baseline shifts and highlight the changes attributed to the chemical composition.
Fig. 1. A schematic diagram representing the recently investigated combinations of anaerobic digestion (AD) and hydrothermal carbonization (HTC) and those evaluated in the current study. (a) HTC post-treatment and (b) HTC pretreatment.
Please cite this article as: Al Ramahi M., Keszthelyi-Szabó G., Beszédes S. Coupling hydrothermal carbonization with anaerobic digestion: an evaluation based on energy recovery and hydrochar utilization. Biofuel Research Journal 31 (2021) 1444-1453. DOI: 10.18331/BRJ2021.8.3.4
2.6. Aqueous phase analysis
The electrical conductivity (EC) and pH were measured using special electrodes and a pH 150 meter (Eutech Instruments). TS concentrations were determined according to the procedures employed in standard methods. The dissolved organic carbon (DOC) and total nitrogen (TN) contents were determined by a Torch (Teledyne Tekmar, USA) combustion (HTC) type analyzer equipped with a pressurized NDIR detector. K, Ca, Mg, Na, Fe, and Al concentrations were determined using an inductively coupled plasma (ICP) analyzer (PerkinElmer 7000DV ICP-OES Spectrometer; the power of the radiofrequency generator: 1450 W) according to the standard methods. The sodium absorption ratio (SAR) was calculated based on the Na, Ca, and Mg concentrations. Samples were stored in a freezer (-18 °C) before analyses.
2.7. Biomethane potential (BMP) test
Tests were conducted in 120 mL serum bottles to measure experimental BMP (BMPexp). Inoculum of goat manure digestate was added from an operational biogas digester. Bottles were filled with 60 mL of the substrate, then purged with N2 gas, sealed with rubber stoppers to ensure anaerobic conditions, and incubated at 37 °C. Using a pressure meter, gas pressure was measured and documented every 2-5 d (Lutron, PS-9302). Biogas production was determined following the ideal gas law.
Following gas collection, samples were stored in 10 mL glass vials sealed with a butyl valve and septum. Gas samples were analyzed for N2O, CH4, and CO2 using a CP-3800 gas chromatograph (Varian, Walnut Creek, CA) with a 0.53mm × 30mm Rt-Q-Bond column (Restec, Bellefonte, PA). CH4 and CO2
were analyzed with a thermal conductivity detector using He as the gas carrier (7 mL/min) with sample volumes of 200 μl for CH4 and CO2 analysis. The injector, column, and detector temperatures were 225 °C, 30 °C, and 225 °C, respectively. NH3 and H2S concentrations were estimated using a Kitagawa Gas Detector Tube System (Komyo Rikagaku Kogyo K. K., Japan) with a detection limit of 0.5 ppm and 100 ppm, respectively.
2.8. Theoretical BMP
The calculation of theoretical BMP (BMPth) values was based on the elemental composition of C, H, N, and O using Boyle's model (Eq. 1) (Aragón- Briceño et al., 2017).
BMPth = 22400 (n/2 + a/8 ˗ b/4 ˗ 3c/8) ÷ (12n + a + 16b + 14c) Eq. 1 where n, a, b, and c represent the molar fraction of C, H, O, and N, respectively.
2.9. Anaerobic biodegradability
The anaerobic biodegradability (BD) of each sample was calculated based on the values reported for BMPexp and BMPth, as shown in Equation 2 (Aragón-Briceño et al., 2017).
BD(%) = (BMPexp / BMPth) × 100 Eq. 2 2.10. Energy consideration
The energy recovered from the produced biogas was calculated using Equation 3 (Al Ramahi et al., 2020).
Rm = TM × CODs × Ym × (CE) × α Eq. 3 where Rm is the energy recovered (kWh), TM denotes the total mass of the sludge (kg), CODs stands for the chemical oxygen demand of sludge (kg), Ym is methane yield (m3/kgCOD), CE isthe combustion energy of methane (40 MJ/m3), and α, represents the conversion factor of the chemical energy of methane to electricity (35%).
The energy consumption for each HTC reaction was obtained considering the wet feedstock as a nonreactive mixture of water and dry solids. Hence, the energy required to heat the sludge was calculated as the sum of the energy needed to heat the water content and the dry feedstock separately (Eq. 4).
Qinput = mw(Hw,HTC ˗ Hw,298) + msCP(THTC ˗ 298) Eq. 4 where Qinput is the energy input for the HTC process; mw and ms are the water and solid contents of sludge, respectively. Hw,HTC and Hw,298 are the enthalpy of water at the final HTC temperature and 298 K, respectively. Cp
is the specific heat capacity of the dry feedstock, and THTC denotes the HTC process temperature.
The HTC output energy was calculated according to Equation 5.
Qoutput = mh . ∆H°c Eq. 5 where mh is the hydrochar mass and ∆H°c stands for the heat of combustion expressed by HHV.
All calculated values were normalized per kilogram of sludge, including the theoretical energy balance of the HTC process as described by Mau et al. (2016).
Fig. 2. Hydrothermal carbonization (HTC) experimental setup used in the present study.
Please cite this article as: Al Ramahi M., Keszthelyi-Szabó G., Beszédes S. Coupling hydrothermal carbonization with anaerobic digestion: an evaluation based on energy recovery and hydrochar utilization. Biofuel Research Journal 31 (2021) 1444-1453. DOI: 10.18331/BRJ2021.8.3.4
2.11. Hydrochar steam gasification
Hydrochar gasification was conducted in a laboratory-scale tubular quartz reactor. The length and inner diameter of the quartz tube were 1000 mm and 60 mm, respectively. An N2 line and steam generation kit were installed upstream of the tubular reactor, and a gas purification unit was installed downstream of the reactor. At the beginning of each test, 2 g of feedstock was placed onto a quartz boat. N2 gas at a 100 mL/min flow rate was fed into the reactor to produce an anoxic atmosphere. The quartz tube was heated to 1000 °C in the electric furnace, and then the steam generation kit was turned on. After 20 min, the quartz boat was injected into the heating zone of the tube by using a rod, and the nitrogen supply was switched off. The optimum conditions and syngas yield (Gp) were calculated as previously described by Gai et al. (2016).
2.12. Statistical analysis
Statistical analysis was performed to determine the differences between the parameters. One-way ANOVA was performed at a 95% confidence level, and when significant differences were detected, post hoc pairwise multiple comparisons were performed.
3. Results and Discussion
3.1. The effect of HTC conditions (severity factor) on hydrochar yield The HTC processing temperature is an essential parameter because of its effect on the physicochemical characteristics of the produced hydrochar.
Typically, carbonization occurs when the reaction mechanism shifts from ionic to free radical under saturation conditions (Savage, 1999). During HTC reactions, the increase in temperature causes a decrease in water viscosity, creating easier penetration into the porous media and subsequent degradation of the organics (Funke et al., 2010). In contrast, a pyrolysis-like process is likely to occur if the HTC processing temperature is insufficient to break up the major components (Yuan et al., 2019). Table 1 lists the data showing the effect of HTC processing temperature and residence time on the hydrochar yield. The hydrochar yield decreased significantly with increasing temperature because of the intense decomposition of the large molecules into smaller components (aqueous phase) and incondensable low molecular gaseous products (Wu et al., 2017). Hence, a higher fraction of the aqueous phase is expected to form at higher HTC temperatures, resulting in higher solubility and elemental extraction (Jin et al., 2019).
Nonetheless, HTC gaseous products (CO2 >80%, with small fractions of CH4, H2S and NH3) were formed intensely at high temperatures, as demonstrated in Figure S1 (Supplementary Data). At the same time, there was a notable decrease in CO2 concentrations with increasing temperatures, accompanied by a slight increase in CH4 and H2S concentrations (data not shown). Similar observations were also reported previously (Ghanim et al., 2016; Gao et al., 2018). Generally, high HTC processing temperatures lead to intense decomposition of the solid residue, which is expected to reduce the hydrochar yield (Wang et al., 2018).
Another important parameter that affects hydrochar yield formation is the HTC residence time. A long residence time is expected to enhance the severity of HTC reaction. Previous studies reported that HTC residence time had a similar but smaller effect on the hydrochar yield formation (Atallah et al., 2020). Therefore, HTC residence time can play an important role in determining the degrees of dehydration and decarboxylation during the process. Hence, controlling the HTC residence time was essential in the current work to produce hydrochar with desired characteristics and to minimize energy consumption. The effect of HTC temperature and residence time (combined) can be represented by the HTC severity factor (f), which can be calculated using Equation 6 (Spitzer et al., 2018).
f = 50 × t0.2 × e-3500/T Eq. 6
where t is the reaction time (s), and T stands for the reaction temperature (K).
The (f) values obtained from previous studies were calculated in this work to ensure a comprehensive comparison (Table 1). Generally, higher hydrothermal severity generates lower hydrochar yield except for the results obtained by Atallah et al. (2020). This phenomenon could be due to the high ash content in the feedstock (Smith et al., 2016). Another reason for the higher hydrochar yield is the intense polymerization of the soluble oxygenated fragments such as furfural and 5-hydroxymethylfurfural in severe HTC conditions, resulting in the formation of the secondary char, increasing the overall hydrochar yield (Kumar et al., 2011).
3.2. Solid-phase characteristics 3.2.1. Physicochemical properties
The results of the proximate and ultimate analyses of all (dried) samples are listed in Table 2. Proportions of the organic matter in dairy sludge were,
Table 1.
Comparison of the effects of temperature and residence time (severity factor) on hydrochar yield formation as reported by the previous studies and the present investigation.
Biomass Temperature (°C) Residence time (min) Severity factor (f) Water content (%) Hydrochar yield (%) Reference
Poultry litter
180
60
0.11
67
74.8
Mau et al. (2016)
200 0.16 60.7
220 0.21 58.1
250 0.32 46.1
Human excreta
180
120
0.13
75
69.2
Spitzer et al. (2018)
210 0.21 64.9
230 0.32 55.6
Dairy sludge
225
120
0.12 82 55
Atallah et al. (2020)
225 0.12 89 61
225 0.12 96 70
250
120
0.16 82 58
250 0.16 89 76
250 0.16 96 79
250
240
0.19 82 70
250 0.19 89 77
250 0.19 96 83
Dairy manure
200
240
0.09
95
58.3
Wu et al. (2017)
220 0.12 51.6
240 0.16 49.6
260 0.21 44.4
280 0.27 43.5
Dairy sludge digestate
180
30
0.10
91
50.3
This work
210 0.16 30.2
240 0.21 27.0
Dairy sludge
180 0.10 80.4
210 0.16 68.4
240 0.21 69.3
Please cite this article as: Al Ramahi M., Keszthelyi-Szabó G., Beszédes S. Coupling hydrothermal carbonization with anaerobic digestion: an evaluation based on energy recovery and hydrochar utilization. Biofuel Research Journal 31 (2021) 1444-1453. DOI: 10.18331/BRJ2021.8.3.4
on average, higher than those in the digestate. However, the N content in the digestate did not vary (P-value> 0.05), suggesting that most of N remained in the solid phase after AD. Presumably, N is bound to the cell wall proteins and interwoven with the structural carbohydrates and lignin (Wachendorf et al., 2009). In contrast, C content decreased significantly after AD. Anaerobes use C for cell growth and energy production, whereas N is consumed to synthesize amino acids, proteins, and nucleic acids. Theoretically, anaerobes consume C 30 times faster than N during AD (Al Ramahi et al., 2020). Similar to C, lower levels of H were detected in the digestate. However, the relative increase in C content after the HTC processing of the dairy sludge digestate was higher than that obtained from raw dairy sludge, indicating higher carbon recovery.
Similarly, HHV values increased significantly (P-value <0.05) in both substrates after HTC. However, not all of the energy released during HTC is stored in the produced hydrochar. Hence, hydrochar energy yield was calculated for both substrates to quantify the percentage of the energy recovered in the final product. The energy yield in the produced hydrochar ranged between 89-93% and 35-57% for raw dairy sludge and dairy sludge digestate, respectively. Higher energy recovery in raw dairy sludge-derived hydrochar could be attributed to lower mass losses during HTC. Lower mass losses in raw dairy sludge could be ascribed to the lower ash content and higher organic matter content than those in dairy sludge digestate (Table 2). The atomic ratios H/C and O/C for raw dairy sludge and dairy sludge digestate shifted from the upper right to the lower left in the Van Krevelen diagram as HTC proceeded (Fig. 3). This movement indicates higher intensities of dehydration than decarboxylation during HTC. This finding is consistent with that observed previously (Atallah et al., 2020). As seen in Figure 3, AD digestate evolved progressively from compositions falling within the range of biomass, peat, and lignite to a material that is closer in composition to coal.
Whereas raw dairy sludge shifted to the range of lignite as HTC advanced, indicating lower fuel quality. In summary, AD digestate hydrochars generated at 210 and 240 °C had H/C and O/C ratios of 0.6 – 1.0 and 0.15 – 0.2, respectively. These ratios for raw dairy sludge hydrochars were 0.8 - 1.2 and 0.22 – 0.27, respectively.
3.2.2. FTIR analysis
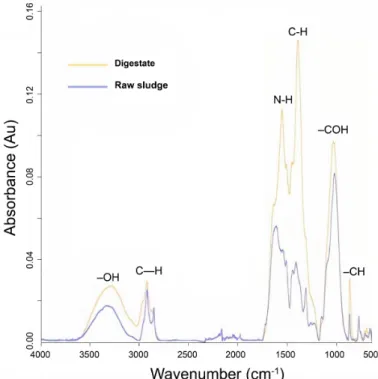
An FTIR spectroscopic analysis was performed to better understand the difference in the chemical compositions during HTC processing. The FTIR spectra at 210 °C are shown in Figure 4, with peaks identified based on the literature (Mursito et al., 2010; Li et al., 2011; Cao et al., 2013; He et al., 2013;
Liu et al., 2013).
a) The peak at 871 cm-1 is attributed to aromatic –CH out-of-plane bending vibrations. The relative intensity of this peak increased after HTC processing, indicating a continuous conversion of the aromatic structures during HTC.
Fig. 3. Van Krevelen diagram of hydrochar produced from dairy sludge and digestate with solid:water ratio of 1:10. Standard errors ranging from 0.001 to 0.04 for atomic H/C ratio and 0.07 to 0.093 for atomic O/C ratio.
b) The peak at 1051 cm-1 is typical to –COH band. The relative increase in the intensity of this peak during HTC is associated with a shrinking –COH bond in alcohols.
c) The peak at 1378 cm-1 is linked to C-H vibrations of alkyl and methyl groups. The relatively high intensity of this peak after HTC processing indicates that, as other components in the feedstock are degraded during HTC, methyl becomes more present.
d) The peaks at 1560 and 1650 cm-1 are linked to carboxylic acid derivatives, namely amides and amino acids. The relative increase in intensity in the digestate samples is attributed to the amide band, specifically Amide-I, out-of-stretching vibrations in the carbonyl group. A low-intensity shoulder was observed at 1650 cm-1assigned to Amide-II, which is derived mainly from bending vibrations of N- H. These adsorption peaks are typical of polypeptides, indicating the presence of proteins in the feedstock. However, as the two peaks are relatively wide, there may be an overlap with other carboxylic acid derivatives, including free carboxylic acid groups at neutral pH, representing C=O asymmetric stretching in carboxyl group and C=C vibrations.
e) The peaks at 2850 and 2970 cm-1 are attributedto aliphatic C—H stretching and aromatic C—H bending vibrations, respectively.
Table 2.
Proximate and ultimate analyses of dairy sludge and digestate (Standard errors are shown in parentheses).
Parameter Raw dairy sludge Digestate
Raw dairy sludge-char Digestate-char
180°C 210°C 240°C 180°C 210°C 240°C
Proximate analyses
Ash (%) 28a (3.2) 61.2b (6.1) 29.2a (1.8) 29.1a (2.5) 30.3a (3.3) 61.1b (1.6) 61.8b (2.0) 62.0b (1.4) Organic matter (%) 72a (8) 38.8b (0) 70.8a (7) 70.9a (1) 69.7a (9) 38.9b (8) 38.2b (11) 38.0b (3) Ultimate analyses
C (%) 37.5a (2.2) 18.8b (2.9) 44.2c (0.9) 54.0d (4.1) 56.4d (1.3) 29.9e (2.0) 31.1e (3.5) 31.6e (1.1)
H (%) 4.8a (0.0) 2.2b (0.1) 5.1a (0.1) 5.3a (0.0) 5.3a (0.0) 2.6b (0.0) 2.7b (0.0) 2.4b (0.0)
N (%) 1.7a (0.1) 1.5a (0.1) 2.1b (0.1) 2.4b (0.0) 2.4b (0.0) 4.1c (0.0) 3.5e (0.1) 3.5e (0.0)
S (%) 0.5a (0.0) 0.1a (0.0) 0.5a (0.0) 0.5a (0.0) 0.4a (0.0) 0.1a (0.0) 0.1a (0.0) 0.1a (0.0)
O (%) 27.9a (1.6) 14.3b (2.0) 23.5c (1.5) 21.8c (1.2) 21.1c (0.9) 12.6d (0.6) 8.2e (1.0) 6.5e (0.4) HHV (MJ/kg) 15.1a (1.3) 7.8b (0.6) 17.2c (0.9) 18.5c (0.9) 19.4c (1.1) 9.1d (0.2) 10.2d (1.9) 10.0d (1.1)
Energy yield1 - - 93% 89% 89% 57% 37% 35%
Energy densification2 - - 1.4 1.2 1.3 1.2 1.3 1.3
a,b,c,d
Statistical differences are indicated by different superscript letters.
(Mass of dry hydrochar × HHV of hydrochar)/(mass of initial dry substrate × HHV of substrate) ×100%. 1
HHV of hydrochar/HHV of the substrate.2
Please cite this article as: Al Ramahi M., Keszthelyi-Szabó G., Beszédes S. Coupling hydrothermal carbonization with anaerobic digestion: an evaluation based on energy recovery and hydrochar utilization. Biofuel Research Journal 31 (2021) 1444-1453. DOI: 10.18331/BRJ2021.8.3.4
Fig. 4. FTIR spectra of raw sludge and digestate after hydrothermal carbonization (HTC) processing at 210 °C.
f) The peaks between 3,200 and 3,400 cm-1 are probably derived from the (–OH) band in hydroxyl and carboxyl groups, indicating the existence of free and intermolecular bonded groups. The relative increase in the spectrum intensity at 3250 cm-1 is due to the intense dehydration at high HTC temperatures (Wu et al., 2017).
The comparison between FTIR spectra of carbonized raw sludge (pretreatment) and digestate (post-treatment) showed the same absorbance areas. However, differences in the intensity of some peaks were observed,
suggesting a remarkable increase in the soluble compounds for the carbonized digestate, which can be attributed to the microbial activities during the AD process.
3.3. Aqueous-phase composition
HTC aqueous phase characteristics are summarized in Table 3.
Concentrations of all parameters considered in the digestate were, on average, higher than those obtained in raw dairy sludge - except at 240 °C indicating higher elemental extraction. The relative decrease in concentrations at 240 °C is due to the significant loss in mass at high HTC processing temperatures (Mau et al., 2016). Initially, the aqueous phase of raw dairy sludge had a pH of 9.34, which decreased to 7.4 - 7.8 after HTC.
In contrast, dairy sludge digestate pH decreased from 7.44 to 5.4 - 5.6 after the treatment process. The decrease in pH corresponds to the formation of organic acids and CO2 during the carbonization of the cellulosic feedstock (Mau et al., 2016). The obtained values are similar to those obtained previously (Al Ramahi et al., 2020). The higher acidity in dairy sludge digestate occurred due to the higher degradation of sugars into short-chain carboxylic acids such as formic acid, acetic acid, propionic acid, and lactic acid. Identifying these compounds in the aqueous phase (Table S1, Supplementary Data) evokes the dehydration mechanism demonstrated in Figure 3. These results are consistent with those obtained previously by Pauline and Joseph (2020).
DOC concentrations increased after HTC (180° and 210°) to 765- 2,303 mg/L in raw dairy sludge and 3222- 4102 mg/L in dairy sludge digestate, respectively. In contrast, DOC concentrations tended to decrease at 240 °C owing to the significant losses in TC during HTC processing at high temperatures. Similar to TC, TN concentrations increased after HTC processing (Table 3). Similar observations were obtained for total ammonia nitrogen (TAN). TAN accounted for about 33-38% of TN with negligible concentrations of NO2 and NO3. Moreover, higher concentrations of macro, micro, and secondary nutrients were reported after HTC processing at 180 and 210 °C, suggesting the use of the HTC aqueous phase as a liquid fertilizer. The concentrations of most elements in the aqueous phase decreased at 240 °C owing to a higher absorption ratio in the porous structures of the produced hydrochar at high processing temperatures (Reza et al., 2013).
The concentration of P increased from 36.1 to 59.7 - 70.8 mg/L in raw dairy sludge after HTC. However, no significant increase was reported in the P and K concentrations of dairy sludge digestate after carbonization (P- value > 0.05). A fertilizer must also be a source of secondary and
Table 3.
Aqueous-phase characterization of dairy sludge and its digestate after HTC treatment (Standard errors are shown in parentheses).
Parameter Raw dairy sludge Digestate
Raw 180°C 210°C 240°C Raw 180°C 210°C 240°C
Total solids (TS) 452.5a (6.7) 153.0b (1.3) 226.3a (4.3) 235.8a (8.5) 222.2a (7.7) 122.4b (2.2) 104.0b (10.0) 106.0b (6.0)
pH 9.3a (0.0) 7.4b (0.0) 7.8b (0.0) 7.7b (0.0) 7.44c (0.0) 5.4d (0.0) 5.4d (0.0) 5.6d (0.0)
EC (mS/cm) 6a (0) 8a (0) 16b (0) 14b (0) 16b (0) 18b (0) 26c (0) 24c (0)
DOC* (mg/L) 822a (101) 1991b (78) 2303b (201) 1765b (49) 1987b (21) 3791c (39) 4102c (102) 3222c (56)
Macronutrient
TN (mg/L) 140a (61) 292b (18) 291b (25) 303b (33) 229b (06) 316b (24) 618c (20) 620c (14)
TAN (mg/L) 36a (5) 73b (6) 73b (5) 76b (0) 68b (2) 79b (0) 155c (1) 154c (1)
P (mg/L) 36.1a (1.0) 70.8b (8.7) 70.9b (11.1) 59.7b (9.9) 164.3c (14.4) 221.4c (13.2) 138.2c (21.1) 138.0c (12.3) K (mg/L) 252.9a (100) 299.1a (296) 268.9a (201) 250.8a (198) 309.5b (95) 322.2b (149) 312.1b (301) 298.1b (89) Secondary nutrients
Ca (mg/L) 43.0a (2.9) 44.2a (0.9) 54.0b (4.1) 56.4b (1.3) 139c (11) 144c (21) 111c (35) 116c (11)
Mg (mg/L) 50a (1.0) 151b (1.0) 153b (0.0) 153b (0.0) 199b (2.0) 226b (0.0) 270b (0.0) 249b (0.0)
S (mg/L) 21.5a (2.0) 21.0b (1.0) 24.0b (0.0) 24.0b (0.0) 52.0b (1.0) 41.0b (0.0) 35.0b (1.0) 35.0b (0.0) Micronutrients
B (mg/L) 1.0a (0.0) 0.5a (0.0) 0.5a (0.0) 0.4a (0.0) 1.0a (0.0) 0.1a (0.0) 0.1a (0.0) 0.1a (0.0)
Cl (mg/L) 143a (20.0) 235a (15.0) 218a (12.0) 211a (19.0) 266a (81.0) 226a (16.0) 282a (10.0) 265a (14.0)
Cu (mg/L) 32a (6) 17a (1) 18a (1) 19a (1) 85a (5) 19a (2) 10a (1.9) 10a (1.1)
Fe (mg/L) 21a (0) 15a (1) 13a (1) 12a (2) 30a (8) 18a (11) 18a (1) 19a (6)
Na (mg/L) 293a (35) 357a (17) 337a (11) 335a (16) 406b (11) 493b (13) 489b (41) 389c (29)
Zn (mg/L) 2.0a (0.1) 1.4a (0.1) 1.2a (0.0) 1.3a (0.0) 1.0a (0.0) 1.2a (0.3) 1.3a (0.0) 1.3a (0.2)
SAR* 7.2a 5.7a 5.9a 5.3a 5.2a 5.8a 5.7a 4.5a
a,b,c
Statistical differences are indicated by different superscript letters.
* DOC: Dissolved organic carbon, SAR: Sodium absorption ratio.
Please cite this article as: Al Ramahi M., Keszthelyi-Szabó G., Beszédes S. Coupling hydrothermal carbonization with anaerobic digestion: an evaluation based on energy recovery and hydrochar utilization. Biofuel Research Journal 31 (2021) 1444-1453. DOI: 10.18331/BRJ2021.8.3.4
micronutrients such as Cl, Mg, S, and Na. The concentrations of Cl ranged between 143 and 282 mg/L, whereas Mg and S concentrations were 50- 270 and 21.5- 52 mg/L, respectively. Moreover, the micronutrient Fe was detected at concentrations of 12- 30 mg/L. Low concentrations (1–2 mg/L) of Zn and B were also detected.
Raw dairy sludge aqueous phase salinity, represented by EC, increased from 6 mS/cm before HTC to 16 mS/cm after the process. A more distinct increase in EC was observed for dairy sludge digestate (26 mS/cm). In addition to salinity, SAR is another indicator for the potential use of the HTC aqueous phase as a liquid fertilizer. SAR can be determined by measuring the concentrations of Na relative to those of Ca and Mg. High Na concentrations can reduce infiltration in the soil clays and, consequently, increase runoff (Oster, 1994). However, the presence of Ca and Mg in HTC aqueous phase can mitigate this impact (Mau et al., 2016). The aqueous phase had a moderately high SAR. Hence, further investigation is required to determine the means to improve the characteristics of the aqueous phase and confirm that all nutrients are bioavailable. In addition, the advanced characterization of the aqueous phase intermediates and their degradation products is essential to detect any toxicity or microbial inhibition.
The composition and utilization of the HTC gaseous phase were problematic in the current work owing to analytical limitations. There is, therefore, a gap in the present study regarding the potential use of HTC gaseous products.
3.4. Biogas production
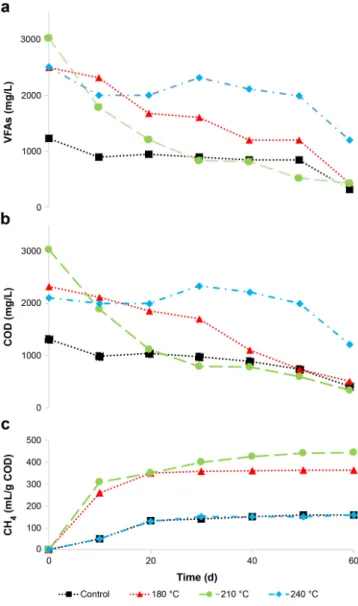
The experimental BMP assay results are shown in Figure 5. Methane production appeared to cease after 30 d. HTC processing at 180 °C did not improve the contributions of VFAs concentrations in the batch reactors. On the other hand, VFAs concentrations at 240 °C did not contribute to the methane yield potential, owing to the inhibitory effects caused by the toxic compounds generated at high HTC temperatures. However, VFAs concentrations at 210 °C contributed substantially to the methane yield potential. This assumption was supported by the significant increase in COD solubilization, indicating higher degrees of sludge biodegradability after HTC pretreatment. These results are consistent with those obtained previously for waste-activated sludge (Aragón- Briceño et al., 2017; Yuan et al., 2019).
Low methane generation in raw sludge samples is attributed to the lack of easily accessible substrates. In contrast, methane production after HTC pretreatment increased because of the higher availability of the organics.
However, hydrochar generated at 180 °C produced less methane than that produced at 210 °C because of insufficient pretreatment. Higher methane production after HTC is a clear indicator of the increased availability of the organic substrates within the biomass, which leads to an enhanced conversion of the organics during methanogenesis (methane production). The amount of methane produced in this study is expressed in terms of gCOD (Fig. 5). The theoretical methane potential results are listed in Table 4. BMPth was slightly higher than BMPexp except at 240 °C. Higher theoretical values were expected as Boyle's equation does not account for the nonbiodegradable organics.
Moreover, not all biodegradable organics present in the feedstock are consumed by the anaerobes (Qiao et al., 2011).
3.5. Energy balance and hydrochar utilization
To investigate whether the HTC of raw dairy sludge and digestate offers advantages when combined with AD, different valorizing approaches were evaluated in this study. The energy balance for all approaches evaluated in the current work is summarized in Table 5. The energy employed for HTC processing in these calculations was considered at 210 °C. Energy inputs for all HTC processing temperatures investigated in this work are given in the Supplementary Data (Table S2). As demonstrated in Table 5, the total energy production obtained by HTC post-treatment increased when the produced hydrochar was utilized in H2 production by steam gasification.
Steam gasification of raw dairy sludge hydrochar was performed at 900 °C, and steam to biomass (S/B) ratio of 1.5. A high S/B ratio shifts the reaction equilibrium towards H2 formation and promotes steam reforming of hydrocarbons. However, an S/B ratio higher than 1.5 decreased H2
concentration in the produced syngas (data not shown). This observation could be explained by the short residence time of the thermal and hydrocracking reactions with the increase in the steam flow rate (Klaas et al., 2015). Similarly, H2 content decreased gradually with increased temperatures exceeding 900 °C.
Fig. 5. Variations in (a)VFAs, (b)COD, and (c)cumulative CH4production during the BMP assay.
Table 4.
Comparisons of the experimental BMP and theoretical BMP (Boyle's Equation).
Sample BMPexp
(mL CH4/g COD)
BMPth
(mL CH4/g COD)
Biodegradability, Boyle's Equation (%)
Control 152± 30a 258± 49b 59
180°C* 363± 10a 378±77b 96
210°C 444±21a 500±72b 89
240°C 158±9a 546±119b 29
a,b Statistical differences are indicated by different superscript letters.
* The sample hydrothermally carbonized at 180oC.
This decrease is attributed to the fact that the reverse reaction during steam gasification is faster than the forward reaction at temperatures above 900 °C. A similar tendency was observed during steam gasification of municipal solid waste (Hu et al., 2015) and sewage sludge hydrochar (Gai et al., 2016).
The H2 content of hydrochar was significantly higher than that of dairy sludge digestate at the same temperature and for the same S/B ratio. Gas yield from steam gasification of dairy sludge digestate was about 1.02
Please cite this article as: Al Ramahi M., Keszthelyi-Szabó G., Beszédes S. Coupling hydrothermal carbonization with anaerobic digestion: an evaluation based on energy recovery and hydrochar utilization. Biofuel Research Journal 31 (2021) 1444-1453. DOI: 10.18331/BRJ2021.8.3.4
Nm3/kg compared to 1.543 Nm3/kg for hydrochar. HTC-derived hydrochar is rich in hydrophilic functional groups. Therefore, it is dispersed easily in the water molecules during steam gasification (Saw et al., 2012). Thus, a higher amount of unbound H atoms is generated during hydrochar steam gasification than raw digestate. Additionally, higher concentrations of inorganic matter and metals are expected to increase the evolution of gas composition during steam gasification (Domínguez et al., 2006). In other words, the increased metal content within the produced hydrochar resulted in higher gasification reactivity and conversion efficiency.
4. Conclusions
The AD and HTC processes have been studied for many decades, and their coupling was the focus of this work. The findings of this study indicated that HTC is suitable in combination with AD from an energy point of view. The physicochemical analyses demonstrated that hydrochar was rich in hydrophilic functional groups and catalytic metal components, favoring higher methane production during AD. Nonetheless, HTC of AD digestate (post-treatment) increased the overall energy recovery and enhanced the performance of biomass steam gasification. Moreover, higher concentrations of macro, micro, and secondary nutrients were detected in HTC aqueous phase, suggesting its suitability for use as a liquid fertilizer. However, the composition and utilization of HTC gaseous products were problematic in the current work, which should be the subject of future research. More information is also needed to assess HTC feasibility for use on an industrial scale.
Acknowledgments
This work was supported by the Hungarian Science and Research Foundation (OTKA contract number K115691) and the "Sustainable Raw Material Management Thematic Network – RING 2017", EFOP-3.6.2-16- 2017-00010 project. M. Al Ramahi especially thanks the support provided by the Stipendium Hungaricum Scholarship Programme. The authors would also like to thank Ibrahim Al-ToTonchi for proofreading the article.
References
[1] Al Ramahi, M., Keszthelyi-Szabó, G., Beszédes, S., 2020. Improving biogas production performance of dairyactivated sludge via ultrasound disruption priorto microwave disintegration. Water Sci. Technol. 81(6), 1231-1241.
[2] Aragón-Briceño, C., Ross, A.B., Camargo-Valero, M.A., 2017.
Evaluation and comparison of product yields and bio-methane potential in sewage digestate following hydrothermal treatment. Appl. Energy.
208, 1357-1369.
[3] Atallah, E., Zeaiter, J., Ahmad, M.N., Kwapinska, M., Leahy, J.J., Kwapinski, W., 2020. The effect of temperature, residence time, and water-sludge ratio on hydrothermal carbonization of DAF dairy sludge.
J. Environ. Chem. Eng. 8(1), 103599.
[4] Benavente, V., Calabuig, E., Fullana, A., 2015. Upgrading of moist agro- industrial wastes by hydrothermal carbonization. J. Anal. Appl. Pyrolysis.
113, 89-98.
[5] Benedetti, V., Patuzzi, F., Baratieri, M., 2018. Characterization of char from biomass gasification and its similarities with activated carbon in adsorption applications. Appl. Energy. 227, 92-99.
[6] Cao, J., Xiao, G., Xu, X., Shen, D., Jin, B., 2013. Study on carbonization of lignin by TG-FTIR and high-temperature carbonization reactor. Fuel Process. Technol. 106, 41-47.
[7] Danso-Boateng, E., Shama, G., Wheatley, A.D., Martin, S.J., Holdich, R.G., 2015. Hydrothermal carbonisation of sewage sludge:
effect of process conditions on product characteristics and methane production. Bioresour. Technol. 177, 318-327.
[8] Domínguez, A., Menéndez, J.A., Pis, J.J., 2006. Hydrogen rich fuel gas production from the pyrolysis of wet sewage sludge at high temperature. J. Anal. Appl. Pyrolysis. 77(2), 127-132.
[9] Escala, M., Zumbu, T., Koller, C., Junge, R., Krebs, R., 2013.
Hydrothermal carbonization as an energy-efficient alternative to established drying technologies for sewage sludge: a feasibility study on a laboratory scale. Energy fuels. 27(1), 454-460.
[10] Feng, Y., Yu, T., Chen, D., Xu, G., Wan, L., Zhang, Q., Hu, Y., 2018.
Effect of hydrothermal treatment on the steam gasification behavior of sewage sludge: reactivity and nitrogen Emission. Energy Fuels.
32(1), 581-587.
[11] Funke, A., Ziegler, F., 2010. Hydrothermal carbonization of biomass:
a summary and discussion of chemical mechanisms for process engineering. Biofuels, Bioprod. Biorefin. 4(2), 160-177.
[12] Gai, C., Guo, Y., Liu, T., Peng, N., Liu, Z., 2016. Hydrogen-rich gas production by steam gasification of hydrochar derived from sewage sludge. Int. J. Hydrogen Energy. 41(5), 3363-3372.
[13] Gao, Y., Liu, Y., Zhu, G., Xu, J., Yuan, Q., Zhu, Y., Sarma, J., Wang, Y., Wang, J., Ji, L., 2018. Microwave-assisted hydrothermal carbonization of dairy manure: chemical and structural properties of the products. Energy. 165, 662-672.
[14] Gao, Y., Wang, X.H., Yang, H.P., Chen, H.P., 2012. Characterization of products from hydrothermal treatments of cellulose. Energy. 42(1), 457-465.
[15] Ghanim, B.M., Pandey, D.S., Kwapinski, W., Leahy, J.J., 2016.
Hydrothermal carbonisation of poultry litter: effects of treatment temperature and residence time on yields and chemical properties of hydrochars. Bioresour. Technol. 216, 373-380.
[16] He, C., Giannis, A., Wang, J.Y., 2013. Conversion of sewage sludge to clean solid fuel using hydrothermal carbonization: hydrochar fuel characteristics and combustion behavior. Appl. Energy. 111, 257-266.
[17] Hu, M., Guo, D., Ma, C., Hu, Z., Zhang, B., Xiao, B., Luo, S., Wang, J., 2015. Hydrogen-rich gas production by the gasification of wet MSW (municipal solid waste) coupled with carbon dioxide capture.
Energy. 90, 857-863.
[18] Jin, H., Yan, D., Zhu, N., Zhang, S., Zheng, M., 2019. Immobilization of metal(loid)s in hydrochars produced from digested swine and dairy manures. Waste Manage. 88, 10-20.
[19] Klaas, M., Greenhalf, C., Ferrante, L., Briens, C., Berruti, F., 2015.
Optimisation of hydrogen production by steam reforming of chars derived from lumber and agricultural residues. Int. J. Hydrogen Energy. 40(9), 3642-3647.
Table 5.
Energy balance of all valorization approaches considered in this study.
Energy parameter (kWh/kg sludge) AD
(No treatment)
HTCpretreatment to AD
HTC post-treatment to AD (Incineration)
HTC post-treatment to AD (hydrochar steam gasification)
Energy content of methane 1.5 4.48 1.5 1.5
Energy applied for HTC processing1 - 0.2 0.2 0.2
Energy content of hydrochar (Incineration) - - 2.53 -
Energy applied for steam gasification of hydrochar - - - 0.73
Energy content of syngas - - - 4.63
Net energy production 1.5 4.28 3.83 5.2
1HTC optimum temperature at 210 °C.