An Integrated Intelligent Neuro-Fuzzy Algorithm for Long-Term Electricity
Consumption: Cases of Selected EU Countries
Ali Azadeh
1, Morteza Saberi
2, Vahid Nadimi
2, Mino Iman
3, Alireza Behrooznia
1 Department of Industrial Engineering, Center of Excellence for Intelligent-based Experimental Mechanics, College of Engineering, University of Tehran, Iran
2 Member of Young Research Club of Azad University, Tafresh Branch
3 Islamic Azad University, Tafresh Branch, Iran
E-mail: aazadeh@ut.ac.ir, mortezza_saber@yahoo.com, vahidndimi60@yahoo.com, alirezabehroznia@gmail.com
Abstract: This paper presents an adaptive-network-based fuzzy inference system (ANFIS) for long-term natural Electric consumption prediction. Six models are proposed to forecast annual Electric demand. 104 ANFIS have been constructed and tested in order to find the best ANFIS for Electric consumption. Two parameters have been considered in the construction and examination of plausible ANFIS models. The type of membership function and the number of linguistic variables are two mentioned parameters. Six different membership functions are considered in building ANFIS, as follows: the built-in membership function composed of the difference between two sigmoidal membership functions (dsig), the Gaussian combination membership function (gauss2), the Gaussian curve built-in membership function (gauss), the generalized bell-shaped built-in membership function (gbell), the Π-shaped built-in membership function (pi), psig. Also, a number for linguistic variables has been considered between 2 and 20. The proposed models consist of input variables such as: Gross Domestic Product (GDP) and Population (POP). Six distinct models based on different inputs are defined. All of the trained ANFIS are then compared with respect to the mean absolute percentage error (MAPE). To meet the best performance of the intelligent based approaches, data are pre-processed (scaled) and finally our outputs are post-processed (returned to its original scale). The ANFIS model is capable of dealing with both complexity and uncertainty in the data set. To show the applicability and superiority of the ANFIS, the actual Electric consumption in industrialized nations including the Netherlands, Luxembourg, Ireland, and Italy from 1980 to 2007 are considered. With the aid of an autoregressive model, the GDP and population by 2015 is projected and then with yield value and best ANFIS model, Electric consumption by 2015 is predicted.
Keywords: Natural Electric Demand; Long-Term prediction; Adaptive Network-based Fuzzy Inference System (ANFIS)
1 Introduction
Energy is a vital input for the social and economic development of any nation. The growth in energy consumption is intrinsically linked to the growth in the economy.
Various models have been applied to describe and forecast the evolution of energy demand. Chavez et al. (1999) used Box–Jenkins time-series analyses (ARIMA) models to formulate the forecasting model for the prediction of energy production and consumption in Asturias, Northern Spain. The trend in current and near future energy consumption from a statistical perspective by considering two factors, namely, increasing population and economic development, has been discussed by Kadoshin et al. [19].
Khotanzad et al. (2000) focused on the combination of artificial neural-network (ANN) forecasters with application to the prediction of daily natural gas consumption needed by gas utilities [20]. Saab et al. (2001) investigated different univariate-modeling methodologies for the forecasting of the monthly electric energy consumption in Lebanon [25]. Three univariate models were used, namely, autoregressive, autoregressive integrated moving average (ARIMA) and a novel configuration combining an AR(1) with a high pass filter.
An oil and gas supply model (OGSM) waa solved and the projections of oil and natural gas supply and demand to the year 2020 for Canada were presented in (Jai Persaud and Uma Kumar, 2001). Chow (2001) has discussed the sectoral energy consumption in Hong Kong for the period 1984-97 with special emphasis on the household sector [9]. Ediger and Tatlldil (2002) used a semi-statistical technique to formulate the forecasting model to predict the primary energy demand in Turkey and analysis of cyclic patterns. Reddy and Balachandra (2003) looked at various factors that influence the energy demand in India and developed the energy and environmental outlook for the year 2010. This was done by developing an integrated mathematical model incorporating various factors such as GDP and population growth.
The model presented in Siemek et al. (2003) estimates natural-gas demand, based on the average trend of economic development; the model considered the natural production/demand maxima of energy carriers. The prognosis was loaded with an error resulting from the use of average data related to yearly increases of the national gross product [27]. Gorucu et al. (2004) trained the ANNs to decide the optimum parameters to be used in forecasting gas consumption for short-term applications [13]. Gorucu and Gumrah (2004) forecasted short term gas consumption by multivariable regression analysis for the capital city of Ankara, Turkey [14].
Gutierrez et al. (2005) examined the application of a Gompertz-type innovation diffusion process for stochastic modeling and capturing the growth process of natural-gas consumption in Spain [15]. Sanchez-Ubeda and Berzosa (2007) Forecasted industrial end-use natural gas consumption in a medium-term horizon
(1-3 years) with a very high resolution (days) based on a decomposition approach [26]. The forecast was obtained by the combination of three different components:
one that captures the trend of the time series, a seasonal component and a transitory component. Parikh et al. (2007) estimated demand projections of petroleum products and natural gas in India [22]. They considered GDP and population as inputs of their NG estimation model.
Azadeh et al. forecasted electrical consumption by the integration of a neural network, a time series and ANOVA [1]. They found that ANN had better estimated values for total electricity consumption. Azadeh et al. developed an integrated artificial neural network and genetic algorithm framework to predict electrical energy consumption [2]. Azadeh and Tarverdian proposed an integrated approach based on genetic algorithm, computer simulation and design of experiments for forecasting electrical energy consumption [3]. Azadeh et al.
presented an integrated fuzzy system, data mining and a time series framework to estimate and predict electricity demand for seasonal and monthly changes in electricity consumption in developing countries such as China and Iran [4].
Azadeh et al. (2008b) employed an artificial neural network (ANN) approach for annual electricity consumption in high energy consumption industrial sectors [5].
Azadeh et al. developed an integrated algorithm for forecasting monthly electrical energy consumption based on an artificial neural network (ANN), computer simulation and a design of experiments using stochastic procedures [6]. Azadeh et al. (2009) proposed a new hybrid ANFIS computer simulation for improvement of electricity consumption estimation [9]. Yoo et al. estimated households’ demand function for natural gas by applying a sample selection model using data from a survey of households in Seoul [30].
In this study we estimate long-term Electric demand by employing adaptive neuro fuzzy inference systems. We present six models to forecast yearly NG demand in Iran. The ANFIS is capable of dealing with uncertainty and complexity in the given data set and thus provides a better solution and estimation regarding this valuable commodity.
2 Methodology
Because of the changeable nature of electricity demand, the use of conventional methods may not give us accurate results. Thus, we employ adaptive network based fuzzy inference systems (ANFIS) to alleviate this problem. The main structure of the intelligent approach is explained in the following.
The algorithm has the following basic steps:
Step 1: Determine the inputs of the model. Considering previous studies, the most important variables that have considerable impact on gas consumption are considered.
Step 2: Collect a data set in all available previous periods for each of the input variables and output variable. In addition, all of inputs and output data are scaled and normalized using a normalization method.
Step 3: Divide the data into two sets, one for estimating the models, called the train data set, and the other one for evaluating the validity of the estimated model, called the test data set. Usually the train data set contains 70% to 90% of all data and the remaining data are used for the test data set [15].
Step 4: This step is concerned with running and estimating all of the plausible ANFIS models regarding two main parameters. The type of membership the function and number of linguistic variables are two mentioned parameters.
Step 5: The models’ prediction capability is evaluated in this step through MAPE.
As input data used for the model estimation have different scales, the MAPE method is the preferred method to estimate relative errors. Considering the value of MAPE, the best ANFIS is selected in each case in order to predict gas consumption.
Step 6: The value of the input variables in the coming periods are predicted by using the Auto regressive model.
Step 7: The yield values are fed to the selected ANFIS that is determined in step 5. Finally, the value of gas consumption (scaled) in each coming year is calculated by selected ANFIS and the values of the input variables that are fed to ANFIS.
Finally, with post processing, the gas consumption predicted value for each year is calculated in its original scale and is suitable for analysis and usage in decision- making.
The significance of the proposed ANFIS for long term NG demand prediction is five fold. First, it uses pre-processing and post-processing approaches to eliminate possible noise. Second, it identifies the best ANFIS model based on minimum MAPE. Third, it considers standard input variables of long term Electric demand estimation. Fourth, it provides a more accurate solution than previous approaches (such as conventional regression) because it uses ANFIS, which uses adaptive neural modeling and fuzzy logic. This efficiently handles uncertainty, noise, and non-linearity in the given data set and provides the optimum solution. Fifth, it is applicable for gas consumption prediction in coming years. Figure 1 depicts the steps of the proposed ANFIS approach.
Figure 1
The proposed ANFIS approach for Long-term gas consumption forecasting
2.2 Adaptive Neuro-Fuzzy Inference System (ANFIS)
Neuro-fuzzy modeling refers to the way of applying various learning techniques developed in the neural network literature to fuzzy modeling or a fuzzy inference system (FIS) [8, 17]. A neuro-fuzzy system, which combine neural networks and fuzzy logic, have recently garnered a lot of interest in research and application.
The neuro-fuzzy approach has added the advantage of reduced training time, not only due to its smaller dimensions but also because the network can be initialized with parameters relating to the problem domain. Such results emphasize the
Step 6 Step 5 Step 3
Step 4 Step1
Selecting the best ANFIS model through MAPE criteria Divide data into training and test data sets
Running and estimating all of the plausible ANFIS
Future projection of input variables using autoregressive model in coming years
Determine the inputs of model
Step2 Collect data set in all available previous periods
Scale all of the data using normalization method
Step 7
Gas consumption prediction using selected ANFIS and the results of step 5; Rescaled the value of predicted gas
consumption using post-processing methods
benefits of the fusion of fuzzy and neural network technologies as it facilitates an accurate initialization of the network in terms of the parameters of the fuzzy reasoning system. Various types of FIS are reported in literature [21, 28, and 29]
and each is characterized by their consequent parameters only.
A specific approach in neuro-fuzzy development is the adaptive neuro-fuzzy inference system (ANFIS), which has shown significant results in modeling nonlinear functions (Jang et al., 1997). ANFIS uses a feed forward network to search for fuzzy decision rules that perform well on a given task. Using a given input-output data set, ANFIS creates a FIS whose membership function parameters are adjusted using a back propagation algorithm alone or a combination of a back propagation algorithm with a least squares method. This allows the fuzzy systems to learn from the data being modeled.
Consider a first order Takagi-Sugeno fuzzy model with a two input (x,y), one output system having two membership functions for each input. A first-order Sugeno fuzzy model has two rules:
• Rule1: If x is A1 and y is B1, then f1 = p1x + q1y + r1
• Rule2: If x is A2 and y is B2, then f2 = p2x + q2y + r2
Layer 1: Then, the functioning of ANFIS is a five-layered feed-forward neural structure, and the functionality of the nodes in these layers can be summarized as:
( ) 3 , 4
2 , 1 )
(
, 2
1 , 1
=
=
=
=
−
y for i
o
i for x
o
i i
B i
A i
μ μ
(3)
Layer 2: Where x or y is the input to the node, Ai or Bi-2 is a fuzzy set associated with this node. At the first layer, for each input, the membership grades in the corresponding fuzzy sets are estimated. O1,i is the membership grade of a fuzzy set (A1,A2,B1,B2). At the second layer, all potential rules between the inputs are formulated by applying fuzzy intersection (AND). The product operation is used to estimate the firing strength of each rule.
), ( )
, (
2 w x y
o i = i =
μ
Ai ×μ
Bi i= 1, 2 (4)Layer 3: The third layer is used for estimation of the ratio of the ith rule's firing strength to the sum of all rule's firing strengths.
2 , 1
2 1 ,
3 =
= +
= i
w w w w
o i i i (5)
Layer 4:
)
, (
4i wifi wi pix qiy ri
o = = + + (6)
Where
w
i is the output of layer 3 and {pi, qi, ri} is the parameter set. Parameters in this layer will be referred to as consequent parameters.Layer 5: The final layer computes the overall output as the summation of all incoming signals from layer 4.
Overall output =
∑
∑
=∑
=
i i
i i i
i i
i
i w
f w f
w
o5, (7)
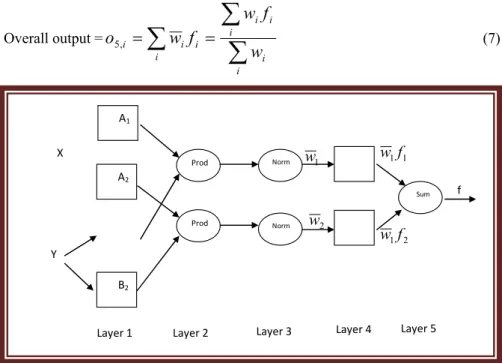
Figure 2
ANFIS structure with two inputs
Figure 2 shows the structure of the explained ANFIS. Optimizing the values of the adaptive parameters is of vital importance for the performance of the adaptive system. Jang et al. (1997) developed a hybrid learning algorithm for ANFIS which is faster than the classical back-propagation method to approximate the precise value of the model parameters. The hybrid learning algorithm of ANFIS consists of two alternating phases: (1) gradient descend, which computes error signals recursively from the output layer backward to the input nodes, and (2) the least squares method, which finds a feasible set of consequent parameters. We observe that, given fixed values of elements of premise parameters, the overall output can be expressed as a linear combination of the consequent parameters. The ANFIS architecture is not unique. Some layers can be combined and still produce the same output. In this ANFIS architecture, there are two adaptive layers (1, 4).
Layer 1 has three modifiable parameters (ai, bi and ci) pertaining to the input MFs.
These parameters are called premise parameters. Layer 4 has also three modifiable
f
2 1f w
1 1f w
w2
w1
A1
A2
B2
Prod
Prod
Norm
Norm
Sum
Layer 1 Layer 2 Layer 3 Layer 4 Layer 5 X
Y
parameters (pi, qi and ri) pertaining to the first order polynomial. These parameters are called consequent parameters. Figure 3 presents the structure of the proposed ANFIS for long term consumption. The reader should note that only two out five input layers are illustrated (population and demand of previous year) and because of redundancy the remaining three are only stated in the figure. Moreover, their operation are the same as the two shown inputs.
Figure 3
The structure of ANFIS model for long term Electric consumption estimation and forecasting
3 The Case Study
The proposed algorithm is applied to 27 set of data which are the annual electricity net consumption in industrialized nations which are the Netherlands, Luxembourg, Ireland, and Italy from 1980 to 2006. The proposed algorithm is applied to the data set as follows.
3.1 Step 1
Population and Gross Domestic Product (GDP) are considered as the input variables of the ANFIS in the present study.
Population
Electric Consumption
Input layer Input membership function layer
Output Layer Rule
layer
Output membership function l
GDP …
3.2 Step 2
As regards the input variables (population & GDP) that are determined in step 1 and the output variable (electricity consumption), the related data are drawn from the World Bank Development Indicators, 2008, the World Bank. The raw data with respect to the two independent variables for the Netherlands, Luxembourg, Ireland, and Italy are shown in Tables 1 and 2.
Table 1
Raw data, Luxembourg, Italy1
1 Source: The data are drawn from World Bank Development Indicators, 2008, World Bank.
Year Luxemb ourg
Populati on (Million
s)
GDP (per capita)
Electric consumpti
on Italy Population (Millions)
GDP (per capita)
Electric consumption
1980 0.36 10.69 3.709 56,47 1152,10 165,849
1981 0.37 10.63 3.582 56,52 1161,10 164,273
1982 0.37 10.75 3.618 56,56 1168,43 166,813
1983 0.37 11.08 3.721 56,65 1182,87 165,992
1984 0.37 11.076 3.947 56,72 1215,50 175,4
1985 0.37 12.10 3.998 56,75 1251,66 179,513
1986 0.37 13.06 4.034 56,76 1283,27 184,902
1987 0.37 13.35 4.12 56,75 1321,58 194,685
1988 0.38 14,73 4.037 56,76 1373,76 187,88
1989 0.38 16.18 4.365 56,76 1413,21 213,1269
1990 0.38 16.53 4.433 56,77 1441,11 220,2536
1991 0.39 17.55 4.702 56,77 1461,14 225,4425
1992 0.39 18.33 4.477 56,86 1472,26 230,9819
1993 0.40 19.93 4.588 57,05 1459,25 230,4566
1994 0.40 20.77 4.968 57,20 1491,46 237,8341
1995 0.41 21.51 5.329 57,30 1534,02 244,9667
1996 0.42 22.23 5.47 57,39 1550,78 247,6424
1997 0.42 24.08 5.47485 57,51 1582,21 254,9867
1998 0.43 25.74 5.621 57,58 1610,59 262,7742
1999 0.43 27.75 5.772 57,63 1637,39 269,4803
2000 0.44 30.26 5.995 57,75 1686,95 281,1846
2001 0.44 30.73 5.94895 57,87 1716,71 287,0337
2002 0.45 31.49 5.87395 57,95 1723,29 293,7765
2003 0.46 32.41 6.168 58,03 1727,67 298,1345
2004 0.46 33.88 6.4995 58,09 1748,83 294,0081
2005 0.47 35.25 6.315 58,13 1750,70 309,5107
2006 0.47 37.43 6.74795 58,16 1782,93 316,2999
Table 2
Raw data for Netherland, Ireland
3.3 Step 3
The 28 rows of data are divided into 24 training data (1980-2003) sets and 4 test data sets (2004-2006). According to our problem, the extrapolation and prediction ability of ANN should be calculated; therefore the data for test use chosen of the period which is closer to the last year (2004- 2006).
Year Nether-
land Population (Millions)
GDP (per capita)
Electric consumption Ire-
land Population (Millions)
GDP (per capita)
Electric consumption
1980 14.14 348.20 59.889 3.40 53.98 8.640
1981 14.25 346.42 59.317 3.44 55.77 8.527
1982 14.31 342.39 58.087 3.48 57.05 8.688
1983 14.36 348.23 59.24 3.50 56.91 8.626
1984 14.42 359.69 61.153 3.53 59.38 8.868
1985 14.49 370.77 62.111 3.54 61.22 9.691
1986 14.57 380.97 63.044 3.54 60.95 9.957
1987 14.67 386.37 65.841 3.54 63.80 10.829
1988 14.76 396.50 69.312 3.53 67.13 10.769
1989 14.85 415.07 71.512 3.51 71.03 11.523
1990 14.95 432.13 72.781 3.51 77.04 12.134
1991 15.07 441.93 75.832 3.53 78.53 12.698
1992 15.17 450.88 78.05995 3.56 81.15 13.46675
1993 15.27 454.32 79.4566 3.58 83.34 13.80225
1994 15.38 468.96 82.14895 3.60 88.14 14.39405
1995 15.46 482.02 84.2162 3.61 96.86 15.0712
1996 15.53 496.67 87.34025 3.64 106.69 16.0523
1997 15.60 515.74 89.34798 3. 67 116.30 16.87472
1998 15.70 538.17 92.6172 3.71 126.35 17.83555
1999 15.80 559.67 94.96385 3.75 140.60 18.899
2000 15.91 579.08 99.1732 3.79 155.11 20.377
2001 16.02 587.34 101.3283 3.84 164.43 21.031
2002 16.12 590.68 102.5648 3.88 174.51 21.94
2003 16.22 585.49 103.7684 3.92 180.89 22.5353
2004 16.32 593.91 106.7292 4.97 189.70 23.28025
2005 16.41 603.00 108.1612 4.02 198.53 24.089
2006 16.49 621.12 109.5509 4.06 209.92 25.674
3.4 Step 4
Two parameters have been considered in the construction and examination of plausible ANFIS models. The type of membership function and the number of linguistic variables are two mentioned parameters. Six different membership functions are considered in building the ANFIS, as follows: a built-in membership function composed of the difference between two sigmoidal membership functions (dsig), the Gaussian combination membership function (gauss2), the Gaussian curve built-in membership function (gauss), The generalized bell-shaped built-in membership function (gbell), the Π-shaped built-in membership function (pi), and the Trapezoidal-shaped built-in membership function (trap). Also, the number of linguistic variables have been considered as between 2 and 20. MATLAB software has been used to Running ANFIS in the present study.
3.5 Step 5
The architectures which are shown below have minimum MAPE among all of the other architectures. The architectures with the minimum of MAPE are shown below. Table 3 presents the structures of long-term models. MF stands for Membership Function in the ANFIS approach.
Table 3
The results of MAPE for the best ANFIS model for each country
Countries Number of MF's MF Type MAPE (%)
Italy 2 gaussmf 0.014
Luxembourg 2 gauss2mf 0.02
the Netherlands 2 Trapmf 0.007
Ireland 3 gbell 0.012
3.6 Step 6
In order to forecast with the ANFIS, there is a need to forecast the independent variables population and GDP. In addition, previous studies used time series to forecast the independent variables [1]. The future projection for each independent variable is performed by autoregressive model that is one of main models in the time series area.
3.6.1 Data Structure
AR (1) is considered thetime series model because of the shortage of annual data.
Therefore the time series model for independent variable Xi is:
Xi = a Xi-1+b (15)
Tables 4 and 5 show coefficients estimation of models for Luxembourg-Italy and the Netherlands - Ireland, respectively.
Table 4
Models information in Luxembourg, Italy
Luxembourg a B Italy A B
GDP
1.01387 0.646877 0.977829 0.44674
Population 0.991206 0.006972 0.99747 0.203405 Table5
Models information in Netherland, Ireland
Netherland A b Ireland A b
GDP 0.996963 0.20975 0,97 0,04
Population 0.989339 0.245892 0,92 0,08
3.7 Step 7: Electric Future Projection
According to the data structure, the values of the independent variables from 2008 to 2015 are fed to the selected ANFIS as inputs, and then the output values are obtained for the same period. The projections of electricity consumption in the Netherlands, Luxembourg, Ireland, and Italy during 2008-2015 are shown in Table 6 and Figures 4 to 7.
Table 6
Projections of Electric consumption during 2008-2015
Italy Luxembourg Netherland Ireland
2009 322.2903 6.9407 112.9254 32.04722 2010 322.9516 6.9933 112.3662 34.48428 2011 329.6455 7.1541 114.4998 37.08778 2012 330.2368 7.1932 114.2775 39.86907 2013 336.1318 7.3405 116.1477 42.84032 2014 336.5691 7.3679 115.9514 46.01447 2015 341.7443 7.495 117.5679 49.4054
Figure 4
Luxembourg annually consumption forecasting with proposed algorithm (2008- 2015)
Figure 5
Netherland annually consumption forecasting with proposed algorithm (2008- 2015)
Figure 6
Italy annually consumption forecasting with proposed algorithm (2008- 2015)
Figure 7
Ireland annually consumption forecasting with proposed algorithm (2008- 2015)
Figure 8
ANFIS results versus actual Electric consumption for 2004 to 2006 (Italy)
Figure 9
ANFIS results versus actual Electric consumption for 2004 to 2006 (Luxembourg)
Figure 10
ANFIS results versus actual Electric consumption for 2004 to 2006 (Ireland)
Figure 11
ANFIS results versus actual Electric consumption for 2004 to 2006 (Netherland)
Conclusions
This study presented an ANFIS approach for long term electricity consumption prediction. It presented the ANFIS and AR models for forecasting long-term natural gas demand prediction. The result of the ANFIS approach indicates that the proposed models are suitable and accurate for predicting electricity demand in industrialized nations, which in this case are the Netherlands, Luxembourg, Ireland, and Italy. In our long-term model we considered explanatory variables such as population and GDP. These variables showed a strong explanatory capability for estimating the actual electricity demand. Moreover, optimum results are obtained when all variables are used in ANFIS models. Figures 8 to 11 present the ANFIS results versus actual electricity consumption for 2004 to 2006. As can be seen, the ANFIS results are very close to the actual consumption. The approach of this study may be used for other cases to estimate and forecast optimum gas consumption.
The ANFIS algorithm is also compared with some of the current studies in the estimation of gas estimation. Its features are compared with previous models to show its advantages over previous models (Table 7). The ANFIS algorithm of this study is capable of dealing with both data complexity and ambiguity due to its mechanism. Also, it pre-processes and post-processes the given data to provide higher precision. In addition, it dominates all recent studies and is capable of dealing with complexity, ambiguity and uncertainty.
Table 7
The features of the ANFIS approach versus other methods Feature
Method
Data Complexit y and Non- Linearity
Data Uncertainty and Non- Crisp Data set
Intelligent Modeling and Forecasting
Fuzzy Data Model ing
High Precision and Reliability
Dealing Ambiguity
Data Pre- Processing and Post- Processing
The ANFIS
approach √ √ √ √ √ √ √
ANN √ √ √
Fuzzy
Regression √
Linear
Regression √ √
Nonlinear
Regression √ √ √ √
Decision
Tree √ √ √ √
Genetic
Algorithm √ √ √ √
References
[1] Azadeh, A. Ghaderi, S. F. Sohrabkhani, S. (2007a) Forecasting Electrical Consumption by Integration of Neural Network, Time Series and ANOVA.
Applied Mathematics and Computation, 186, 1753-1761
[2] Azadeh, A. Ghaderi, S. F. Tarverdian, S., Saberi, M. (2007b) Integration of Artificial Neural Networks and Genetic Algorithm to Predict Electrical Energy Consumption. Applied Mathematics and Computation, 186, 1731- 1741
[3] Azadeh, A., Tarverdian, S. (2007c) Integration of Genetic Algorithm, Computer Simulation and Design of Experiments for Forecasting Electrical Energy Consumption. Energy Policy, 35, 5229-5241
[4] Azadeh, A. Ghaderi, S. F. Sohrabkhani, S. (2008a) A Simulated-based Neural Network Algorithm for Forecasting Electrical Energy Consumption in Iran. Energy Policy, 36(7), 2637-2644
[5] Azadeh, A. Ghaderi, S. F., Sohrabkhani, S. (2008b) Annual Electricity Consumption Forecasting by Neural Network in High Energy Consuming Industrial Sectors. Energy Conversion and Management, 49(8), 2272-2278 [6] Azadeh, A. Saberi, M. Ghaderi, S. F. Gitiforouz, A., Ebrahimipour, V.
(2008c) Improved Estimation of Electricity Demand Function by Integration of Fuzzy System and Data Mining Approach. Energy Conversion and Management, 49, 2165-2177
[7] Azadeh, A. Saberi, M. Gitiforouz, A., Saberi, Z. (2009) A Hybrid Simulation Adaptive-Network-based Fuzzy Inference System for Improvement of Electricity Consumption Estimation. Expert Systems with Applications, In Press
[8] Brown, M., Harris, C. (1994) Neurofuzzy Adaptive Modeling and Control.
New Jersey: Prentice Hall
[9] Chow, L. C. H. (2001) A Study of Sectoral Energy Consumption in Hong Kong (1984-97) with Special Emphasis on the Household Sector. Energy Policy, 29, 1099-110
[10] Ediger V. S., Tatlldil, H. (2002) Forecasting the Primary Energy Demand in Turkey and Analysis of Cyclic Patterns. Energy Conversion and Management, 43, 473-87
[11] Florides G. A., Kalogirou S. A., Tassou S. A., Wrobel L. C. (2000) Modelling of the Modern Houses of Cyprus and Energy Consumption Analysis. Energy, 25, 915-37
[12] Gonzales Chavez, S., Xiberta Bernat, J., Llaneza Coalla, H. (1999) Forecasting of Energy Production and Consumption in Asturias (Northern Spain). Energy, 24, 183-98
[13] Gorucu, F. B., Geris, P. U., Gumrah, F. (2004) Artificial Neural Network Modeling for Forecasting Gas Consumption. Energy Sources, 26(3), 299- 307
[14] Gorucu, F. B., Gumrah, F. (2004) Evaluation and Forecasting of Gas Consumption by Statistical Analysis. Energy Sources, 26(3), 267-276 [15] Gutierrez, R. Nafidi, A., Sanchez, R. G. (2005) Forecasting Total Natural-
Gas Consumption in Spain by Using the Stochastic Gompertz Innovation Diffusion Model. Applied Energy, 80(2), 115-124
[16] Jai Persaud, A., Kumar, U. (2001) An Eclectic Approach in Energy Forecasting: a Case of Natural Resources Canada’s (NRCan’s) Oil and Gas Outlook. Energy Policy, 29, 303-13
[17] Jang, J. S. R. (1993) ANFIS: Adaptive Network-based Fuzzy Inference System. IEEE Transactions on Systems, Man and Cybernetics, 23(3), 665- 683
[18] Jang, R., Sun, C., Mizutani, E. (1997) Neuro-Fuzzy and Soft Computation, New Jersey: Prentice Hall
[19] Kadoshin S, Nishiyama T., Toshihide, I. (2000) The Trend in Current and Near Future of Energy Consumption from a Statistical Perspective. Applied Energy, 67, 407-17
[20] Khotanzad, A. Elragal, H., Lu, T. (2000) Combination of Artificial Neural- Network Forecasters for Prediction of Natural Gas Consumption. IEEE Transactions on Neural Networks, 11(2), 464-473
[21] Mamdani, E. H., Assilian, S. (1975) An Experiment in Linguistic Synthesis with a Fuzzy Logic Controller. International Journal of Man-Machine Studies, 7(1), 1-13
[22] Parikh, J., Purohit, P., Maitra, P. (2007) Demand Projections of Petroleum Products and Natural Gas in India. Energy, 32, 1825-1837
[23] Reddy, B. S., Balachandra, P. (2003) Integrated Energy–Environment- Policy Analysis: a Case Study of India. Utility Policy, 11(2), 59-73
[24] Rumelhart, D. E., McClelland J. L. (1986) Parallel Distributed Processing:
Explorations in the Microstructure of Cognition. Foundations, Cambridge, MA: MIT Press
[25] Saab, S., Badr, E., Nasr, G. (2001) Univariate Modeling and Forecasting of Energy Consumption: the Case of Electricity in Lebanon. Energy, 26, 1-14 [26] Sanchez-Ubeda, E. F., Berzosa, A. (2007) Modeling and Forecasting
Industrial End-Use Natural Gas Consumption. Energy Economics, 29(4), 710-742
[27] Siemek, J., Nagy, S., Rychlicki, S. (2003) Estimation of Natural-Gas Consumption in Poland Based on the Logistic-Curve Interpretation.
Applied Energy, 75(1-2), 1-7
[28] Takagi, T., Sugeno, M. (1985) Fuzzy Identification of Systems and its Application to Modeling and Control. IEEE Transactions on Systems, Man and Cybernetics 15(1), 116-132
[29] Tsukamoto, Y. (1979) An Approach to Fuzzy Reasoning Method. In M. M.
Gupta, R. K. Ragade, R. R. Yager (Eds.). Advances in Fuzzy Set Theory and Application, North-Holland, Amsterdam, 137-149
[30] Yoo, S., Lim, H. J., Kwak, S. J. (2009) Estimating the Residential Demand Function for Natural Gas in Seoul with Correction for Sample Selection Bias. Applied Energy, 86(4), 460-465
[31] Werbos, P. I. (1974) Beyond Regression: New Tools for Prediction and Analysis in the Behavior Sciences. Ph.D Thesis, Harvard University, Cambridge, MA, USA
[32] Azadeh A, Saberi M, Nadimi V, Iman M, An Adaptive-Network-based Fuzzy Inference System for Long-Term Electricity Consumption Forecasting (2008-2015): A Case Study of Netherland, Luxembourg, Ireland, Italy, 10th International Conference on Fuzzy Set Theory and Applications. Liptovský Ján, Slovak Republic, February 1-5, 2010
[33] Tiberiu Tudorache1, Mihail Popescu, FEM Optimal Design of Wind Energy-based Heater, Acta Polytechnica Hungarica, Vol. 6, No. 2, 2009