Behavioral/Cognitive
Comparative Brain Imaging Reveals Analogous and Divergent Patterns of Species and Face Sensitivity in Humans and Dogs
Nóra Bunford,1,2* Raúl Hernández-Pérez,1,3,4* Eszter Borbála Farkas,1,3 Laura V. Cuaya,1,3,4 Dóra Szabó,1 Ádám György Szabó,5 Márta Gácsi,1,6 Ádám Miklósi,1,6 and Attila Andics1,3,6
1Department of Ethology, Institute of Biology, Eötvös Loránd University, Budapest 1117, Hungary,2Lendület Developmental and Translational Neuroscience Research Group, Institute of Cognitive Neuroscience and Psychology, Research Centre for Natural Sciences, Budapest 1117, Hungary,
3MTA-ELTE Lendület Neuroethology of Communication Research Group, Eötvös Loránd University, Budapest 1117, Hungary,4Instituto de Neurobiología, Universidad Nacional Autónoma de México, Santiago de Querétaro 3001, Mexico,5Department of Neuroradiology, Medical Imaging Centre, Semmelweis University, Budapest 1083, Hungary, and6MTA-ELTE Comparative Ethology Research Group, Budapest 1117, Hungary
Conspecific-preference in social perception is evident for multiple sensory modalities and in many species. There is also a dedicated neural network for face processing in primates. However, the evolutionary origin and the relative role of neural species sensitivity and face sensitivity in visuo-social processing are largely unknown. In this comparative study, species sensitivity and face sensitivity to identical visual stimuli (videos of human and dog faces and occiputs) were examined using functional magnetic resonance imag- ing in dogs (n= 20; 45% female) and humans (n= 30; 50% female). In dogs, the bilateral mid suprasylvian gyrus showed conspe- cific-preference, no regions exhibited face-preference, and the majority of the visually-responsive cortex showed greater conspecific- preference than face-preference. In humans, conspecific-preferring regions (the right amygdala/hippocampus and the posterior superior temporal sulcus) also showed face-preference, and much of the visually-responsive cortex showed greater face-preference than conspecific-preference. Multivariate pattern analyses (MVPAs) identified species-sensitive regions in both species, but face-sen- sitive regions only in humans. Across-species representational similarity analyses (RSAs) revealed stronger correspondence between dog and human response patterns for distinguishing conspecific from heterospecific faces than other contrasts. Results unveil func- tional analogies in dog and human visuo-social processing of conspecificity but suggest that cortical specialization for face percep- tion may not be ubiquitous across mammals.
Key words:across-species representational similarity analysis; comparative neuroscience; conspecific-preference; dog;
face-sensitivity; fMRI; visual processing
Significance Statement
To explore the evolutionary origins of human face-preference and its relationship to conspecific-preference, we conducted the first comparative and noninvasive visual neuroimaging study of a non-primate and a primate species, dogs and humans.
Conspecific-preferring brain regions were observed in both species, but face-preferring brain regions were observed only in humans. In dogs, an overwhelming majority of visually-responsive cortex exhibited greater conspecific-preference than face-preference, whereas in humans, much of the visually-responsive cortex showed greater face-preference than conspecific- preference. Together, these findings unveil functional analogies and differences in the organizing principles of visuo-social processing across two phylogenetically distant mammal species.
Received Dec. 18, 2019; revised May 26, 2020; accepted June 20, 2020.
Author contributions: N.B., R.H.-P., E.B.F., D.S., Á.G.S., M.G., Á.M., and A.A. designed research; N.B., R.H.-P., E.B.F., L.V.C., Á.G.S., and A.A. performed research; N.B., R.H.-P., E.B.F., Á.G.S., and A.A. analyzed data; N.B., R.H.-P., and A.A.
wrote the paper.
N.B. was funded by the New National Excellence Program 2017/2018 Grant ÚNKP-17-4-ELTE/12423/11 and the MTA Lendület (“Momentum”) Programme Grant LP2018-3/2018. R.H.-P., E.B.F., L.V.C., and A.A. were funded by the MTA Lendület (“Momentum”) Programme Grant LP2017-13/2017 and by the Eötvös Loránd University. R.H.-P. and L.V.C. were also funded by the Mexican National Council of Science and Technology (CONACYT) Grants 409258 and 407590, respectively. D.S. was supported by the European Research Council (ERC) Grant 680040 of the European Union’s Horizon 2020 Research and Innovation Programme; N.B. and M.G. by the National Research, Development and Innovation Office Grant 115862K; and N.B., M.G., and Á.M. by the Hungarian Academy of Sciences Grant F01/031. Á.M. also received support from the National Brain Research Program Grant 2017-1.2.1-NKP-2017-00002. The National Laboratory for Magnetic Resonance Imaging was funded by CONACYT Grants 232676, 251216, and 280283. We thank the Medical Imaging Centre at the Semmelweis University as well as the Programa de Doctorado en
Ciencias Biomédicas, Universidad Nacional Autónoma de México (UNAM) and the National Laboratory for Magnetic Resonance Imaging. We also thank all human and dog participants and dogs’owners for their participation and contribution to these data as well as Boróka Babarczi-Bereczky, Luis Concha, Kálmán Czeibert, Juan Ortiz-Retana, and Erick Pasaye for their assistance and István Ulbert for his valuable comments.
*N.B. and R.H.-P. contributed equally to this work.
The authors declare no competing financial interests.
Correspondence should be addressed to Attila Andics at attila.andics@ttk.elte.hu or Nóra Bunford at bunford.nora@ttk.hu.
https://doi.org/10.1523/JNEUROSCI.2800-19.2020 Copyright © 2020 Bunford, Hernández-Pérez et al.
This is an open-access article distributed under the terms of the Creative Commons Attribution License Creative Commons Attribution 4.0 International, which permits unrestricted use, distribution and reproduction in any medium provided that the original work is properly attributed.
Introduction
Tuning to relevant classes of social stimuli is evidenced by both behavioral and neural processing preferences, but whether such preferences are because of comparable neural mechanisms across mammals remains equivocal. Conspecific-preference is reported in many species and across sensory modalities. Conspecific rela- tive to heterospecific smells (Boulet et al., 2009;Guo et al., 2018) and vocalizations (Dooling et al., 1992;Belin et al., 2000;Petkov et al., 2008; Andics et al., 2014) elicit stronger behavioral and neural responses in multiple species. Visual conspecific-prefer- ence is also well-documented across mammals behaviorally (Pascalis and Bachevalier, 1998;da Costa et al., 2004;Dufour et al., 2006) but only in primates neurally (Blonder et al., 2004;
Kriegeskorte et al., 2008b; Anzellotti and Caramazza, 2014;
Minxha et al., 2017).
A visual processing preference that has received considerable empirical attention is face sensitivity. In primates, behavioral data implicate highly developed and specialized visual skills in fa- cial information processing (Morton and Johnson, 1991;Valenza et al., 1996;Kanwisher et al., 1997;Cassia et al., 2004;Dufour et al., 2006). Imaging findings suggest that face processing in non- human primates (Tsao et al., 2003) and in humans (Duchaine and Yovel, 2015; Kanwisher et al., 1997) is supported by dedi- cated cortical patches/regions. The presence of non-conspecific- preferring face-sensitive regions in humans (Tong et al., 2000;
Blonder et al., 2004) and non-conspecific-preferring face-sensi- tive neurons in macaques (Minxha et al., 2017) is further support of the potential centrality of faceness, in addition to or even beyond conspecificity, as an organizing principle for primate vis- ual social perception.
In non-primate mammals, the role of faces in visuo-social perception is largely unknown. For navigating the environ- ment, relative to primates, many non-primates rely less on vision, or rely more on non-facial visual cues (Leopold and Rhodes, 2010). Although to various non-primates faces are attractive stimuli, direct behavioral evidence for strictly- defined face sensitivity is scarce (Leopold and Rhodes, 2010).
Up until most recently, neural face sensitivity has only been reported in sheep (Kendrick and Baldwin, 1987;Peirce et al., 2001).
Domestic dogs are an ideal test case for comparative inves- tigations of non-primate face processing. Because of social proximity to humans, dogs have been a species of choice in comparative studies of social perception and, with recent advances in awake dog fMRI (Bunford et al., 2017), neural mechanisms thereof. Similarly to humans, dogs can differenti- ate conspecific from heterospecific visual stimuli (Racca et al., 2010). Furthermore, evidence indicates that dogs also rely on faces as an important source of information that is socially relevant (Gácsi et al., 2004) and that dogs are attracted to human faces and can differentiate familiar from novel human faces (Huber et al., 2013). Although prior data suggest that spe- cific canine temporal regions respond more strongly to (human) faces than objects (Dilks et al., 2015; Cuaya et al., 2016), the designs of these small-sample fMRI studies do not allow for inferences about whether the observed sensitivity to (human) faces is driven by sensitivity to animacy or bodily stimuli in gen- eral, or to faceness in particular. Recent data show that some ca- nine temporal regions respond more strongly to dog than human faces (Thompkins et al., 2018), but whether this conspecific-pref- erence is face-specific remains untested. Others did not find any dog brain regions to respond more strongly to faces than scrambled images (Dilks et al., 2015;Szabó et al., 2020).
To comparatively assess the role of conspecificity and faceness in visuo-social perception beyond the primate order, here, we performed the same fMRI experiment in humans and dogs, using identical stimuli for both species: videos of human and dog faces and occiputs [i.e., back of the head, stringent comparison stimuli that are similar to faces in terms of animacy, familiarity (of the species to the viewer), intactness, and shape]. We hypothesized that (1) as in the auditory modality (Andics et al., 2014), conspecific-preference is a relevant organizing principle of visuo-social perception in both dog and human brains, and (2) face-preference is less central, relative to conspecific-prefer- ence, in dogs than in humans. To test these hypotheses, we con- ducted whole brain univariate and multivariate analyses, directly contrasted processing preferences in visually-responsive cortices of both species, and performed across-species representational similarity analyses (RSAs).
Materials and Methods
Participants
Data were collected in the context of a two-site (Hungary: Eötvös Loránd University and Mexico: Universidad Nacional Autónoma de México) project. Participants were 20 family dogs and 30 humans.
Fourteen dogs were recruited from the Hungarian site and 6 were recruited from the Mexican site and all 30 humans were recruited from the Hungarian site. In Hungary, dog owners and humans were recruited through the Department of Ethology participant pool and website, popu- lar social networking sites, and via snowball sampling and in Mexico, dog owners were recruited by research staff in dog parks and via snow- ball sampling. All procedures involving dogs met national and interna- tional guidelines for animal care and were approved by the appropriate ethics committees (the Food Chain Safety and Animal Health Directorate Government Office, Hungary, and the Bioethics Committee of the Institute of Neurobiology, Universidad Nacional Autónoma de México, Mexico). All procedures involving humans were approved by the appropriate ethics committee [Committee of Scientific and Research Ethics (ETT-TUKEB), Budapest, Hungary] and were in accordance with the 1964 Helsinki declaration and its later amendments. All humans par- ticipated voluntarily and provided written informed consent.
Dogs had an average age of 5.37 years (SD = 2.91, range = 2.5– 11 years; five intact males, four intact females, six neutered males, five spayed females) and were all family dogs. Independent samplesttests indicated no cross-site differences in dogs’age or average number of scanning sessions needed (ps.0.211). Humans had an average age of 32.3 years (SD = 7.5, range = 21–50 years). Most completed a master’s degree or equivalent (47%), followed by bachelor’s degree (37%), and high school degree (16%). Seven women and four men currently owned a dog and 12 women and 14 men had ever owned a dog. All participants had intact or corrected-to-intact vision and were free of major medical or neurologic illness as indicated by self-report. Exclusion criteria were contraindications to magnetic resonance imaging (e.g., claustrophobia, pregnancy, non-removable ferrous objects). No participants reported having experienced a traumatic experience with dogs.
Experimental design and procedure
Experimental and stimulus design were identical for dogs and humans.
The experiment comprised six runs, each run containing 12 blocks, each block comprised of 4, 2-s long stimuli representing one of four condi- tions: dog face (DF), dog occiput (DO), human face (HF), and human occiput (HO). Each block was preceded by a 10-s window during which a fixation cross was presented, and during the preblock windows, partici- pants were presented with a brief alerting sound via headphones.
Stimulus order within blocks and block order within runs was pseudo- randomized so that within blocks 1–4, 5–8, or 9–12, there was not more than one block of the same condition, and so that across the 12 blocks, blocks of the same condition did not immediately follow one another.
Participants received one of six randomizations. The total length of a run was 226 s. Stimuli were presented;155 cm in front of participants’
eyes and controlled using MATLAB (version R2016a) Psychophysics Toolbox Version 3. Dogs were trained to lay motionless during scanning (Andics et al., 2014,2016) and to look at the stimuli. Dogs viewed the presentation screen directly (on an MR compatible LCD Monitor NordicNeuroLab AS) in Hungary, and back-projected onto a white screen (using an Epson x141projector) in Mexico, while maintaining a sphinx position with their heads supported by a chinrest (Berns et al., 2013;Cuaya et al., 2016) and humans viewed the screen through a mir- ror attached to the head coil.
Dogs were tested in one run per session, with no more than four ses- sions per day and humans were tested in a single session. Sessions with dogs were continued until six functional runs (average number of days needed was 3.15, range 2–6) were obtained.
Sessions were continuously monitored (for dogs closing their eyes, or not being fixated at the stimuli for longer than 4 s) on a monitor by experimenters responsible for scanning participants (the first four authors). No scans had to be discarded for these reasons. Humans were instructed to passively view the stimuli.
fMRI stimuli
Stimuli consisted of color videos (with an approximate size of faces/occi- puts from lowest point of the chin to highest point on top of the head = 28 cm) of unknown human and dog faces and human and dog occiputs (36 images of each), depicted in front of a uniform blue back- ground (Movie 1).
Movement in the videos involved minor facial movements, such as eyeblinks or subtle change in the exact direction or location of eye gaze, or minor head movements, such as vertical movement because of inhala- tion/exhalation. In case of human faces, individuals posed without glasses, jewelry, or intense make-up and with as neutral expression as possible. To avoid creating stimuli that are potentially threatening for dogs, human individuals were instructed not to look directly into the camera and similar dog footage was selected (i.e., with gaze slightly averted). In selecting our stimuli, we aimed to balance ecological validity, experimental control, and feasibility. Specifically, to enhance ecological validity and feasibility, we chose natural color images as it was essential that images are engaging and easily perceivable for dogs to ensure that they look at them during scanning. To ensure experimental rigor, re- cording of images was done under identical settings and circumstances (e.g., with regard to lighting and time of day) and differences in visual properties (brightness, contrast, hue, saturation, motion) were consid- ered in analyses (seeControl tests for low-level visual property effects below).
fMRI data acquisition and preprocessing
At both test sites, scanning was performed on a 3T MRI scanner (Ingenia 3T, Philips Medical System) using, for both dogs and humans, a BOLD-sensitive T2*-weighted echo-planar imaging sequence (both dogs and humans: TR = 3200 ms, TE = 29 ms, flip angle = 90°, 2.5-mm-thick slices with 0.5-mm gap; dogs: field of view: 300198110 mm, acqui- sition matrix 12079; 37 axial slices; humans: field of view: 300198 132 mm, acquisition matrix 12079; 44 axial slices). Each of the six runs included 75 volumes. A high-resolution anatomic scan was also acquired at a separate session for dogs and at the end of the functional imaging session for humans, using a T1-weighted 3D TFE sequence, with 111 mm resolution with 180 slices, covering the whole brain, for anatomic localization.
For dogs at both sites, Philips SENSE coils and for humans a Philips dStream Head 32ch coil was used. The former at the Hungarian site con- sisted of two, 1417 cm elliptical elements (Flex-M) and at the Mexican site of two 11-cm in diameter circular elements (Flex-S), with one placed under the dog’s head and the other on top of the dog’s head, fixed with plastic strips, as in previous studies (Andics et al., 2014,2016).
Image preprocessing and statistical analysis were performed using SPM12 (https://www.fil.ion.ucl.ac.uk/spm) and followed conventional preprocessing steps (realignment, normalization to a preselected, indi- vidually labeled canine brain of an average-sized dog as template for dogs (Czeibert et al., 2019) and a Montreal Neurologic Institute (MNI) template for humans, resampling to 2 2 2 mm voxels, and
smoothing with an isotropic Gaussian kernel (full-width at half-maximal 4 mm for dogs, 8 mm for humans)). For dogs, the longitudinal axis of the brain was established through the rostral and caudal commissures, and the origin for obtaining coordinates was set to the mid of the rostral commissure. Negative to positivex,y, andzcoordinates are in milli- meters and, as in MNI space for humans, denote left to right, posterior to anterior, and inferior to superior directions, respectively. For dogs and humans, if translation exceeded 3 mm, the scan was excluded (three dog runs and no human runs were affected by these criteria).
The average of maximal movements for each translation direction was below 2.059 mm for dogs (1.523 in thex, 0.947 in they, and 2.059 in thezdirection) and 0.605 mm for humans (0.183 in thex, 0.434 in they, and 0.605 in thez direction) and, for each rotation axis, was below 1.196° (0.698 for pitch, 1.196 for roll, and 0.773 for yaw) and 0.571°
(0.571 for pitch, 0.199 for roll, and 0.231 for yaw), respectively. The aver- age of the maximum scan-to-scan movement per dog and per transla- tion direction was 0.853 mm (0.730 in thex, 0.618 in they, and 1.212 in thezdirection) and per human and per direction was 0.212 mm (0.068 in thex, 0.277 in they, and 0.289 in thezdirection). The average of the maximum scan-to-scan movement per dog and per rotation axis was 0.416° (0.475 for pitch, 0.469 for roll, and 0.305 for yaw) and per human and per axis was 0.151° (0.281 for pitch, 0.077 for roll, and 0.095 for yaw).
fMRI data and statistical analysis
All statistical tests were two-tailed unless otherwise noted.
General linear model (GLM)
A general linear model was applied to the time series, convolved with the canonical hemodynamic response function and with a 128-s high- pass filter. Condition regressors were constructed for each condition, resulting in four regressors: DF, DO, HF, and HO, the effects of which were estimated for each voxel for each participant, with first level indi- vidual models also including movement correction parameters as nui- sance regressors, and taken to the second level for whole-volume random effects analysis on the group level. Threshold for reporting for contrasts werep,0.001 uncorrected andp,0.05 cluster-corrected for familywise error (FWE) for dogs and p,0.000001 uncorrected and p,0.001 cluster-corrected for FWE for humans. To establish that find- ings are not a result of shortcomings of experimental design or stimuli, the overall level of visual responsiveness within the dog and human brain was examined in GLM analyses comparing all conditions to base- line (i.e., fixation cross;p,0.001 uncorrected andp,0.05 cluster-cor- rected for FWE).
To create a set of all face-sensitive and conspecific-sensitive regions for further characterization, first, we selected peaks from the F.O and Movie 1. fMRI stimuli. Video shows sample dynamic images, presented in color and dynamically for 2 s, representing each of four conditions human face, human occiput, dog face, and dog occiput. Stimulus design was identical for dogs and humans. [View online]
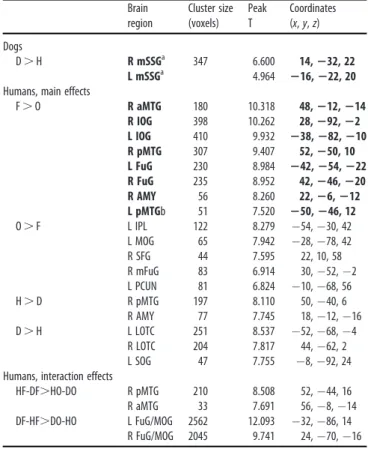
conspecific (C).heterospecific (He; i.e., H.D for humans, D.H for dogs) main contrasts, starting with the strongest peaks. Peaks closer than 16 mm to those already selected were skipped. Next, in case of unilateral response, specific contrasts were examined to determine whether a con- tralateral region can be identified. Two dog regions and eight human regions were thus identified and included in further analyses: for dogs, bilateral mid suprasylvian gyrus (mSSG) based on D.H and for humans, bilateral fusiform gyrus (FuG) and inferior occipital gyrus (IOG), right posterior middle temporal gyrus (pMTG), right anterior middle temporal gyrus (aMTG) and right amygdala/hippocampus (AMY), based on F.O, and left pMTG based on HF.HO (for data on all specific contrasts, see Extended DataTable 1-1).
To further characterize these regions, 2(F, O)2(H, D)2(left, right) ANOVAs (22 in case of unilateral activity) were conducted (interpreting only side main effects and interactions but not interpreting face and species main effects, to avoid double-dipping).
Control tests for low-level visual property effects
To assess whether observed differences in brain response were because of differences in visual properties or motion of the four stimulus catego- ries, the parametric effects of the four visual properties (brightness, con- trast, hue, and saturation) and motion of the experimental stimuli were tested in random effects parametric modulation analyses. First, to quan- tify each video’s brightness, contrast, hue, and saturation, the value of each property on each frame was calculated and then averaged. The brightness, hue, and saturation of each pixel was calculated by convert- ing it to its’representation in the HSL color representation, in which the appearance of a pixel is determined by a number value of these three components. The contrast of each image was defined as the standard deviation of the pixel intensities (root mean square contrast). The level of motion across consecutive frames was evaluated using the motion estimation functions of MATLAB’s Computer Vision System Toolbox, and then averaged over the whole clip.
To this end, we first checked for differences across conditions in 2(F, O)2(H, D) ANOVAs. Then, low-level visual properties that emerged as significantly different in faceness contrasts were modeled as paramet- ric modulators in face-sensitive regions and low-level visual properties that emerged as significantly different in conspecificity contrasts were modeled as parametric modulators in conspecific-preferring regions.
Obtained mean b values were compared with zero, in a total of 23 Benjamini–Hochberg-corrected one-samplettests, considering each of eight GLM-derived regions, the contrast based on which the region was identified, and whether or not there was a difference in any visual prop- erty for the pertinent comparison. For example, the bilateral IOG was selected based on F.O and, because faces and occiputs differed only in brightness, left and right IOG response to brightness was compared with zero. Accordingly, we tested R/L mSSG, R AMY, and R/L pMTG response to contrast, hue, and saturation, and R/L FuG, R/L IOG, R/L pMTG, R aMTG, and R AMY response to brightness.
As another test of the degree to which variations in visual properties modulated neural response, GLM analyses and then ANOVAs were repeated controlling for variations in visual properties, i.e., following re- moval of a single, visually most deviant block per condition, per run. To identify the visually most deviant block, we ranked all blocks within each condition and each run, giving the highest rank to the block which con- tributed the most to the visual difference across conditions. This ranking was done for all four visual properties across runs, and ranks were summed. For each condition and each run, the block with the highest rank was identified as the visually most deviant one. After removal of these deviant blocks, visual properties did not differ for the remaining trials,ps.0.05.
Comparing conspecific-preference and face-preference
To examine the extent to which visually-responsive voxels respond stronger to the conspecificity or to the faceness of stimuli, first, the pro- portion of voxels with greater sensitivity to conspecificity than to face- ness and the proportion with greater sensitivity to faceness than to conspecificity was assessed, by calculating (1) the number of voxels with larger positiveb values in the C.He contrast at the group level than in
the F.O contrast and (2) the number of voxels with larger positiveb values in the F.O contrast at the group level than in the C.He con- trast, respectively. Second, the proportion of these two sets of voxels was determined [a/(a1b)].
To assess the likelihood of obtaining the observed proportions by chance, we first modelled the proportion with greater sensitivity to con- specificity than to faceness and the proportion with greater sensitivity to faceness than to conspecificity under a“no signal”condition, by ran- domly re-labeling each stimulus block. Second, we determined the num- ber of conspecific-preferring and face-preferring voxels and third, we employed permutation testing with 10,000 resamples.
To determine whether, across participants, there are sets of voxels exhibiting consistently greater conspecific-preference than face-prefer- ence (or vice versa), within the visually-responsive regions of each par- ticipant, a “response preference map” was created. A value of 1 was assigned to each voxel whosebvalue of the C.He contrast was positive and greater than theb value of the F.O contrast. A value of 1 was assigned to each voxel whoseb value of the F.O contrast was positive and greater than thebvalue of the C.He contrast and a value of 0 was assigned to all other voxels. Then, the response preference map was compared with a mean of random permutations in one-samplettests (one-tailed) at the group level, using SnPM. Thresholds for reporting for contrasts werep,0.005 uncorrected andp,0.05 cluster-corrected for FWE for dogs andp,0.0001 uncorrected andp,0.001 cluster-cor- rected for FWE for humans.
Multivariate pattern analysis (MVPA)
To assess which regions can accurately discriminate faces from occiputs (face sensitivity, F vs O) and conspecific from heterospecific stimuli (spe- cies sensitivity, C vs He) in each species, we performed MVPAs on stim- ulus blocks using PyMVPA software package (Hanke, 2009) and the LibSVM’s implementation of the linear support vector machine (LSVM) classifier (www.csie.ntu.edu.tw/;cjlin/libsvm/). Final processing was done using custom-made MATLAB scripts. The events in the time series of each acquisition were convolved to the hemodynamic response func- tion, then each acquisition was linearly detrended and z-scored. A two- way classification was performed, wherein a LSVM classifier was trained with the time series values corresponding to the two stimulus categories for each analysis (either F vs O or C vs He). Classifier performance in each participant was evaluated using a leave-one-out cross-vali- dation scheme, that is, all but one acquisitions were used to train the classifier (train), and the classifier predicted the stimulus category in the remaining acquisition (test). This process was repeated so that each acquisition was “test” once. Classifier performance was then calculated as the average number of correct classifications across participants and acquisitions.
We searched within the visually-responsive cortex using a searchlight approach (Kriegeskorte et al., 2006) and a spherical kernel. In each voxel within the visually responsive regions of each participant we created a sphere (radius = 4 mm for dogs and 8 mm for humans) and all the voxels contained within the sphere were used to train and test a LSVM classifier using a training and testing scheme identical to the one described above.
The resulting classification accuracy was projected back to the center of the sphere. We repeated this process for every voxel, thus creating an ac- curacy map for each participant.
To determine whether classifier performance was better than chance, random permutation testing (Stelzer et al., 2013) was used. We calcu- lated classifier performance that would be expected by chance for each voxel, by randomly re-labeling each stimulus block and repeating this process 10,000 times (to create a distribution of the possible values each voxel can have by chance) for dogs, and 1,000,000 times for humans.
The probability of a given group mean classifier performance was then estimated, by comparing such performance to the performance that would be expected by chance. To test whether a region encoded infor- mation about a stimulus at the group level, we averaged the classification accuracy of each voxel across all participants. The resulting group map was then thresholded using permutation testing as described above (p,0.001 for dogs and p,0.000001 for humans). To estimate the probability of obtaining a cluster with a certain size, we used random
permutation testing by repeating the same procedure. We then thresh- olded the obtained maps and calculated the number and size of clusters under chance conditions, and then used this distribution of cluster sizes to estimate the cluster size that would be expected by chance. Only clus- ters with sizes above threshold were retained (p,0.05 for dogs and p,0.001 for humans).
RSA
To assess whether stimuli are represented similarly in GLM-derived human brain regions and the dog brain, across-species RSAs (for a simi- lar across-species comparison, seeKriegeskorte et al., 2008a) were per- formed, in multiple steps.
First, we calculated a representational dissimilarity matrix (RDM) for all stimulus categories across all runs of each participant. RDMs represent how different the patterns of activity are, related to a pair of stimuli, in a given set of voxels. For humans, we obtained RDMs for GLM-derived selected human peaks, creating a sphere (radius = 8 mm) around each peak. For dogs, we obtained RDMs using a searchlight approach (Connolly et al., 2012) by creating a sphere (radius = 4 mm) around each voxel in the visually-responsive cortex. (For completeness, we also report across-species representational similarities between the same human peaks and the whole dog brain in Extended DataFig. 4-1.) RDMs were calculated as the correla- tion distance (1–Pearson correlation) of each stimulus type-run pair of the activity pattern of the set of voxels within the sphere. To reduce differ- ences between low-noise and high-noise voxels with regard to their impact, a transformation equivalent to univariate noise normalization suggested by Walther et al. (2016)was implemented. Specifically, before calculation of RDMs, the data of each voxel were rescaled, using the SD of changes in its
“activation”during baseline periods.
Second, we compared human RDMs to dog RDMs. Two ways of across-species matching of conditions were tested. (1) Direct matching:
human representations of human stimuli were compared with dog repre- sentations of human stimuli, and human representations of dog stimuli were compared with dog representations of dog stimuli. (2) Functional matching: human representations of human stimuli were compared with dog representations of dog stimuli, and human representations of dog stimuli were compared with dog representations of human stimuli. Direct matching therefore referenced stimulus identity, while functional match- ing referenced conspecificity/heterospecificity. We calculated Pearson cor- relation coefficients between RDMs, repeated this procedure for each voxel, and projected back the result of the correlation to the center of the sphere, obtaining a similarity map. We repeated this procedure for all dog-human pairs and averaged the maps of each human. A one-tailed one samplettest was run on each voxel at the group level (p,0.001) to test whether the values of the voxel differed from chance (calculated by taking random coordinates and performing the same procedure,n= 1000).
Third, in cases where suprathreshold representational similarity across species was observed (this happened only for functional match- ing), to determine what is driving that similarity, follow-up pairwise comparisons were calculated in one samplettests, comparing observed meanrvalues to expected (by chance) meanr values. (To obtain mean rvalues, correlation coefficients were calculated for every stimulus pair for each human*dog pair and then the means of these correlation coeffi- cients for every stimulus pair were calculated for each participant; to obtain expected mean r values, the same procedure as for observed meanrs was followed, except we randomly swapped condition labels, thereby obtained a chance meanr, repeated this 10,000 times and calcu- lated their mean.) Comparisons of stimulus pairs CF versus CO (indica- tive of face sensitivity for conspecifics), HeF versus HeO (face sensitivity for heterospecifics), and HeF versus CF (species sensitivity for faces), HeO versus CO (species sensitivity for occiputs) were performed. To determine the magnitude of the obtained differences, Cohen’sdvalues as indices of effect size were calculated for each pair compared.
Data availability
The datasets generated and/or analyzed during the current study are available from a corresponding author on reasonable request.
Results
GLM
For GLM results for each main contrast (F.O, O.F, H.D, D.H) and interactions in dogs and humans, seeTable 1and Figure 1. For visual responsiveness results in dogs and humans, see Extended DataFigures 2-1,2-2.
In dogs, we found significant main effects only for the D.H contrast. Specifically, the bilateral mSSG responded more strongly to dog relative to human stimuli. Even with a more lib- eral,p,0.005 uncorrected voxel threshold, we obtained no face- preferring .3-voxel clusters, ps(cluster-corrected for FWE) . 0.991 for 1–3-voxel clusters. In dogs, we found no interaction effects.
In humans, we found significant main effects for all four con- trasts, with H.D regions essentially being a subset of F.O regions. Specifically, the bilateral FuG and IOG, right pMTG, right aMTG, and right AMY responded more strongly to faces relative to occiputs. Both the right pMTG and the right AMY responded more strongly to human than to dog stimuli. In the left hemisphere, the middle occipital gyrus (MOG), precuneus (PCUN), and inferior parietal lobule (IPL) and in the right hemi- sphere a medial FuG region (mFuG) and the superior frontal gyrus (SFG) responded more strongly to occiputs than to faces;
Table 1. Main GLM results for dogs and humans Brain
region
Cluster size (voxels)
Peak T
Coordinates (x,y,z) Dogs
D.H R mSSGa 347 6.600 14,232, 22
L mSSGa 4.964 216,222, 20
Humans, main effects
F.O R aMTG 180 10.318 48,212,214
R IOG 398 10.262 28,292,22
L IOG 410 9.932 238,282,210
R pMTG 307 9.407 52,250, 10
L FuG 230 8.984 242,254,222
R FuG 235 8.952 42,246,220
R AMY 56 8.260 22,26,212
L pMTGb 51 7.520 250,246, 12
O.F L IPL 122 8.279 54, 30, 42
L MOG 65 7.942 28, 78, 42
R SFG 44 7.595 22, 10, 58
R mFuG 83 6.914 30, 52, 2
L PCUN 81 6.824 10, 68, 56
H.D R pMTG 197 8.110 50, 40, 6
R AMY 77 7.745 18, 12, 16
D.H L LOTC 251 8.537 52, 68, 4
R LOTC 204 7.817 44, 62, 2
L SOG 47 7.755 8, 92, 24
Humans, interaction effects
HF-DF.HO-DO R pMTG 210 8.508 52, 44, 16
R aMTG 33 7.691 56, 8, 14
DF-HF.DO-HO L FuG/MOG 2562 12.093 32, 86, 14
R FuG/MOG 2045 9.741 24, 70, 16
Threshold for reporting for all higher-level contrasts wasp,0.000001 and clusterp,0.001 for FWE for humans andp,0.001 and clusterp,0.05 for FWE for dogs. All peaks16 mm apart are reported.
aAtp,0.001, these two peaks result from D.H as a single cluster’s two main peaks. When checked with a stricterp,0.0005 threshold, a left and a right cluster-corrected significant cluster is obtained, with the same peaks. Thus, in dogs, the main and the subpeak are reported but in humans, in the absence of sin- gle bilateral clusters, subpeaks are not reported.
bRegion identified based on HF.HO.
L = left; R = right; mSSG = mid suprasylvian gyrus; aMTG = anterior middle temporal gyrus; IOG = inferior occipital gyrus; pMTG = posterior middle temporal gyrus; FuG = fusiform gyrus; AMY = amygdala/hippo- campus; IPL = inferior parietal lobule; MOG = middle occipital gyrus; SFG = superior frontal gyrus; mFuG = medial fusiform gyrus; PCUN = precuneus; LOTC = lateral occipitotemporal cortex; SOG = superior occipital gyrus/cuneus; FuG/MOG = a cluster including parts of FuG, IOG, MOG, and SOG. Selected conspecific-prefer- ring and face-sensitive regions are in bold. See also Extended DataTables 1-1,1-2,1-3,1-4.
and the left superior occipital region spanning to the cuneus (SOG) and bilateral lateral occipitotemporal cortex (LOTC) showed stronger response to dog than to human stimuli. In humans, we also found interaction effects: in the right pMTG and aMTG, there was stronger face-preference for conspecifics than heterospecifics. Follow-up comparisons indicated that
response was greatest to human faces relative to all other stimuli (pMTGps,0.007, aMTGps,0.001), with no response differ- ence among the other three conditions (pMTG ps.0.877, aMTGps.0.993). This reveals conspecific face sensitivity in the right pMTG and aMTG. In the bilateral FuG/MOG, response was weaker to human faces than to either dog faces (Lp= 0.012, Figure 1. GLM results in dogs (n= 20) and humans (n= 30).A, Dog contrast maps superimposed on a template brain (Czeibert et al., 2019). Threshold wasp,0.001 uncorrected and p,0.05 cluster-corrected for FWE. None of the other main or interaction contrasts yielded significant effects. The bar graph represents parameter estimates (bweights) in select GLM-derived peaks (sphere radius = 4 mm) to each condition; error bars represent SE.B,C, Human contrast maps (main and interaction effects) superimposed on a template brain. Threshold was p,0.000001 uncorrected andp,0.001 cluster-corrected for FWE.B, Conspecific.heterospecific, face.occiput, and their interaction. The bar graphs represent parameter estimates (b weights) in select GLM-derived peaks (sphere radius = 8 mm) to each condition; error bars represent SE.C, Heterospecific.conspecific, occiput.face, and their interaction. D = dog; H = human; F = face; O = occiput; L = left; R = right; mSSG = mid suprasylvian gyrus; AMY = amygdala/hippocampus; aMTG = anterior middle temporal gyrus; FuG = fusiform gyrus; FuG/MOG = a cluster including parts of FuG, IOG, MOG and SOG; IOG = inferior occipital gyrus; IPL = inferior parietal lobule; LOTC = lateral occipitotemporal cortex; mFuG = medial fusiform gyrus; MOG = middle occi- pital gyrus; PCUN = precuneus; pMTG = posterior middle temporal gyrus; SFG = superior frontal gyrus; SOG = superior occipital gyrus, extending to cuneus.
Rp= 0.071) or human occiputs (Lp= 0.033, Rp= 0.094), with no difference among other conditions (Lps.0.129, Rps.0.500).
Activity response profiles for selected GLM-derived regions in dogs and humans are shown inFigure 1A,B.
Further characterizing these regions, in dogs, for mSSG, nei- ther the side main effect, nor any of the two-way or three-way interactions were significant (all ps.0.164). In humans, for IOG, the main effect of side was significant, F(1,239) = 20.286, p,0.001 (left.right), and so was the interaction effect between face and species on IOG response,F(1,239)= 8.530,p= 0.004, with greatest IOG response to dog faces. For FuG, neither the main effect of side, nor any of the two-way or three-way interactions were significant (allps.0.092). For pMTG, the main effect of side was significant, F(1,239) = 66.947, p,0.001 (right.left).
Interactions between face and species (F(1,239)= 6.396,p= 0.012) and face and side (F(1,239)= 4.073,p= 0.045) were also significant.
In case of the face by species interaction, greatest pMTG response was to human faces. In case of the face by side interac- tion, greatest pMTG response was to faces in the right hemi- sphere. For right AMY and right aMTG, the face by species interactions were not significant (p= 0.079 and p= 0.053, respectively).
Control tests for low-level visual property effects
2(F, O) 2(H, D) ANOVAs indicated a visual difference for four properties: for F.O, there was a difference in brightness F(1,144)= 6.187,p= 0.014; but not hue, contrast, or saturation (all ps.0.404). For H.D, there was a difference in contrast,F(1,144)
= 8.334,p= 0.004; hue,F(1,144)= 4.007,p= 0.047; and saturation, F(1,144) = 7.252, p= 0.008. There was no difference in motion (bothps.0.353).
One-samplettests indicated three cases with visual effects, all for humans: brightness contributed with a negative parametric modulatory effect to the right IOG response, t(29) = 3.588, p= 0.001 (faces had greater brightness than occiputs), contrast contributed with a positive parametric modulatory effect to the
right pMTG response, t(29) = 3.453, p= 0.001 (human stimuli had greater contrast than dog stimuli), and brightness contrib- uted with a positive parametric modulatory effect to the right pMTG response,t(29)= 3.301,p= 0.002 (face stimuli had greater brightness than occiput stimuli; Extended Data Table1-2).
When GLM analyses and then ANOVAs were repeated fol- lowing removal of a single, visually most deviant block per con- dition, there were no changes in face or species main effects in any of the selected regions: all previously significant effects remained significant and no nonsignificant face or species main effect emerged as significant (Extended Data Table1-3).
Comparing conspecific-preference and face-preference Analyses of the extent to which visually-responsive voxels respond stronger to the conspecificity or to the faceness of stim- uli indicated that in dogs, 94.6% of the visually-responsive cortex showed greater preference for conspecificity than for faces (likeli- hood of obtaining the observed proportions by chance, using per- mutation testing: p,0.01). In humans, 10.8% of the visually- responsive cortex showed this pattern (p,0.05). Consequently, 5.4% of dog and 89.2% of human visually-responsive cortex showed greater preference for faces than for conspecificity (Fig. 2).
Non-parametric group analyses of the subject-level binary response preference maps (Extended DataFig. 2-2) showed that, in dogs, the bilateral mSSG and a splenial gyrus (SpG) cluster exhibited greater conspecific-preference than face-preference, and these clusters were overlapping with those responding stron- ger to dog relative to human stimuli. In humans, the opposite pattern emerged: a bilateral IOG cluster and a right inferior tem- poral gyrus (ITG) cluster exhibited greater face-preference than conspecific-preference, and these clusters were overlapping with those responding stronger to face than to occiput stimuli.
MVPA
We found two clusters in dogs for the C versus He comparison, one in the left mSSG, with group mean classifier accuracy Figure 2. Visually-responsive regions and processing preference differences in dogs and humans.A, Visually-responsive regions (color coded with warm) as determined by the contrast of ex- perimental conditions versus fixation baseline in the dog brain (left), thresholded atp,0.001 uncorrected andp,0.05 cluster-corrected for FWE and in the human brain (right), thresholded atp,0.000001 uncorrected andp,0.001 cluster-corrected for FWE.B, Group-level binary map of stronger conspecific-preference than face-preference (red) and stronger face-preference than conspecific-preference (blue) in visually-responsive regions. See Results for corresponding permutation statistics comparing the proportions of voxels with either preference and on random effects analyses of individual binary preference maps. See also Extended DataFigures 2-1,2-2.
M = 0.642, SD = 0.124 and one in the right caudal suprasylvian gyrus (cSSG), M = 0.629, SD = 0.136. No clusters were revealed in dogs for the F versus O comparison. In humans, a cluster was revealed for the C versus He comparison, in the right pMTG, M = 0.675, SD = 0.163. Four clusters were revealed for the F ver- sus O comparison: a large cluster including parts of the right FuG, IOG, MOG, and MTG, M = 0.761, SD = 0.180, a large clus- ter including parts of the left FuG, IOG, MOG, and MTG, M = 0.797, SD = 0.148, the right inferior frontal gyrus (IFG), M = 0.672, SD = 0.152, and a left MOG cluster, M = 0.667, SD = 0.112. All results were cluster corrected for FWEp,0.05 for dogs and p,0.001 for humans (Fig. 3; for the full list of peaks and subpeaks, see Extended DataFig. 3-1).
RSA
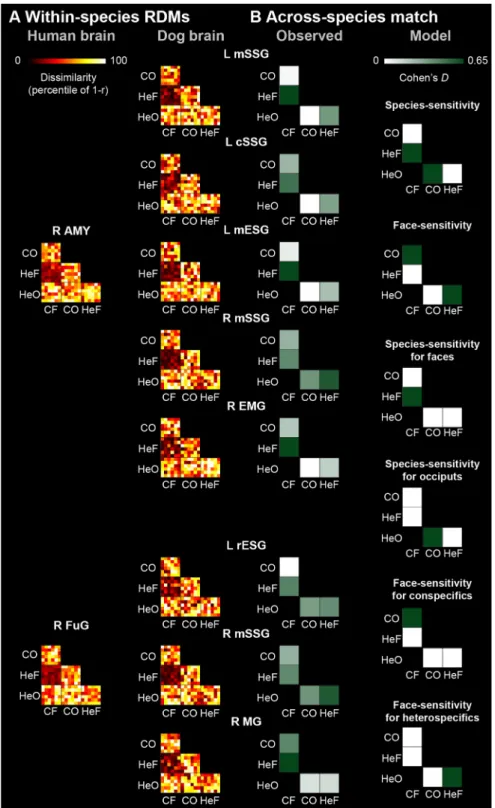
Across-species RSA using the direct matching model indicated no visually-responsive dog regions that represented stimuli simi- larly to the GLM-derived human regions. Across-species RSA using the functional matching model showed that the canine left mid ectosylvian gyrus (mESG),t(29)= 4.994, right ectomarginal gyrus (EMG),t(29)= 4.882, left cSSG,t(29)= 4.732 and right and left mSSG,t(29) = [6.378 and 4.997] represented stimuli similarly to the human right AMY (ps,0.001), and the ca- nine left rESG,t(29)= 4.383, right MG,t(29)= 4.741 and right mSSG,t(29)= 4.632 represented stimuli similarly to the human right FuG (ps,0.001; Fig. 4). Follow-up pairwise compari- sons indicated that a medium species effect for faces (i.e., HeF-CF) drove the representational similarity effect between the dog left (d= 0.657) and right mSSG (d= 0.581), left mESG (d= 0.640), and right EMG (d= 0.641), and the human right AMY; a medium species effect for faces in case of the repre- sentational similarity between the dog right MG (d= 0.656) and the human right FuG; and a medium faceness effect for heterospecifics (i.e., HeF-HeO) in case of the representational
similarity between the dog right mSSG (d= 0.580) and the human right FuG. All across-species RSA results are summar- ized in Extended DataFigures 4-1,4-2,4-3.
Individual difference-focused analyses
To determine whether lack of support for face sensitivity in dogs generalizes across the 20 dogs tested, we assessed for face-prefer- ence in each dog, by testing whether there is suprathreshold F.O or DF.DO sensitivity in any individual. Using a p,0.001 uncorrected voxel threshold on individual contrast maps, we found that no dogs had a meaningful number of supra- threshold face-preferring voxels (three dogs had such F.O vox- els, Mnr of voxels= 1.33, range 1–2; two dogs had such DF.DO voxels, Mnr of voxels = 2.5, range 2–3). In comparison, similarly thresholded individual D.H contrast maps yielded sizeable clusters in many dogs (10 dogs had such voxels, Mnr of voxels= 61, range 1–227).
To assess for any effects that relevant dog individual differ- ence variables may have had on our results, experience and breeding variables (for details, see Extended Data Table 1-4) were entered into GLM analyses as covariates to assess their effects on HF-preference (quantified in the HF.HO and HF.DF contrasts) in the visually-responsive cortex of dogs. To index “experience,”the type of training each dog received was considered, quantifying the degree to which such training was face-oriented (involved/necessitated attending to human faces) on a four-point scale. To index “breeding,” a brain-based ce- phalic index was calculated for each dog. Not only is a brain- based cephalic index appropriate to quantify the effects of breed- ing on the architecture of the dog brain (Hecht et al., 2019), it is also relevant with regard to attraction to human faces in dogs (Bognár et al., 2018). Findings indicated neither individual differ- ence variable covaried with HF-preference, neither at a more Figure 3. MVPA using searchlight.A, Brain regions within the visually-responsive cortex of dogs and humans that discriminate conspecific from heterospecific (red) and face from occiput (blue) stimuli. The mean classifier accuracy significance level (p) on each voxel was calculated using permutation testing (see Materials and Methods)p,0.001 uncorrected andp,0.05 clus- ter-corrected for FWE for dogs andp,0.000001 uncorrected andp,0.001 cluster corrected for FWE for humans, the searchlight used a spherical kernel with a radius of 4 mm for dogs and 8 mm for humans.B, Histograms depicting classification accuracy across participants for each cluster peak. L = left; R = right; cSSG = caudal ectosylvian gyrus; mSSG = mid suprasylvian gyrus;
FuG = fusiform gyrus; IFG = inferior frontal gyrus; IOG = inferior occipital gyrus; ITG = inferior temporal gyrus; MOG = middle occipital gyrus; pMTG = posterior middle temporal gyrus. See also Extended DataFigure 3-1.
standard (p,0.001), nor at a more liberal voxel threshold (p,0.01),p,0.05 clus- ter-corrected for FWE.
To assess for any effects that relevant human individual difference variables may have had on our results, self- reported dog ownership (as a proxy for expertise), was entered into GLM analyses as a covariate. We assessed the covariate effect on D.H, DF.HF and DF.DO responses, interest was in whether indi- viduals who owned a dog would show greater responses to dog stimuli overall, or to dog face stimuli specifically, com- pared with those who did not own a dog, in the visually responsive cortex of humans. Results indicated that expertise covaried with D.H response in the right lingual gyrus (LiG; an 11-voxel-large clus- ter, peak at 8, 80, 8; thresholded at p,0.000001 uncorrected and p,0.001 cluster-corrected for FWE). This pattern was driven by a difference in dog owners (n= 11), who showed greater right LiG response to dog (M = 3.212, SD = 1.628) than human stimuli (M = 3.212, SD = 1.628),t(10)= 6.934,p,0.001. In non-own- ers (n= 19), R LiG response was not affected by species,t(18) = 1.459,p= 0.162.
Expertise did not covary with DF.HF or DF.DO response.
Discussion
Univariate and MVPAs identified species- sensitive visual regions in both human and dog brains, but face-sensitive regions in humans only. Our findings also demon- strate that the relative roles of conspecific- preference and face-preference in visuo- social perception differ between humans and dogs. In humans, all conspecific-prefer- ring regions were face-preferring, whereas in dogs, none of the conspecific-preferring regions exhibited face-preference. Direct comparisons of conspecific-preference and face-preference in the visually-responsive cortex confirmed this difference in the relative roles of processing preferences across species. In humans, only regions exhibiting greater face-preference than conspecific-preference were identified.
In contrast, in dogs, only regions exhibiting greater conspecific-prefer- ence than face-preference were identi- fied. These results imply that, unlike in humans, face-preference is not primary to conspecific-preference in the dog visually-responsive cortex.
Face-preference
Regarding face-preference, in humans, the cortical regions that showed stronger response to faces relative to occiputs
corresponded to key structures of the face network (Duchaine and Yovel, 2015). In contrast, in dogs, no cortical regions pre- ferred faces to occiputs. Accordingly, although neural face sensi- tivity appears general across primates, it may not be a general organizing principle of visuo-social perception across mammals.
Figure 4. Across-species RSAs.A, RDMs between select GLM-derived human peaks (first column, sphere radius = 8 mm) and matching dog brain peaks (second column, sphere radius = 4 mm) using a searchlight approach (one samplettest, p,0.001 uncorrected andp,0.05 cluster corrected for FWE), in visually-responsive regions. All RDMs are represented as percentile of Pearson distance (1–Pearson correlation).B, Observed effect sizes (Cohen’sd) for the across-species matching of RDMs for each peak-pair (first column), and modelled effect size patterns reflecting potential driving forces underlying across-species matching (second column); see also Extended DataFigure 4-3. C = conspecific; He = heterospecific; F = face;
O = occiput; L = left; R = right; AMY = amygdala/hippocampus; FuG = fusiform gyrus; cSSG = caudal suprasylvian gyrus;
EMG = ectomarginal gyrus; mESG = mid ectosylvian gyrus; MG = marginal gyrus; mSSG = mid suprasylvian gyrus; rESG = rostral ectosylvian gyrus. See also Extended DataFigures 4-1,4-2,4-3.