International Journal of Environmental Research and Public Health
Article
The Role of Societal Aspects in the Formation of Official COVID-19 Reports: A Data-Driven Analysis
Marcell Tamás Kurbucz1,2,3,*,† , Attila Imre Katona1,† , Zoltán Lantos4,5,† and Zsolt Tibor Kosztyán1,3,5,6,†
Citation: Kurbucz, M.T.; Katona, A.I.;
Lantos, Z.; Kosztyán, Z.T. The Role of Societal Aspects in the Formation of Official COVID-19 Reports: A Data-Driven Analysis.Int. J. Environ.
Res. Public Health2021,18, 1505.
https://doi.org/10.3390/
ijerph18041505
Academic Editor: Carlos de las Heras-Pedrosa
Received: 6 January 2021 Accepted: 1 February 2021 Published: 5 February 2021
Publisher’s Note:MDPI stays neutral with regard to jurisdictional claims in published maps and institutional affil- iations.
Copyright: © 2021 by the authors.
Licensee MDPI, Basel, Switzerland.
This article is an open access article distributed under the terms and conditions of the Creative Commons Attribution (CC BY) license (https://
creativecommons.org/licenses/by/
4.0/).
1 Department of Quantitative Methods, Faculty of Business and Economics, University of Pannonia, Egyetem Street 10, H-8200 Veszprém, Hungary; katona.attila@gtk.uni-pannon.hu (A.I.K.);
kosztyan.zsolt@gtk.uni-pannon.hu (Z.T.K.)
2 Wigner Research Centre for Physics, Department of Computational Sciences, Konkoly-Thege Miklós Street 29-33, H-1121 Budapest, Hungary
3 Research Centre of Faculty of Business and Economics, University of Pannonia, Egyetem Street 10, H-8200 Veszprém, Hungary
4 Health Experience Institue, Közraktár Street 30-32, H-1093 Budapest, Hungary; zoltan.lantos@iask.hu
5 Institute of Advanced Studies (iASK), Chernel Street 14., H-9730 K˝oszeg, Hungary
6 MTA-PE Budapest Ranking Research Group, Egyetem Street 10., H-8200 Veszprém, Hungary
* Correspondence: kurbucz.marcell@gtk.uni-pannon.hu
† These authors contributed equally to this work.
Abstract:This paper investigates the role of socioeconomic considerations in the formation of official COVID-19 reports. To this end, we employ a dataset that contains 1159 pre-processed indicators from the World Bank GroupGovData360andTCdata360platforms and an additional 8 COVID-19 variables generated based on reports from 138 countries. During the analysis, a rank-correlation-based complex method is used to identify the time- and space-varying relations between pandemic variables and the main topics of World Bank Group platforms. The results not only draw attention to the importance of factors such as air traffic, tourism, and corruption in report formation but also support further discipline-specific research by mapping and monitoring a wide range of such relationships. To this end, a source code written in R language is attached that allows for the customization of the analysis and provides up-to-date results.
Keywords:COVID-19; country reports; socioeconomic analysis; data-driven approach
1. Introduction
Research on the COVID-19 pandemic has grown rapidly since the outbreak of the disease; however, despite the enormous media attention on countries’ reports, only a few articles address the number of officially reported cases and deaths as a social phenomenon.
As many studies have pointed out, there is a significant discrepancy between the officially confirmed data and recently published estimates (see, e.g., [1,2]). However, what do these data reflect, beyond the true nature of the virus? Of the few articles dealing with this question, authors [3] examined the protective effect of BCG (Bacillus Calmette–Guérin) vaccine on COVID-19 infections and the death toll while using indicators such as the Human Development Index (HDI), per-capita GDP, and urban population percentage as additional control variables. Moreover, in line with [4], they applied the Corruption Perception Index (CPI) as a proxy for the reliability of reported COVID-19 data. Other authors [5] found that measures of globalization, related to the migrant stock and air travel, were positively associated with both total cases and deaths. Results [6] suggest that more equitable access to healthcare does indeed increase testing rates and lower the death rate. Authors in [7] showed that more democratic political institutions experienced deaths on a larger per-capita scale and sooner than did less democratic countries, and based on [8], the population size and government health expenditure are strongly related to COVID-19 cases.
Int. J. Environ. Res. Public Health2021,18, 1505. https://doi.org/10.3390/ijerph18041505 https://www.mdpi.com/journal/ijerph
Int. J. Environ. Res. Public Health2021,18, 1505 2 of 15
In contrast to these (mostly) discipline-specific studies, our goal is to map, analyze, and monitor a wide range of such relationships in time and space by applying a data- driven approach. To provide a deeper understanding of the role of societal aspects in the formulation of COVID-19 reports, we employ a rank-correlation-based complex method and a dataset that contains 1159 pre-processed indicators from the World Bank Group GovData360andTCdata360platforms and an additional 8 COVID-19 variables. The results not only draw attention to the importance of factors such as air traffic, tourism, and corruption in report formation but also support decision makers and discipline-specific research by providing a source code written in R language (in R Notebook) that allows for the customization of the analysis and provides up-to-date results.
The paper is organized as follows. Section2introduces the data and methodology used during the calculations. Section3presents and discusses the results. Section4contains the measurement error analysis of the results. Finally, Section5provides the conclusions and proposes future research directions.
2. Data and Methodology
2.1. Joint Dataset of GovData360, TCdata360, and COVID-19 Reports
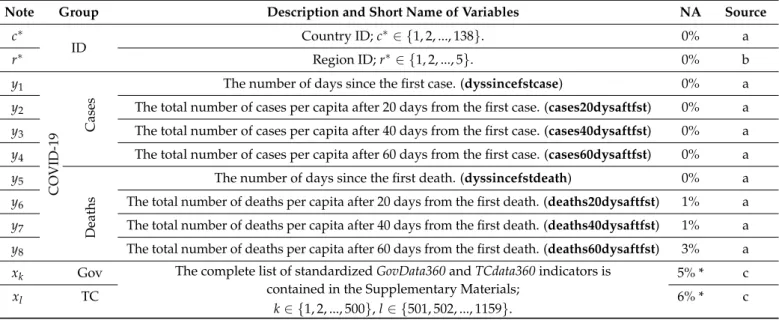
This paper follows the steps of [9] when creating a linked database of governance, trade, and competitiveness indicators with COVID-19 reports. (To derive the up-to-date dataset, we use the author’s R source code, which is publicly available at [10]). Former indicators were obtained from theGovData360andTCdata360platforms using thedata360r (version: 1.0.8) R package [11]. From these platforms, only annual indicators from 2015 and later were collected, and their missing values were replaced with previous annual values in descending order by year until 2015. During pre-processing, indicators (columns) where the ratio of missing values exceeded 50% were filtered out. Then, the same filtration was applied above 25% in the case of countries (rows). Finally, highly correlated variables and variables with near-zero variances were removed, and the standardized form of the retained 1159 indicators was connected with 8 COVID-19 variables, generated on the basis of the official reports of 138 countries [12]. Note that auxiliary indicators measuring the number of data sources and standard error were also filtered out, and variables with near- zero variances were eliminated using the default settings ofnearZeroVarfunction contained by thecaret(version: 6.0-85) R package [13]. The presented data were compiled on 22 July 2020. Table1shows the description of the variables in the structure of the final dataset.
Table 1.Variable description.
Note Group Description and Short Name of Variables NA Source
c∗
ID Country ID;c∗∈ {1, 2, ..., 138}. 0% a
r∗ Region ID;r∗∈ {1, 2, ..., 5}. 0% b
y1
COVID-19 Cases
The number of days since the first case. (dyssincefstcase) 0% a y2 The total number of cases per capita after 20 days from the first case. (cases20dysaftfst) 0% a y3 The total number of cases per capita after 40 days from the first case. (cases40dysaftfst) 0% a y4 The total number of cases per capita after 60 days from the first case. (cases60dysaftfst) 0% a y5
Deaths
The number of days since the first death. (dyssincefstdeath) 0% a y6 The total number of deaths per capita after 20 days from the first death. (deaths20dysaftfst) 1% a y7 The total number of deaths per capita after 40 days from the first death. (deaths40dysaftfst) 1% a y8 The total number of deaths per capita after 60 days from the first death. (deaths60dysaftfst) 3% a xk Gov The complete list of standardizedGovData360andTCdata360indicators is
contained in the Supplementary Materials;
k∈ {1, 2, ..., 500},l∈ {501, 502, ..., 1159}.
5% * c
xl TC 6% * c
* Average missing value ratio. a: [12], the population data are from [14]. b: Own categories based on the country data of [12]. c: [11].
Int. J. Environ. Res. Public Health2021,18, 1505 3 of 15
2.2. Community-Based Model Reduction
Our goal is to map the time- and space-varying relationship between COVID-19 (furthermore dependent) variables (Y :={y1, ..,yM}) and indicators fromGovData360and TCdata360platforms (furthermore independent variables,X :={x1, ..,xN}). To obtain an easily interpretable, comprehensive picture from these connections, similarGovData360 andTCdata360indicators are grouped and characterized by latent variables. The applied steps are as follows.
First, standardized independent variables that have higher absolute (Spearman) rank correlation than anαparameter with at least one dependent variable are selected and denoted asX⊆ X. Formally:
X:={x|x∈ X ∧ ∃y∈ Y, where|cor(y,x)| ≥α}. (1) Then, the rank correlation matrix of the selected variables is used as an adjacency matrixA, in which absolute rank correlation values below aβparameter are substituted by 0. Formally:
aij = [A]ij:=
( 0, if |cor(xi,xj)|<β
|cor(xi,xj)|, if |cor(xi,xj)| ≥β,xi,xj∈ X. (2) Note that the adjacency matrixAdefines a network, where the vertices are the selected variables (V =X), edges are indicated by the nonzero values (eij ∈E⇔[A]ij=aij >0), and their weight is the absolute rank correlation between the selected variables (w:E→ R+,w(i,j) = aij). (Note that the same strategy was applied by, e.g., [15,16], to visualize variable similarity.)
To group similar variables, our goal is to separate this network into groups of vertices that have fewer connections between them than inside the communities. In the literature, this task [17] is referred to as modularity-based community analysis (see, e.g., [18]) or sim- ply community detection (see, e.g., [19]). Although the proposed method may seem more complicated than traditional model reduction methods, they cannot be used because of the large number of variables and relatively few observations. In addition, the visualization of the (correlation) network facilitates control over community formation (especially ifN is large). This benefit is realized by using the Louvain community detection method [20]
with an associated filtrating procedure that gains heterogeneity between the groups by eliminating weakly connected group members.
After Louvain community detection, we obtainC := {c1, ..,cn} communities on G(V,E), which specifies {Gc1, ..,Gcn}= Gpartitions of networkG. As a next step, each community is represented by a single composite (so-called latent) variable ( ˆxci) obtained by the weighted linear combination of member variables:
ˆ
xci = ∑jxjej
∑jej
, j∈Vci,i=1, 2, ..,n, (3) where
ej= 1 λ
∑
t∈Vci
ajtet (4)
is the eigenvector centrality of node j, and λ > 0 is a constant. Louvain modularity and eigenvector centrality were calculated using thecluster_louvainandeigen_centrality functions ofigraph(version: 1.2.4.2) R package, respectively [21]. Note that the use of eigenvector centrality as a weight ensures that deeper embedded variables (within the given community) play a greater role in the formation of the latent variable. (Also note that the use of standardized independent variables results in standardized latent variables).
To increase the homogeneity of communities, we calculate the absolute (Spearman) rank correlation of each variable within the communityiwith the related latent variable ˆxci, and variables that have weaker absolute rank correlation than aγparameter are removed
Int. J. Environ. Res. Public Health2021,18, 1505 4 of 15
from their communities. Finally, the steps of this paragraph (from community detection to filtration) are repeated until no more variables can be eliminated. Note that while the proposed algorithm finds strongly interrelated indicators, correlations between modules still can exist. Thus, completely independent communities are not guaranteed. Although the use of factor analysis with orthogonal rotation may result in independent communities, as there are more observations than variables in the studied dataset, the use of this method is not recommended.
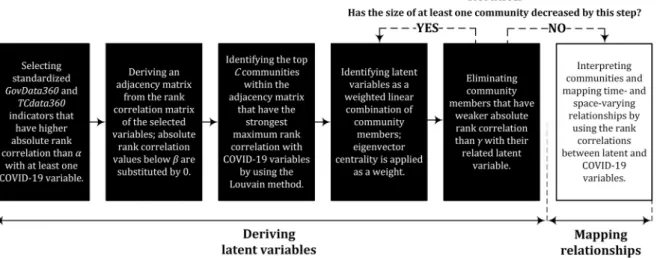
At the end of the process, we rank communities (characterized by latent variables) by their absolute rank correlation with dependent variables. Then, we select the topC ≤n interpretable communities and investigate their relationship with the dependent variables through their absolute rank correlation coefficients. To examine the regional differences in addition to the study of time-varying relationships, these correlations are identified as well on the subset of different regions (see variabler∗in Table1). The calculation steps are summarized in Figure1.
1
Figure 1.Calculation steps. The calculation process can be divided into six steps. The first five steps are responsible for creating communities characterized by latent variables, and the last one is about the interpretation of the communities and mapping their relationships with COVID-19 variables.
3. Results and Discussion
Following the calculation order presented above, we first illustrate and interpret the results of community detection to identify the most important topics reflected in official COVID-19 reports. Then, we investigate the time- and space-varying relations of these communities with different pandemic variables.
3.1. Topics Most Related to COVID-19 Reports
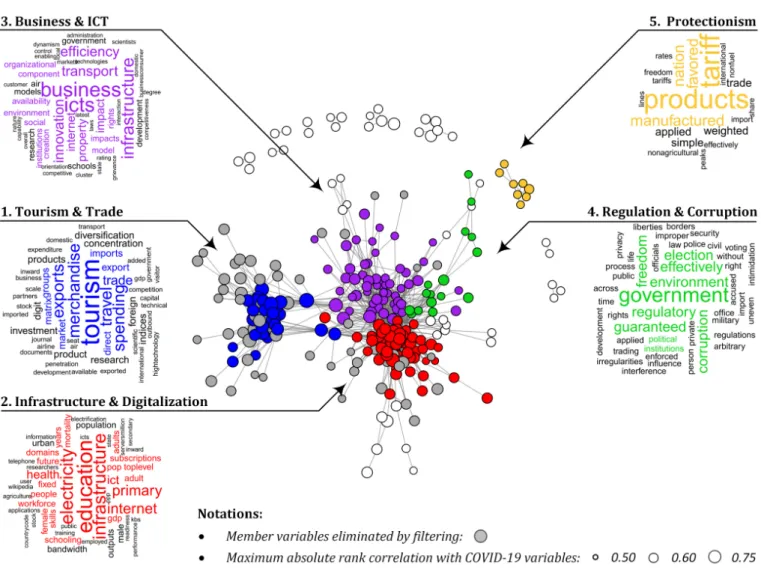
When settingα,β, andγparameters, our goal was to group the widest possible range of importantGovData360andTCdata360indicators without obtaining communities that are difficult to interpret. To accomplish this goal, we set the parameters asα=0.535,β=0.828, and γ = 0.770, which resulted in a network containing 319 indicators (vertices) and 1669 edges, representing the strong correlations among the indicators. Figure2illustrates five communities (C =5) detected within this network and helps their interpretation with word clouds generated on the basis of the names of member indicators. Word clouds were constructed after text cleaning and pre-processing by using thewordcloud(version: 2.6) R package [22]. Since pre-processing was based on a frequency list of terms contained by the names of the indicators, overlapping terms may occur in the composed word clouds. For example, the term “infrastructure” is included in several indicator names such asElectricity and telephony infrastructureandQuality of air transport infrastructure, even though they relate to different aspects of infrastructure.
Int. J. Environ. Res. Public Health2021,18, 1505 5 of 15
1
Figure 2.Detected communities. The five communities of correlatedGovData360andTCdata360indicators. Indicators are denoted by vertices and the edges representing the strong correlations among them. The interpretation of communities is supported by word clouds generated on the basis of the names of member indicators. Note that the applied method may not create purely separable communities, so the same words can occur in different word clouds. This can also occur if the same word appears in the names of significantly different indicators.
As Figure2shows, the topics most related to official COVID-19 reports are (1)tourism and trade, (2)infrastructure and digitalization, (3)business and ICT, (4)regulation and corruption, and (5)protectionism. From these,tourism and tradeassociates with the flow of people and goods, as reflected by the most frequent terms such astourism,travel,merchandise, and imports. The contribution of the database also confirms this finding since most indicators of this community are part of theWorld Travel & Tourism Council(27%),United Nations Conference on Trade and Development Statistics(19%), andWorld Integrated Trade Solution (15%) datasets. The second community describes the infrastructure, especially in the field of digitalization, including variables such asICT access,public services, andsecure internet servers/million pop. Most of these variables are derived from theWorld Economic Forum Global Competitiveness Index(34%),Global Innovation Index(24%), andWorld Development Indicators(17%) databases. The third community, so-calledbusiness and ICT, is adjacent to infrastructure and digitalization. As its name suggests, it is in connection with information and communication technology (ICT); however, this community focuses more on business aspects such asinnovation,efficiency, andcompetitiveness. The groupregulation and corrup- tionincludes variables such asregulatory quality,political environment, andcorruption. The sources of most of these variables are theWorld Justice Project—Rule of Law(31%), Global Innovation Index (25%), and Global State of Democracy (19%). Finally, the fifth community
Int. J. Environ. Res. Public Health2021,18, 1505 6 of 15
is labeledprotectionismbecause all of its variables are related totariffs. The variables for each community are detailed in the Supplementary Materials.
3.2. Relations with COVID-19 Reports
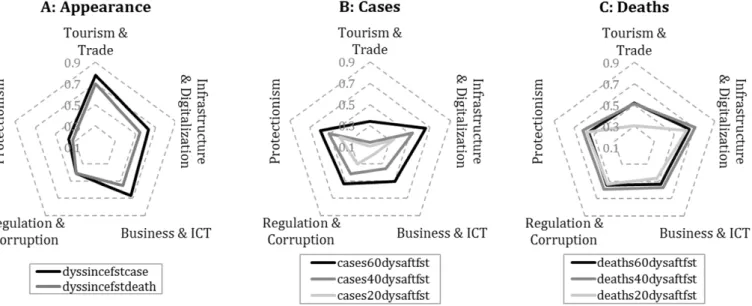
To visualize the absolute rank correlation between the COVID-19 variables and the communities characterized by latent variables, radar charts are employed. In Figure3, these relations are classified into three groups. The first focuses on the time elapsed since the first registered data, while the other two relate to the officially reported cases and deaths per capita aggregated by using different time windows.
2
Figure 3.Absolute rank correlation between COVID-19 and latent variables. The correlations are presented according to the different COVID-19 variables related to the appearance of the virus (A), the number of cases (B), and the death toll (C).
As Figure3shows, indicators measuring the appearance of the virus are strongly correlated with tourism- and trade-related activities. Taking a closer look at the standalone variables within this community, GCI 4.0: Air transportandoutbound travel and tourism expenditurehave the strongest (Spearman) rank correlation coefficients with the days passed since the first case was reported (0.789 and 0.777, respectively). Moreover, this COVID-19 indicator has a strong connection with variables of international trade as well, such as Merchandise: Trade matrix by product groups, imports(0.755),Index Of Export Market Penetration (0.736), andNumber of export partners(0.707) from the same community. In light of these close relationships, it may be surprising to find that this community has a relatively weak connection with the reported number of cases and deaths; however, increased controls at airports and the rapid closure of borders could be reflected in this result.
In contrast totourism and trade, these COVID-19 indicators are closely linked to the other four communities, especially toinfrastructure and digitalization. From this community, variables related to digital development such asfixed broadband subscriptions (per 100 people) andonline creativityshow the strongest positive (Spearman) rank correlation with the num- ber of deaths per capita (0.659 and 0.653, using the 60-day time window), which suggests that a significantly higher death toll has been reported by more developed countries. It is also reflected by the positive correlation of this COVID-19 variable withA. Healthindicator calculated from healthy life expectancy (0.582) as well as by its strong negative relationship withGCI 4.0: Exposure to unsafe drinking water(−0.676).
On the basis of these results, while the data suggesting the appearance of the virus seem to be reliable and relatively easy to explain, reports on cases and deaths appear highly distorted. On the one hand, this distortion may be a consequence of the poor health infrastructure that makes measurement difficult, but on the other hand, political interests
Int. J. Environ. Res. Public Health2021,18, 1505 7 of 15
could also be tied to underreporting. Since theregulation and corruptioncommunity’sregula- tory qualityandfreedom from corruption scoreindicators have a strong positive correlation with the reported number of cases (0.560 and 0.533, respectively) and deaths (0.565 and 0.523, respectively, using the 60-day time window), the reports of countries with higher levels of corruption seem much less authentic. Furthermore, detected communities contain strikingly many indicators related to the development of the information society, which counteracts disinformation.
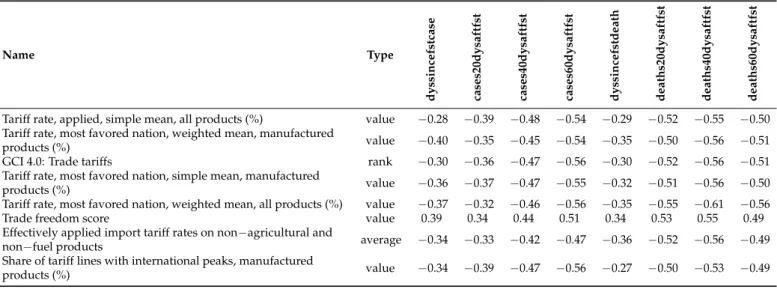
To support discipline-specific research, we detailed the correlations of each member variable with different COVID-19 indicators in the AppendixA. These correlations can provide a deeper understanding of phenomenons mapped by using latent variables. For instance, the strongest correlations were found between the spread of the virus and the latent variable of thetourism and tradecommunity. On the basis of TableA1, the strength of these relationships mainly is due to the indicators such asGCI 4.0: Air transport,International tourism and number of arrivals, andOutbound Travel & Tourism Expenditure, or more generally, due to the number of inbound and outbound travels. Similar to latent variables (see Figure3), these standalone indicators typically show increasing correlations with time window expansion; however, this change over time can vary significantly from region to region.
3.3. Regional Differences
To examine how the results presented in the previous subsection differ from region to region, countries are divided into four groups by using theregion IDvariable (denoted as r∗in Table1). These groups areEurope,Asia,Americas,Africa, andOceania; however, the last group was omitted from the investigation due to its small sample size (two countries).
The regional differences in the relations of COVID-19 and latent variables are presented in Figure4.
On the basis of Figure4, we can conclude that the impact oftourism and tradeon the spread of the virus is significant regardless of region; however, the variable measuring the appearance of the first case shows the highest (Spearman) rank correlation with this community in theAmericasandEurope. In these two regions, variables such asGCI 4.0:
Air transport(0.803 and 0.791, respectively) andgovernment spending on travel and tourism service(0.881 and 0.715, respectively) have one of the highest correlations with days elapsed since the first case. Moreover, in theAmericasandEurope, this community, and especially its tourism- and air-transport-related indicators, shows an increasingly close relationship with the number of registered deaths per capita as the time window expands. Accordingly, regulations on foreign travel restrictions and airport controls are particularly important in these regions.
Next to theAmericasandEurope, inAsia, variables measuring the spread of the virus are also strongly tied to thetourism and tradecommunity, but these variables have a stronger rank correlation with the data related to first death. Unlike other regions, reports fromAsian countries are mostly related toinfrastructure and digitalizationandprotectionismcommunities;
however, even these relations appear weak in comparison with the relationships detected in other regions. To obtain stronger ties, it may be worthwhile to map the topics that contain the most important variables separately for this region.
Int. J. Environ. Res. Public Health2021,18, 1505 8 of 15
2
Figure 4. Absolute rank correlation between COVID-19 and latent variables by region. The correlations are presented according to the different COVID-19 variables that measure the total number of cases/deaths per capita after 20 days (A/D), 40 days (B/E), and 60 days (C/F) from the first case/death, as well as the number of days since the first case/death (G/H).
Finally, reported data both inAfricaandEuropehave remarkably close connections with theregulation and corruptioncommunity, especially with indicators such aspolitical environmentandfreedom from corruption score. While inAfricathese variables are typically related to reported case numbers (0.568 and 0.551), inEuropethey show a stronger corre- lation with deaths (0.495 and 0.583, using the 60-day time window, respectively), which suggests that the reports of these regions are less credible. Note that the correlations of standalone variables calculated on different regional subsamples are contained in the Supplementary Materials.
Int. J. Environ. Res. Public Health2021,18, 1505 9 of 15
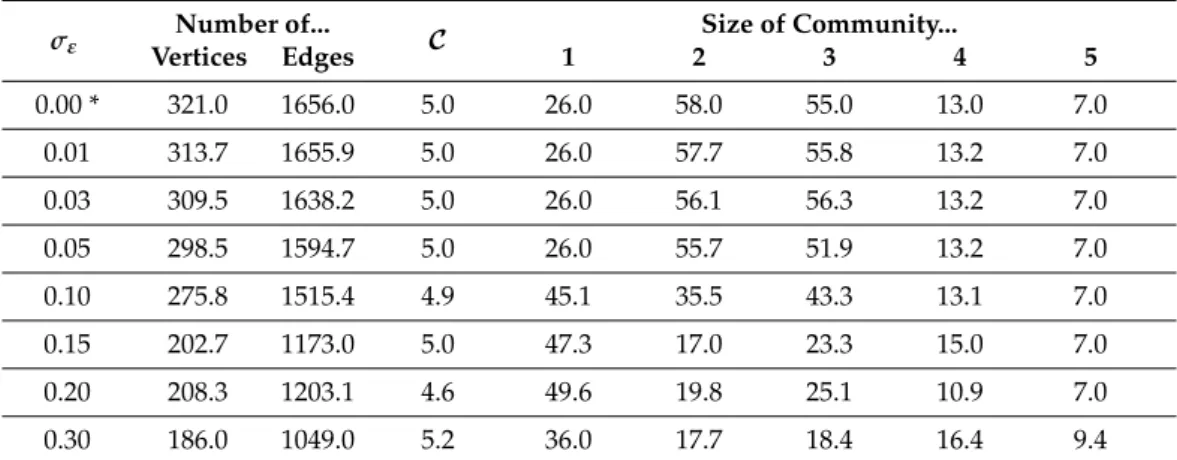
4. Measurement Error Analysis
As it was discussed in Section3.2, while the data suggesting the appearance of the virus seem to be reliable and relatively easy to explain, reports on cases and deaths appear highly distorted. Since these measurement errors can affect the community detection outcomes through the distorted rank correlation coefficients, in this section, we conduct a simulation to analyze the validity of our results under the presence of measurement errors.
During the simulation, by using the multiplicative measurement error model, we added random measurement errors to the dependent variables and conducted all the calculation steps described by Figure1. The applied measurement error model is as follows:
y∗i =yiεi, (5)
where the reported and the masked dependent variables are denoted byyiandy∗i, and εiis an independent random variable following a normal distribution with a mean 1 and standard deviationσε. During the simulation,y∗i was estimated by using differentσεvalues, then the resulted communities were examined. In order to characterize the structure of the communities we investigate the number of vertices and edges to the correlation network of the variables, number of communities found, and number of included variables in each community (see Table2).
Table 2.Results of the measurement error analysis.
σε
Number of...
C Size of Community...
Vertices Edges 1 2 3 4 5
0.00 * 321.0 1656.0 5.0 26.0 58.0 55.0 13.0 7.0
0.01 313.7 1655.9 5.0 26.0 57.7 55.8 13.2 7.0
0.03 309.5 1638.2 5.0 26.0 56.1 56.3 13.2 7.0
0.05 298.5 1594.7 5.0 26.0 55.7 51.9 13.2 7.0
0.10 275.8 1515.4 4.9 45.1 35.5 43.3 13.1 7.0
0.15 202.7 1173.0 5.0 47.3 17.0 23.3 15.0 7.0
0.20 208.3 1203.1 4.6 49.6 19.8 25.1 10.9 7.0
0.30 186.0 1049.0 5.2 36.0 17.7 18.4 16.4 9.4
The calculation parameters used are as follows:α= 0.535,β=0.828 andγ=0.770. * Original case, whereyi=yi∗.
Although number of extracted communities does not change significantly when σε≥0.1, both the structure of the correlation network and the sizes of the communities start to vary. On the basis of this additional calculation, communities presented in Section3.1 are stable in the event of a small or moderate measurement error.
5. Conclusions and Future Work
Although some of the recent studies have already investigated the relationship of COVID-19 data with different socioeconomic indicators, the role of societal considerations in the formation of official COVID-19 data is not yet clear. In contrast to these studies, our goal was to map, analyze, and monitor a wide range of such relationships in time and space by applying a data-driven approach. To this end, we employed a rank-correlation-based complex method and a dataset that contains 1159 pre-processed indicators from the World Bank GroupGovData360andTCdata360platforms and an additional 8 COVID-19 variables generated on the basis of the officially reported number of cases and deaths.
From our results, the topics most related to official COVID-19 reports aretourism and trade,infrastructure and digitalization,business and ICT,regulation and corruption, and protectionism. By examining these topics and the variables they compress, we found that tourism- and air-transport-related variables are key factors in the spread of the virus, es- pecially in theAmericasandEurope. In these two regions, the variables of thetourism and
Int. J. Environ. Res. Public Health2021,18, 1505 10 of 15
tradecommunity show close connections with the reported death toll as well, which also emphasizes the importance of regulations on foreign travel restrictions and airport controls.
In addition, the number of reported cases and deaths seems unreliable since developed countries generally reported more cases and deaths than developing countries. In line with the results, the two possible reasons for underreporting may be the poor health infrastruc- ture that makes measurement difficult and the political will that is opposed to exploring and presenting the real epidemiological situation. Accordingly, we experienced the closest relationship between the level of corruption and reported data inEuropeandAfrica.
Using the proposed analysis, further interesting regional and temporal patterns can be identified, as the data will be updated over time. To support this research, we attach an R Notebook file (see Supplementary Materials) that not only updates the dataset but is also able to conduct all the analysis steps, including variable filtering and the compilation of figures. As a further advantage, this source code can be easily customized and allows researchers to apply arbitrary time frames during the analysis. Finally, in the AppendixA, we provide all the relationships identified during the analysis to support discipline-specific investigations.
Supplementary Materials:The following are available online atwww.mdpi.com/xxx/s1. File B.1:
Metadata. The metadata ofGovData360andTCdata360indicators used. File B.2: Regional correlations.
Standalone correlations in the regional dataset. File B.3: Source of COVID-19 data. The source of the COVID-19 dataset collected by [13]. According to the place of their publication, these sources are websites of ministries of health (43%), websites of public health institutes (9%), websites from other national authorities (6%), WHO websites, and WHO situation reports (2%), and official dashboards (10%). Besides, ECDPC screens social media accounts maintained by national authorities, for example Twitter, Facebook, YouTube, or Telegram accounts run by ministries of health (28%) and other official sources (e.g., official media outlets) (2%). File B.4: Data generation and analysis. Datasets were generated and analyzed with R Notebook, which can be used to update datasets and customize the analyses.
Author Contributions:Conceptualization, M.T.K. and A.I.K.; methodology, M.T.K., A.I.K. and Z.T.K.;
software, M.T.K. and A.I.K.; validation, M.T.K., A.I.K., Z.L. and Z.T.K.; formal analysis, M.T.K. and A.I.K.; investigation, M.T.K., A.I.K., Z.L. and Z.T.K.; resources, M.T.K., A.I.K., Z.L. and Z.T.K.; data curation, M.T.K. and A.I.K.; writing—original draft preparation, M.T.K., A.I.K., Z.L. and Z.T.K.;
writing—review and editing, M.T.K. and A.I.K.; visualization, M.T.K. and A.I.K.; supervision, M.T.K.;
project administration, M.T.K.; funding acquisition, Z.T.K. All authors have read and agreed to the published version of the manuscript.
Funding:We acknowledge the financial support of Széchenyi 2020 under the EFOP-3.6.1-16-2016-00015.
Institutional Review Board Statement:Not applicable.
Informed Consent Statement:Not applicable.
Data Availability Statement:Data and source code are available in the Supplementary Material.
Conflicts of Interest:The authors declare no conflict of interest.
Int. J. Environ. Res. Public Health2021,18, 1505 11 of 15
Appendix A. Standalone Correlations
Table A1. Standalone correlations in thetourism and tradecommunity. Spearman rank correlations between COVID-19 variables and indicators of thetourism and tradecommunity in the worldwide dataset.
Name Type
dyssincefstcase cases20dysaftfst cases40dysaftfst cases60dysaftfst dyssincefstdeath deaths20dysaftfst deaths40dysaftfst deaths60dysaftfst
Trade, competition, & market scale rank * 0.69 −0.15 0.07 0.28 0.68 0.19 0.42 0.43
Scientific and technical journal articles value 0.77 −0.19 0.07 0.25 0.69 0.20 0.43 0.44
Travel and Tourism direct contribution to GDP usd nominal 0.75 −0.28 −0.04 0.15 0.66 0.08 0.32 0.35 Outbound Travel & Tourism Expenditure usd nominal 0.78 −0.19 0.04 0.25 0.70 0.18 0.41 0.44
Index Of Export Market Penetration value 0.74 −0.19 0.06 0.27 0.71 0.30 0.51 0.53
Merchandise: Trade matrix by product groups, imports value 0.76 −0.27 −0.01 0.20 0.67 0.16 0.40 0.41 Government spending on travel and Tourism service usd nominal 0.67 −0.18 0.05 0.23 0.68 0.17 0.41 0.42 Capital investment in Travel and Tourism usd real 0.71 −0.21 −0.03 0.15 0.62 0.09 0.32 0.35
Services, etc., value added (current US$) value 0.70 −0.27 −0.02 0.17 0.66 0.08 0.33 0.36
Business Tourism Spending usd_nominal 0.74 −0.29 −0.06 0.15 0.64 0.08 0.32 0.37
Number of export partners value 0.71 −0.15 0.08 0.29 0.66 0.32 0.51 0.53
Foreign Direct Investment: Inward stock percentage of world 0.69 −0.14 0.09 0.28 0.65 0.20 0.42 0.45
Domestic Tourism Spending usd nominal 0.70 −0.36 −0.12 0.08 0.63 0.04 0.29 0.34
Available airline seat rank * 0.76 −0.22 0.00 0.20 0.64 0.11 0.33 0.35
High-technology exports (current US$) value 0.69 −0.14 0.08 0.27 0.63 0.25 0.45 0.45
Visitor Exports (Foreign spending) usd real 0.74 −0.11 0.10 0.27 0.66 0.23 0.42 0.43
No. Of Imported HS6 Digit Products value 0.68 −0.17 0.06 0.27 0.66 0.29 0.50 0.51
Citable documents H index rank * 0.71 −0.19 0.06 0.25 0.67 0.25 0.47 0.49
No. Of Exported HS6 Digit Products value 0.65 −0.13 0.10 0.30 0.64 0.32 0.51 0.52
GCI 4.0: Air transport score 0.79 −0.07 0.16 0.35 0.66 0.28 0.47 0.46
International tourism, number of arrivals value 0.72 −0.16 0.05 0.24 0.64 0.18 0.40 0.43
Research and development (R&D) rank * 0.72 0.01 0.23 0.39 0.65 0.36 0.53 0.51
GCI 4.0: Research rank * 0.72 0.03 0.26 0.42 0.62 0.37 0.55 0.54
Merchandise: Concentration and diversification indices of exports by country
diversification
index * 0.63 −0.04 0.18 0.34 0.60 0.39 0.56 0.53
Merchandise: Trade matrix by product groups, exports value 0.62 −0.28 −0.06 0.12 0.56 0.09 0.32 0.34 Merchandise: Concentration and diversification
indices of imports by country
diversification
index * 0.67 0.00 0.23 0.42 0.64 0.38 0.57 0.58
* The correlations of the rank variables and diversification indices were multiplied by−1.
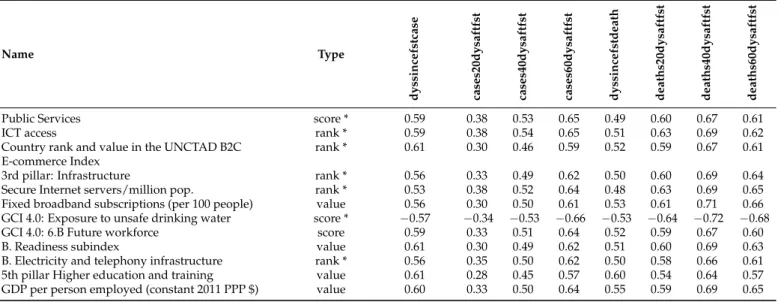
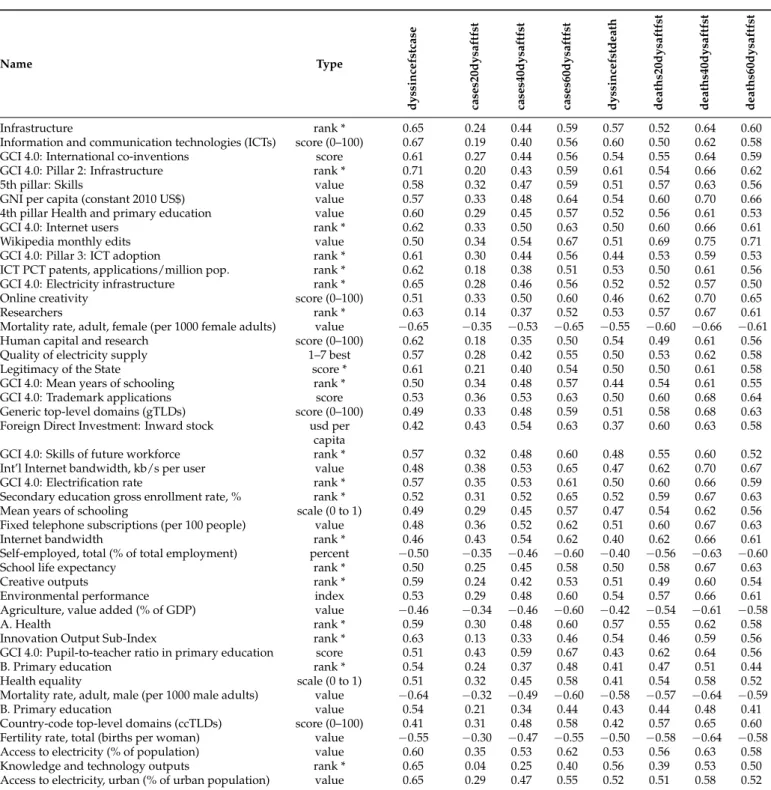
Table A2.Standalone correlations in theinfrastructure and digitalizationcommunity. Spearman rank correlations between COVID-19 variables and indicators of theinfrastructure and digitalizationcommunity in the worldwide dataset.
Name Type
dyssincefstcase cases20dysaftfst cases40dysaftfst cases60dysaftfst dyssincefstdeath deaths20dysaftfst deaths40dysaftfst deaths60dysaftfst
Public Services score * 0.59 0.38 0.53 0.65 0.49 0.60 0.67 0.61
ICT access rank * 0.59 0.38 0.54 0.65 0.51 0.63 0.69 0.62
Country rank and value in the UNCTAD B2C E-commerce Index
rank * 0.61 0.30 0.46 0.59 0.52 0.59 0.67 0.61
3rd pillar: Infrastructure rank * 0.56 0.33 0.49 0.62 0.50 0.60 0.69 0.64
Secure Internet servers/million pop. rank * 0.53 0.38 0.52 0.64 0.48 0.63 0.69 0.65
Fixed broadband subscriptions (per 100 people) value 0.56 0.30 0.50 0.61 0.53 0.61 0.71 0.66
GCI 4.0: Exposure to unsafe drinking water score * −0.57 −0.34 −0.53 −0.66 −0.53 −0.64 −0.72 −0.68
GCI 4.0: 6.B Future workforce score 0.59 0.33 0.51 0.64 0.52 0.59 0.67 0.60
B. Readiness subindex value 0.61 0.30 0.49 0.62 0.51 0.60 0.69 0.63
B. Electricity and telephony infrastructure rank * 0.56 0.35 0.50 0.62 0.50 0.58 0.66 0.61
5th pillar Higher education and training value 0.61 0.28 0.45 0.57 0.60 0.54 0.64 0.57
GDP per person employed (constant 2011 PPP $) value 0.60 0.33 0.50 0.64 0.55 0.59 0.69 0.65
Int. J. Environ. Res. Public Health2021,18, 1505 12 of 15
Table A2.Cont.
Name Type
dyssincefstcase cases20dysaftfst cases40dysaftfst cases60dysaftfst dyssincefstdeath deaths20dysaftfst deaths40dysaftfst deaths60dysaftfst
Infrastructure rank * 0.65 0.24 0.44 0.59 0.57 0.52 0.64 0.60
Information and communication technologies (ICTs) score (0–100) 0.67 0.19 0.40 0.56 0.60 0.50 0.62 0.58
GCI 4.0: International co-inventions score 0.61 0.27 0.44 0.56 0.54 0.55 0.64 0.59
GCI 4.0: Pillar 2: Infrastructure rank * 0.71 0.20 0.43 0.59 0.61 0.54 0.66 0.62
5th pillar: Skills value 0.58 0.32 0.47 0.59 0.51 0.57 0.63 0.56
GNI per capita (constant 2010 US$) value 0.57 0.33 0.48 0.64 0.54 0.60 0.70 0.66
4th pillar Health and primary education value 0.60 0.29 0.45 0.57 0.52 0.56 0.61 0.53
GCI 4.0: Internet users rank * 0.62 0.33 0.50 0.63 0.50 0.60 0.66 0.61
Wikipedia monthly edits value 0.50 0.34 0.54 0.67 0.51 0.69 0.75 0.71
GCI 4.0: Pillar 3: ICT adoption rank * 0.61 0.30 0.44 0.56 0.44 0.53 0.59 0.53
ICT PCT patents, applications/million pop. rank * 0.62 0.18 0.38 0.51 0.53 0.50 0.61 0.56
GCI 4.0: Electricity infrastructure rank * 0.65 0.28 0.46 0.56 0.52 0.52 0.57 0.50
Online creativity score (0–100) 0.51 0.33 0.50 0.60 0.46 0.62 0.70 0.65
Researchers rank * 0.63 0.14 0.37 0.52 0.53 0.57 0.67 0.61
Mortality rate, adult, female (per 1000 female adults) value −0.65 −0.35 −0.53 −0.65 −0.55 −0.60 −0.66 −0.61
Human capital and research score (0–100) 0.62 0.18 0.35 0.50 0.54 0.49 0.61 0.56
Quality of electricity supply 1–7 best 0.57 0.28 0.42 0.55 0.50 0.53 0.62 0.58
Legitimacy of the State score * 0.61 0.21 0.40 0.54 0.50 0.50 0.61 0.58
GCI 4.0: Mean years of schooling rank * 0.50 0.34 0.48 0.57 0.44 0.54 0.61 0.55
GCI 4.0: Trademark applications score 0.53 0.36 0.53 0.63 0.50 0.60 0.68 0.64
Generic top-level domains (gTLDs) score (0–100) 0.49 0.33 0.48 0.59 0.51 0.58 0.68 0.63
Foreign Direct Investment: Inward stock usd per capita
0.42 0.43 0.54 0.63 0.37 0.60 0.63 0.58
GCI 4.0: Skills of future workforce rank * 0.57 0.32 0.48 0.60 0.48 0.55 0.60 0.52
Int’l Internet bandwidth, kb/s per user value 0.48 0.38 0.53 0.65 0.47 0.62 0.70 0.67
GCI 4.0: Electrification rate rank * 0.57 0.35 0.53 0.61 0.50 0.60 0.66 0.59
Secondary education gross enrollment rate, % rank * 0.52 0.31 0.52 0.65 0.52 0.59 0.67 0.63
Mean years of schooling scale (0 to 1) 0.49 0.29 0.45 0.57 0.47 0.54 0.62 0.56
Fixed telephone subscriptions (per 100 people) value 0.48 0.36 0.52 0.62 0.51 0.60 0.67 0.63
Internet bandwidth rank * 0.46 0.43 0.54 0.62 0.40 0.62 0.66 0.61
Self-employed, total (% of total employment) percent −0.50 −0.35 −0.46 −0.60 −0.40 −0.56 −0.63 −0.60
School life expectancy rank * 0.50 0.25 0.45 0.58 0.50 0.58 0.67 0.63
Creative outputs rank * 0.59 0.24 0.42 0.53 0.51 0.49 0.60 0.54
Environmental performance index 0.53 0.29 0.48 0.60 0.54 0.57 0.66 0.61
Agriculture, value added (% of GDP) value −0.46 −0.34 −0.46 −0.60 −0.42 −0.54 −0.61 −0.58
A. Health rank * 0.59 0.30 0.48 0.60 0.57 0.55 0.62 0.58
Innovation Output Sub-Index rank * 0.63 0.13 0.33 0.46 0.54 0.46 0.59 0.56
GCI 4.0: Pupil-to-teacher ratio in primary education score 0.51 0.43 0.59 0.67 0.43 0.62 0.64 0.56
B. Primary education rank * 0.54 0.24 0.37 0.48 0.41 0.47 0.51 0.44
Health equality scale (0 to 1) 0.51 0.32 0.45 0.58 0.41 0.54 0.58 0.52
Mortality rate, adult, male (per 1000 male adults) value −0.64 −0.32 −0.49 −0.60 −0.58 −0.57 −0.64 −0.59
B. Primary education value 0.54 0.21 0.34 0.44 0.43 0.44 0.48 0.41
Country-code top-level domains (ccTLDs) score (0–100) 0.41 0.31 0.48 0.58 0.42 0.57 0.65 0.60 Fertility rate, total (births per woman) value −0.55 −0.30 −0.47 −0.55 −0.50 −0.58 −0.64 −0.58
Access to electricity (% of population) value 0.60 0.35 0.53 0.62 0.53 0.56 0.63 0.58
Knowledge and technology outputs rank * 0.65 0.04 0.25 0.40 0.56 0.39 0.53 0.50
Access to electricity, urban (% of urban population) value 0.65 0.29 0.47 0.55 0.52 0.51 0.58 0.52
* The correlations of the rank and some score variables were multiplied by−1.
Int. J. Environ. Res. Public Health2021,18, 1505 13 of 15
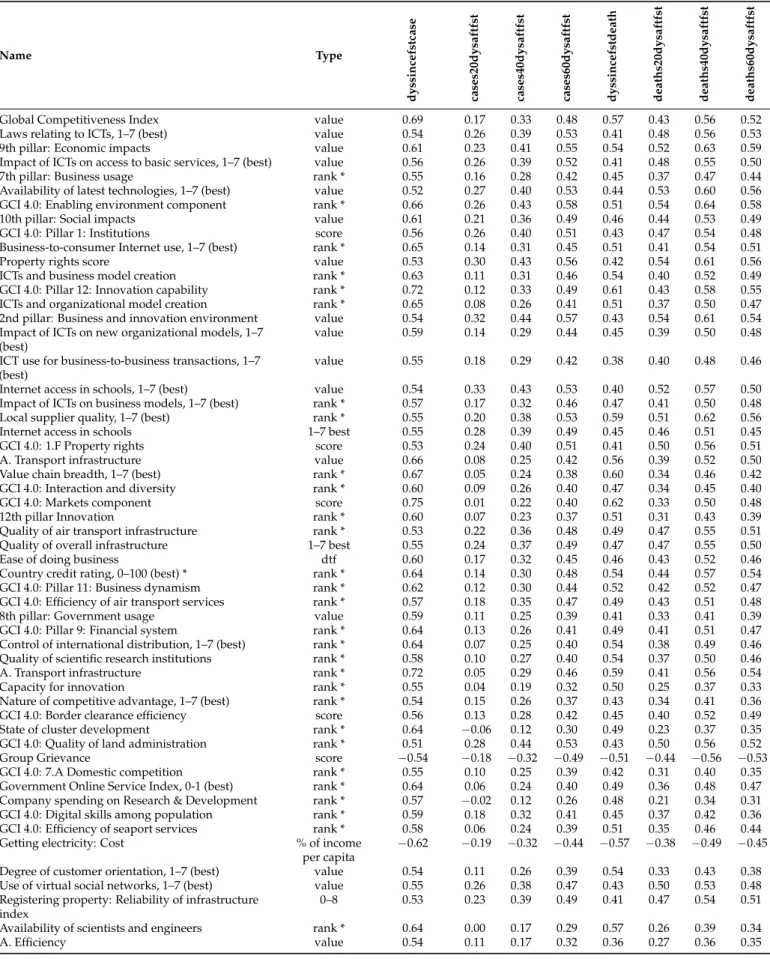
Table A3. Standalone correlations in thebusiness and ICTcommunity. Spearman rank correlations between COVID-19 variables and indicators of thebusiness and ICTcommunity in the worldwide dataset.
Name Type
dyssincefstcase cases20dysaftfst cases40dysaftfst cases60dysaftfst dyssincefstdeath deaths20dysaftfst deaths40dysaftfst deaths60dysaftfst
Global Competitiveness Index value 0.69 0.17 0.33 0.48 0.57 0.43 0.56 0.52
Laws relating to ICTs, 1–7 (best) value 0.54 0.26 0.39 0.53 0.41 0.48 0.56 0.53
9th pillar: Economic impacts value 0.61 0.23 0.41 0.55 0.54 0.52 0.63 0.59
Impact of ICTs on access to basic services, 1–7 (best) value 0.56 0.26 0.39 0.52 0.41 0.48 0.55 0.50
7th pillar: Business usage rank * 0.55 0.16 0.28 0.42 0.45 0.37 0.47 0.44
Availability of latest technologies, 1–7 (best) value 0.52 0.27 0.40 0.53 0.44 0.53 0.60 0.56
GCI 4.0: Enabling environment component rank * 0.66 0.26 0.43 0.58 0.51 0.54 0.64 0.58
10th pillar: Social impacts value 0.61 0.21 0.36 0.49 0.46 0.44 0.53 0.49
GCI 4.0: Pillar 1: Institutions score 0.56 0.26 0.40 0.51 0.43 0.47 0.54 0.48
Business-to-consumer Internet use, 1–7 (best) rank * 0.65 0.14 0.31 0.45 0.51 0.41 0.54 0.51
Property rights score value 0.53 0.30 0.43 0.56 0.42 0.54 0.61 0.56
ICTs and business model creation rank * 0.63 0.11 0.31 0.46 0.54 0.40 0.52 0.49
GCI 4.0: Pillar 12: Innovation capability rank * 0.72 0.12 0.33 0.49 0.61 0.43 0.58 0.55
ICTs and organizational model creation rank * 0.65 0.08 0.26 0.41 0.51 0.37 0.50 0.47
2nd pillar: Business and innovation environment value 0.54 0.32 0.44 0.57 0.43 0.54 0.61 0.54 Impact of ICTs on new organizational models, 1–7
(best)
value 0.59 0.14 0.29 0.44 0.45 0.39 0.50 0.48
ICT use for business-to-business transactions, 1–7 (best)
value 0.55 0.18 0.29 0.42 0.38 0.40 0.48 0.46
Internet access in schools, 1–7 (best) value 0.54 0.33 0.43 0.53 0.40 0.52 0.57 0.50
Impact of ICTs on business models, 1–7 (best) rank * 0.57 0.17 0.32 0.46 0.47 0.41 0.50 0.48
Local supplier quality, 1–7 (best) rank * 0.55 0.20 0.38 0.53 0.59 0.51 0.62 0.56
Internet access in schools 1–7 best 0.55 0.28 0.39 0.49 0.45 0.46 0.51 0.45
GCI 4.0: 1.F Property rights score 0.53 0.24 0.40 0.51 0.41 0.50 0.56 0.51
A. Transport infrastructure value 0.66 0.08 0.25 0.42 0.56 0.39 0.52 0.50
Value chain breadth, 1–7 (best) rank * 0.67 0.05 0.24 0.38 0.60 0.34 0.46 0.42
GCI 4.0: Interaction and diversity rank * 0.60 0.09 0.26 0.40 0.47 0.34 0.45 0.40
GCI 4.0: Markets component score 0.75 0.01 0.22 0.40 0.62 0.33 0.50 0.48
12th pillar Innovation rank * 0.60 0.07 0.23 0.37 0.51 0.31 0.43 0.39
Quality of air transport infrastructure rank * 0.53 0.22 0.36 0.48 0.49 0.47 0.55 0.51
Quality of overall infrastructure 1–7 best 0.55 0.24 0.37 0.49 0.47 0.47 0.55 0.50
Ease of doing business dtf 0.60 0.17 0.32 0.45 0.46 0.43 0.52 0.46
Country credit rating, 0–100 (best) * rank * 0.64 0.14 0.30 0.48 0.54 0.44 0.57 0.54
GCI 4.0: Pillar 11: Business dynamism rank * 0.62 0.12 0.30 0.44 0.52 0.42 0.52 0.47
GCI 4.0: Efficiency of air transport services rank * 0.57 0.18 0.35 0.47 0.49 0.43 0.51 0.48
8th pillar: Government usage value 0.59 0.11 0.25 0.39 0.41 0.33 0.41 0.39
GCI 4.0: Pillar 9: Financial system rank * 0.64 0.13 0.26 0.41 0.49 0.41 0.51 0.47
Control of international distribution, 1–7 (best) rank * 0.64 0.07 0.25 0.40 0.54 0.38 0.49 0.46
Quality of scientific research institutions rank * 0.58 0.10 0.27 0.40 0.54 0.37 0.50 0.46
A. Transport infrastructure rank * 0.72 0.05 0.29 0.46 0.59 0.41 0.56 0.54
Capacity for innovation rank * 0.55 0.04 0.19 0.32 0.50 0.25 0.37 0.33
Nature of competitive advantage, 1–7 (best) rank * 0.54 0.15 0.26 0.37 0.43 0.34 0.41 0.36
GCI 4.0: Border clearance efficiency score 0.56 0.13 0.28 0.42 0.45 0.40 0.52 0.49
State of cluster development rank * 0.64 −0.06 0.12 0.30 0.49 0.23 0.37 0.35
GCI 4.0: Quality of land administration rank * 0.51 0.28 0.44 0.53 0.43 0.50 0.56 0.52
Group Grievance score −0.54 −0.18 −0.32 −0.49 −0.51 −0.44 −0.56 −0.53
GCI 4.0: 7.A Domestic competition rank * 0.55 0.10 0.25 0.39 0.42 0.31 0.40 0.35
Government Online Service Index, 0-1 (best) rank * 0.64 0.06 0.24 0.40 0.49 0.36 0.48 0.47
Company spending on Research & Development rank * 0.57 −0.02 0.12 0.26 0.48 0.21 0.34 0.31
GCI 4.0: Digital skills among population rank * 0.59 0.18 0.32 0.41 0.45 0.37 0.42 0.36
GCI 4.0: Efficiency of seaport services rank * 0.58 0.06 0.24 0.39 0.51 0.35 0.46 0.44
Getting electricity: Cost % of income
per capita
−0.62 −0.19 −0.32 −0.44 −0.57 −0.38 −0.49 −0.45
Degree of customer orientation, 1–7 (best) value 0.54 0.11 0.26 0.39 0.54 0.33 0.43 0.38
Use of virtual social networks, 1–7 (best) value 0.55 0.26 0.38 0.47 0.43 0.50 0.53 0.48
Registering property: Reliability of infrastructure index
0–8 0.53 0.23 0.39 0.49 0.41 0.47 0.54 0.51
Availability of scientists and engineers rank * 0.64 0.00 0.17 0.29 0.57 0.26 0.39 0.34
A. Efficiency value 0.54 0.11 0.17 0.32 0.36 0.27 0.36 0.35
* The correlations of the rank variables were multiplied by−1.