Feature Level Complexity and Coupling Analysis in 4GL Systems
Andr´as Kicsi1, Viktor Csuvik1, L´aszl´o Vid´acs1,2, ´Arp´ad Besz´edes1, and Tibor Gyim´othy1,2
1 Department of Software Engineering
2 MTA-SZTE Research Group on Artificial Intelligence University of Szeged, Hungary
{akicsi,csuvikv,lac,beszedes,gyimothy}@inf.u-szeged.hu
Abstract. Product metrics are widely used in the maintenance and evo- lution phase of software development to advise the development team about software quality. Although most of these metrics are defined for mainstream languages, several of them were adapted to fourth generation languages (4GL) as well. Usual concepts like size, complexity and cou- pling need to be re-interpreted and adapted to program elements defined by these languages. In this paper we take a further step in this process to address product line development in 4GL. Adopting product line ar- chitecture is a necessary step to handle challenges of a growing number of similar product variants. The product line adoption process itself is a tedious task where features of the product variants play crucial role.
Features represent a higher level of abstraction that are cross-cutting to program elements of 4GL applications. We propose a set of metrics re- lated to features by linking existing program elements to metrics and by relating features with each other. The focus of this study is on complex- ity and coupling metrics. We provide a metrics based analysis of several variants of a large scale industrial product line written in the Magic XPA 4GL language.
Keywords: Product lines, SPL, feature analysis, 4GL, quality, metrics, com- plexity, coupling
1 Introduction
Quality assurance tools rely heavily on the use of product metrics. Despite the great variety of metrics that are already defined for mainstream languages [1], there exists only a few solutions for fourth generations languages (4GL). The structure of these languages are closer to human thinking and part of the program logic is provided by the environment itself. Usual notions of size, complexity and coupling need to be re-interpreted in these cases. Building on previous works on metrics based quality assurance for 4GL [2, 3] we take new direction to extend metrics towards product line architectures. Maintaining and releasing similar
new products accumulates significant overhead over time. The natural way of handling new customer needs is the clone-and-own approach, where product variants have parallel life cycles in independent repositories. Introducing product line architecture offers a long term solution to these challenges [4]. Product line adoption is usually approached from three directions: the proactive approach starts with domain analysis and applies variability management from scratch.
The reactive approach incrementally replies to the new customer needs when they arise. Finally, the extractive approach analyzes existing products to obtain feature models and build the product line architecture [5]. An advantage of the extractive approach in general is that several reverse engineering methods exist to support feature extraction and analysis [6]. Static analysis methods for obtaining structural information and dependencies and the analysis of dynamic execution traces foster feature detection and location activities [7, 8].
In this paper we propose product metrics at the feature level. These metrics are extensions of usual complexity and coupling metrics linked to features. Our work is motivated by a research project where product line architecture is to be built based on an existing set of products. The subject system is a high market value logistical wholesale system, which has been adapted to various domains in the past using clone-and-own method. Product variants of this system were written in different main versions of Magic 4GL in more than 20 years. In this current work we concentrate on complexity [9] and coupling metrics. The proposed metrics play a role in the product line adoption process and can be used in the future maintenance and evolution of the product line. We provide the following contributions: (1) we propose metrics at the feature level for Magic 4GL; (2) we describe empirical experiments of 4 product variants of a large scale industrial system; and (3) we analyze 4 product variants and 10 high level features of the product line using the proposed metrics.
The paper is organized as follows. We present the background of our research in the next section by depicting the variability in systems developed by a software company using the Magic language. We introduce the proposed feature level metrics on complexity and coupling in Section 3. Measurements on 4 product variants and the analysis based on 10 high level features of the product line are presented in Section 4. Related work is discussed in Section 5, and we conclude the paper in the last section.
2 Background
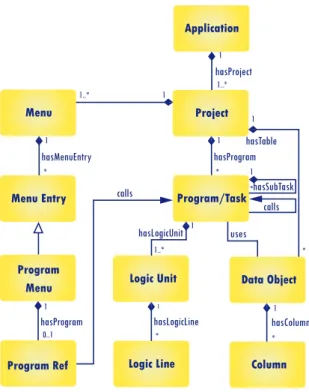
The most important parts of a Magic application are illustrated in Figure 1.
An application written in Magic usually consists of one or more projects. These projects contain tasks which are units that handle the actual work done by the application. They can control logic units that define the background logic and make use of data stored in data objects. Tasks are the closest things we would call methods in a traditional language. A task can contain other tasks too, which defines a hierarchy. The topmost level of these tasks are called programs which can be viewed as distinguished tasks. Programs are usually small enough
Menu Project Application
Data Object Program/Task
Logic Unit
Logic Line Column
Menu Entry
Program Menu
Program Ref
hasSubTask calls hasLogicUnit
hasLogicLine
1
*
1 1..*
1
*
hasProgram 1
* hasProject
1
1..*
uses hasTable
1
*
1
* hasColumn hasMenuEntry
1
*
1..* 1
hasProgram 1 0..1
calls
Fig. 1.An illustration of the main components of a Magic system
units that we can handle as a process working towards a single goal, which can make programs ideal units for feature extraction. Programs can also be called by elements called menus. A menu is a control unit inside the application through which calls can be initiated to perform different processes.
Software quality is a highly researched subject with properly defined quality metrics in many specific fields of software development. This also involves SPL adoption and even Magic. Software quality is not highly different in 4GL sys- tems than in a traditional environment, most common quality metrics can be computed but there may be a need to redefine or modify some or adopt new ones. Quality can be defined to 4GL systems just as well as to any other branch of software development. Some metrics are already well defined for Magic tasks and systems too [9].
Complexity as a quality metric is also a popular field of research. Since com- plexity can be understood in many ways many different complexities exist even in the same domain. Undoubtedly the best complexity metrics are the ones that correlate best with the opinions of the users, in this case most frequently the developers. Scientific work has already compared several of these metrics based on user questionnaires [10] even in the 4GL domain, including Magic [9].
3 Proposed Metrics
Features represent a higher level abstraction over program code. This is the area where domain experts and developers need to interact: features provide a logical view of system functionality, while they are implemented by various parts of the program code. In previous work we provided methods for feature extraction based on textual similarity and call graphs [11, 12]. Our textual similarity based extraction relies on the Latent Semantic Indexing (LSI) technique. Textual sim- ilarity is often referred to as Information Retrieval (IR) in scientific literature, we use this abbreviation in the following chapters.
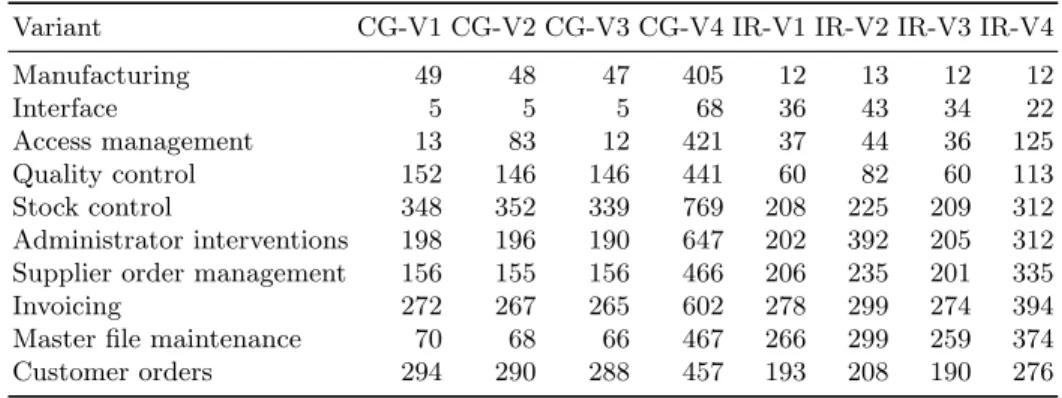
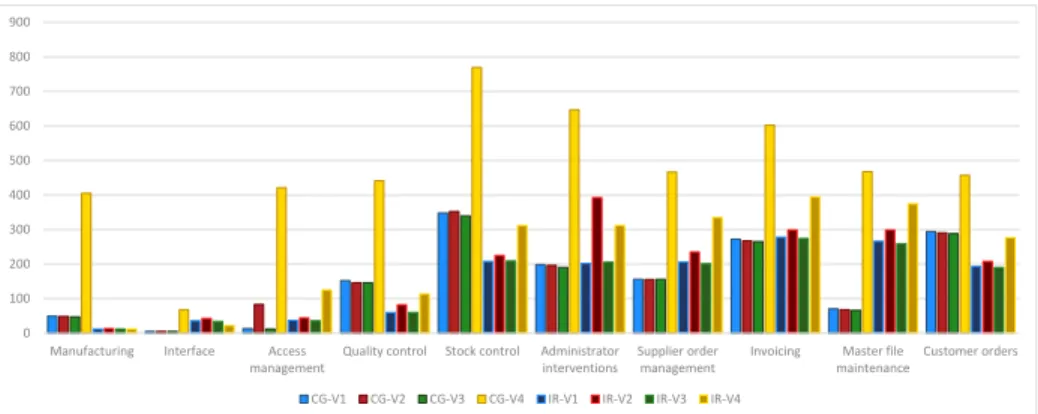
We consider features as sets of Magic programs that take part in their imple- mentation. These sets usually have overlaps since programs can be used by more than one feature. In this work we present our results computed on the topmost level of features we have been provided with by domain experts, which involves 10 high level features and represent the main functions of the system. Their size properties after extraction can be observed in Table 1 and Figure 2 the values representing the number of programs implementing each feature, working with more than 2000 programs in total. We worked with four variants of the subject system, their properties are further defined in Section 4.
Table 1. The recovered number of programs for each feature of the variants with call-graph (CG) and information retrieval (IR) based extraction
Variant CG-V1 CG-V2 CG-V3 CG-V4 IR-V1 IR-V2 IR-V3 IR-V4
Manufacturing 49 48 47 405 12 13 12 12
Interface 5 5 5 68 36 43 34 22
Access management 13 83 12 421 37 44 36 125
Quality control 152 146 146 441 60 82 60 113
Stock control 348 352 339 769 208 225 209 312
Administrator interventions 198 196 190 647 202 392 205 312 Supplier order management 156 155 156 466 206 235 201 335
Invoicing 272 267 265 602 278 299 274 394
Master file maintenance 70 68 66 467 266 299 259 374
Customer orders 294 290 288 457 193 208 190 276
In this section we define several metrics that we deemed suitable for mea- suring the properties of features. Some of our proposed feature level metrics are extensions of already defined metrics on program level. In many cases these can be summed up or averaged to get suitable measurements for feature level too. In other cases we define new ways that didn’t exist on program level. Feature level metrics can also be utilized in the analysis of not just features but the whole system itself or the feature extraction process.
0 100 200 300 400 500 600 700 800 900
Manufacturing Interface Access management
Quality control Stock control Administrator interventions
Supplier order management
Invoicing Master file maintenance
Customer orders CG-V1 CG-V2 CG-V3 CG-V4 IR-V1 IR-V2 IR-V3 IR-V4
Fig. 2.Number of programs for each feature with call-graph (CG) and the information retrieval (IR) based extraction
3.1 Coupling
Coupling metrics for features represent the differences in their inner and outer references. A high number of valid outer references can possibly imply bad mod- ular design.
Coupling Between Features (CBF): One of the most straightforward coupling metric can be the number of features a feature in question is calling. This number is computed by inspecting the programs of the features. If we imagine features as sets of programs, we can easily see that there is a call between features if there is at least one call between the set of programs of both features. Coupling between features measures only the outgoing calls from each feature. It can be viewed as a metric letting us know how many other features does a single features depend on. Being aware of dependence can be valuable for instance if we decide not to provide a feature, the other features that depend on this can potentially be crippled and if we want to provide those features we may have to bridge this gap created.
Coupling Between Programs Inside Features (CBTIF): While coupling be- tween features measures the outgoing calls from each feature, knowing of the inside structure of a feature can be just as important. For this we can count the calls with both participating programs inside the same feature. This is cou- pling between programs inside a feature, which does not represent a number of features but a number of calls, thus usually higher than CBF.
Sum of Coupling Between Programs and Data Objects (SCTBDO): Feature coupling can be also viewed at the data object level. The number of used data objects is a metric that already exists for each program, it is useful for measuring the extent of data used by each program. The total of this number for each feature can give us the sum of coupling between programs and data objects, which provides information about the same thing. On feature level this can be interesting information since we can see how much each feature relies on stored data, thus getting a more complete picture of the feature itself.
Program Clarity (PC): Another piece of interesting information can be de- rived from the number of features a single program is connected to. If a program is only connected to a sole feature it can be more easily maintainable with less consideration of the subsequent changes in functionality because the effects of a change only affect one feature. Additionally if the customer decides not to require a specific feature, the programs of this feature can be excluded. A number indi- cating this condition which we called program clarity represents the percentage of programs that are unique to that single feature.
3.2 Complexity
The quantification of software complexity is a basic idea that is widely used throughout software development. Complexity can be defined in many ways, and this is the same with feature complexity. Since a feature is handled as a set of programs that aims to reach a common goal, the complexity of the feature is derived from the complexity of its programs.
As established in the paper of Nagy et al. [9] in Magic context the generally used McCabe complexity measure is not really suitable for representing the real complexity of a program. On the other hand Halstead complexity metics [13]
correlated well with the opinions of the experienced developers involved. To complete Halstead complexity metrics we us the following values:
– n1 : the number of distinct operators – n2 : the number of distinct operands – N1: the total number of operators – N2 : the total number of operands
Halstead Volume (HV): It represents the magnitude of information inside a feature, more precisely the bits required for its coding. This can be also inter- preted as a measure describing the amount of information a reader of the code must attain to completely understand the feature itself. Since a feature can in- volve many programs this number is usually very high. As it can be seen from its formula this measure involves all operators and operands in the feature. It computes as follows:
HV = (N1+N2)∗log2(n1+n2)
Halstead Difficulty (HD): It can be used to measure fault sensitivity. The important factors in this property are the number of distinct operators inside a feature and the ratio of all and distinct operands. Both of these properties result in more sensitivity. It computes as follows:
HD=n1
2
∗N2
n2
Other metrics that can relevantly measure complexity on feature level include Halstead Vocabulary which describes the sum of all distinct operators and dis- tinct operands in a feature, Halstead Effort (HE) which describes the product of
volume and effort and represents the developer effort of the code. Henry-Kafura Complexity (HKC) can also be valuable which works with the inner and outer calls of the features, practically building complexity on coupling information. It computes as:
HKC= (N1+N2)∗(fan-in∗fan-out)2 During our work we also computed these measures.
4 Experiments and Analysis
In this section we present some of the results of the proposed metrics of four variants of our system under study and we examine their possible meanings to comparison of features and to variants also.
The four variants under study will be mentioned simply as V1, V2, V3 and V4. These are all real variants of the system that are currently under use by customers of our industrial partner. To our knowledge V4 differs from the other variants significantly, while the others share a great number of programs and support a very similar set of functions but still vary somewhat in the specifics.
Table 2 displays the size and properties of these four variants. From these data it is even more clear that V4 is the largest variant although V2 has the most tasks.
V1 and V3 are very similar both in our experiences and their characteristics.
Table 2.The characteristics of the variants under analysis Variant Logic Lines Tasks Programs Data Objects
V1 366 328 13 365 2 001 699
V2 467 823 25 457 2 719 703
V3 355 604 13 151 2 001 697
V4 518 304 18 291 4 251 1 065
In the remaining part of the section we present a number of results and discuss the meaning of the data retrieved. Experiments were done on all top level features of all four variants on both call graph (CG) and information retrieval (IR) based feature extraction outputs. We present the results in graphic format.
Due to space limitations and for the elimination of monotony we only display the results found most notable.
We can note that through all variants the IR technique seems to provide more stable numbers while the CG technique usually shows large differences between variants and even features of the same variant. This does not mean that the CG technique would be inferior in any way, and from our previous knowledge we are aware that the output of the IR based extraction contains a large amount of noise as a result of short feature names which have served as queries for Latent Semantic Indexing. The seemingly more stable results can even be a consequence of the noise itself. The CG based extraction on the other hand
can produce a variable number of programs for each feature and each variant.
These calls found by the call graph technique are present in the system itself and provide a less conceptual grouping. It is also important to note that with the call graph technique we find a high number of more general programs that are connected to nearly every feature. Even considering these differences we can find that the results of the metrics still move along very similar curves in case of both extraction techniques.
0,00 1,00 2,00 3,00 4,00 5,00 6,00 7,00 8,00 9,00 10,00
Manufacturing Interface Access management
Quality control Stock control Administrator interventions
Supplier order management
Invoicing Master file maintenance
Customer order reception Coupling Between Features (CBF) with CG and IR Based Feature Extraction
IR - V1 IR - V2 IR - V3 IR - V4 CG - V1 CG - V2 CG - V3 CG - V4
Fig. 3. Coupling Between Features at each variant with call graph and information retrieval based feature extraction
The results of the proposed Coupling Between Features metric can be seen in Figure 3. As on the following figures, the columns represent the results of measurements done on IR based extraction while the lines represent the results of the extraction based on CG. The maximum of feature coupling is 9 since there are 10 features on top level hence this is the true maximum number of features another feature can call. As it can be seen in the case of IR based extraction many features achieve this with a minimal coupling of 4 in overall.
With CG based extraction on the other hand only one feature, Administrator interventions of V4 achieves this high level while the minimal coupling is at the Access management feature of V3 which appears to be calling no other feature at all. In the IR case the high values are caused by the already mentioned noise as well as other factors like how general the concept of each feature is. It is apparent that in this case the features achieving the lower coupling values are also the same that had the lowest number of programs, but this can also be a consequence of the more specific text of the feature that the IR based extraction could benefit from. Access management seems to be the most diverse feature in both cases with different values at nearly every variant. This is probably the consequence of different customer requests and needs about user permissions. It can be also noted that though V4 is significantly larger than the other variants, its coupling values are only slightly higher. It can also be noted here that CG and IR seem to move along similar curves.
0,00 20,00 40,00 60,00 80,00 100,00
Manufacturing Interface Access management
Quality control Stock control Administrator interventions
Supplier order management
Invoicing Master file maintenance
Customer order reception
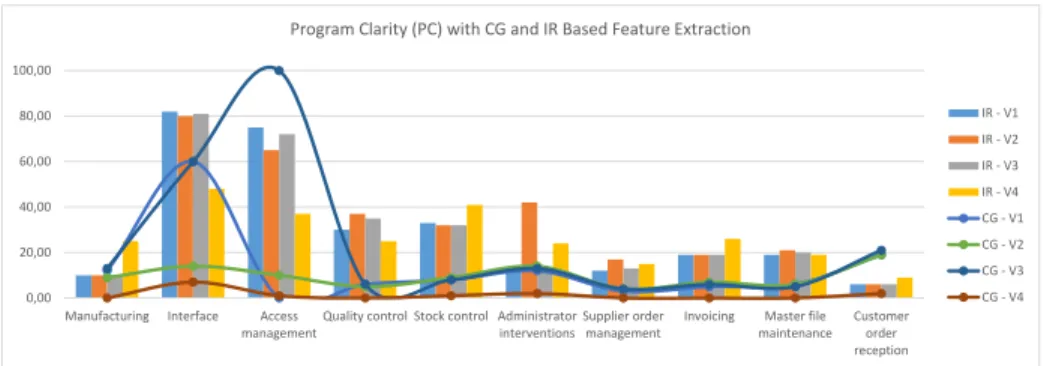
Program Clarity (PC) with CG and IR Based Feature Extraction
IR - V1 IR - V2 IR - V3 IR - V4 CG - V1 CG - V2 CG - V3 CG - V4
Fig. 4.Program Clarity at each variant with call graph and information retrieval based feature extraction
Figure 4 represents our results of Program Clarity. High clarity means that there are more programs of the feature that only contribute to that single feature.
This metric is somewhat the opposite of CBF since it measures the self reliance of features opposed to the reliance on others. This can also be seen from the results themselves, CG-V3 achieves the greatest clarity which also had the lowest coupling, and particularly with IR we can see that the values seem to be quite on the opposite side of the scale at each feature. Still some interesting exceptions are present like the values of Quality control in the CG case which was at a medium level considering coupling and one of the lowest at clarity. The highest values are of the Access management feature of V3 and the Interface of V1 and V3. These features all consist of a low number of programs with only 12 and 5 programs at CG which can contribute to high clarity but this raises questions about the Interface feature of V2 which also contains only 5 programs but achieves a much lower value.
0,00 5000,00 10000,00 15000,00 20000,00 25000,00 30000,00 35000,00 40000,00 45000,00 Manufacturing
Interface Access management Quality control Stock control Administrator interventions Supplier order management Invoicing Master file maintenance Customer order reception
Sum of Coupling Between Data Objects with CG and IR based feature extraction
IR - V1 IR - V2 IR - V3 IR - V4 CG - V1 CG - V2 CG - V3 CG - V4
Fig. 5.Sum of Coupling Between Data Objects with CG and IR based feature extrac- tion
The results of the Sum of Coupling Between Data Objects are presented in Figure 5. This metric is meant to measure each feature’s reliance on stored data. Since it sums the values of programs it is logical for larger systems to achieve greater values. This is the exact case that seems to happen seeing that V4 dominates every single feature. It is interesting though that this only seems to happen in the CG case. In case of IR the highest values are also usually achieved by V4 but to a significantly less extent. It is apparent that in most cases CG achieves higher values than IR. This can stem from the fact that Magic is a highly data intensive language and there are a lot of programs that manipulate data for a feature. Since the main goal of these programs can be data object interaction there may be less text for information retrieval to build upon, hence these programs are overlooked. CG on the other hand is aware of the calls themselves which are made in case of data reliance and discovers these programs easily.
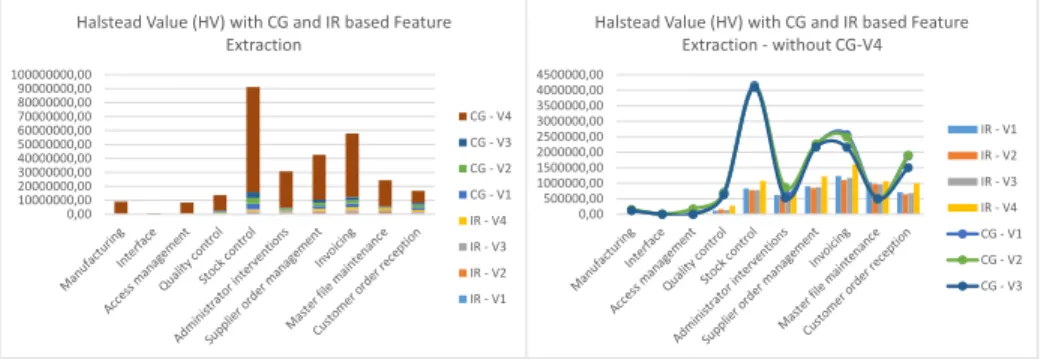
0,00 10000000,00 20000000,00 30000000,00 40000000,00 50000000,00 60000000,00 70000000,00 80000000,00 90000000,00 100000000,00
Halstead Value (HV) with CG and IR based Feature Extraction
CG - V4 CG - V3 CG - V2 CG - V1 IR - V4 IR - V3 IR - V2 IR - V1
0,00 500000,00 1000000,00 1500000,00 2000000,00 2500000,00 3000000,00 3500000,00 4000000,00 4500000,00
Halstead Value (HV) with CG and IR based Feature Extraction - without CG-V4
IR - V1 IR - V2 IR - V3 IR - V4 CG - V1 CG - V2 CG - V3
Fig. 6.Left: Halstead Value with CG and IR based feature extraction. Right: Halstead Value with CG and IR, disproportionally large values filtered out for easier analysis
Considering complexity we can see similar trends as with SCBDO, CG-V4 dominates the results in every case and seems disproportionally large on the figures. Figure 6 represents the results of Halstead Value, which measures the the information value of features. On the left side we can see that CG-V4 takes up most of the space, indicating that V4 is the most complex variant of these four, having a large amount of non-trivial code and can be much harder to understand in its entirety. On the right side we filtered out CG-V4 to have a chance to get a better look at the values of the other cases. As it can be seen CG usually produces programs with higher complexity. This can also be a consequence of IR overlooking a number of programs with complex logic or data manipulation that have less lexical information value and are much more meaningful on the data or logic side. We can also note here that while IR remains relatively low in case of every feature it can be seen that IR follows CG values, just to a much lesser extent.
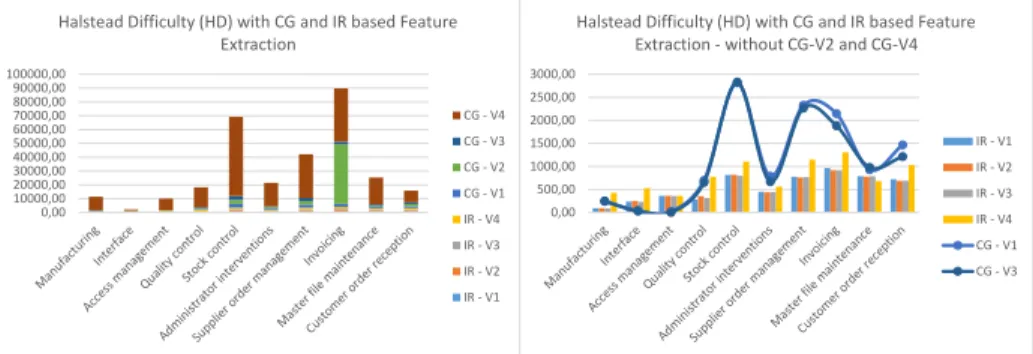
0,00 10000,00 20000,00 30000,00 40000,00 50000,00 60000,00 70000,00 80000,00 90000,00 100000,00
Halstead Difficulty (HD) with CG and IR based Feature Extraction
CG - V4 CG - V3 CG - V2 CG - V1 IR - V4 IR - V3 IR - V2 IR - V1
0,00 500,00 1000,00 1500,00 2000,00 2500,00 3000,00
Halstead Difficulty (HD) with CG and IR based Feature Extraction - without CG-V2 and CG-V4
IR - V1 IR - V2 IR - V3 IR - V4 CG - V1 CG - V3
Fig. 7.Left: Halstead Difficulty with CG and IR based feature extraction. Right: Hal- stead Difficulty with CG and IR, disproportionally large values filtered out for easier analysis
Figure 7 shows the results of Halstead Difficulty. This metric measures fault sensitivity. As we have already seen in the case of HV, the CG based extraction of V4 produces a set of programs with very high complexity. This can also be seen here, on the left side of the figure. Surprisingly, there is also one feature, Invoicing of CG-V2 that achieved the same magnitude of HD value. This is a very interesting matter since the number of programs extracted here, 267 is very close to the values of V1 and V3 and much less than V4’s 602 programs even if invoicing is usually one of the most complex methods in each case. One possible explanation for this can come from the number of tasks of the variants.
As we could see from Table 2, V2 has a very high number of tasks, significantly higher than every other variant, while its number of programs falls somewhere in between. This has to mean that V2’s programs contain more subtasks than the programs of other variants. Since we could see from our previous metrics that V2 nearly always achieves lower values than V4 we could wonder how this difference in program sizes failed to influence any of the metrics. The answer could be that a major part of the extra tasks inside V2 are contributing to the Invoicing feature providing more functions upon specific requests of the customer. Since HV is not exactly high in this case it can mean that while the feature did not gain much complexity, it became much more fault sensitive, thus this feature could be hard to maintain and deserves consideration of refactoring. On the right side of the figure we also filtered out CG-V4 and CG-V2 for easier glance at the rest of variants. We can see that these results usually move along the same curves as HV.
Finally, we would like to emphasize that these metrics are not only capable of revealing meaningful information about systems, features and outputs of feature extraction methods but can also be combined in several ways to attain even more understanding. Some metrics are dependent on the number of programs or tasks in a feature, which in some cases can be beneficial but in others it can hide some significant differences. To eliminate this we can divide the metric with the number of programs or tasks inside a feature. For example we could do this
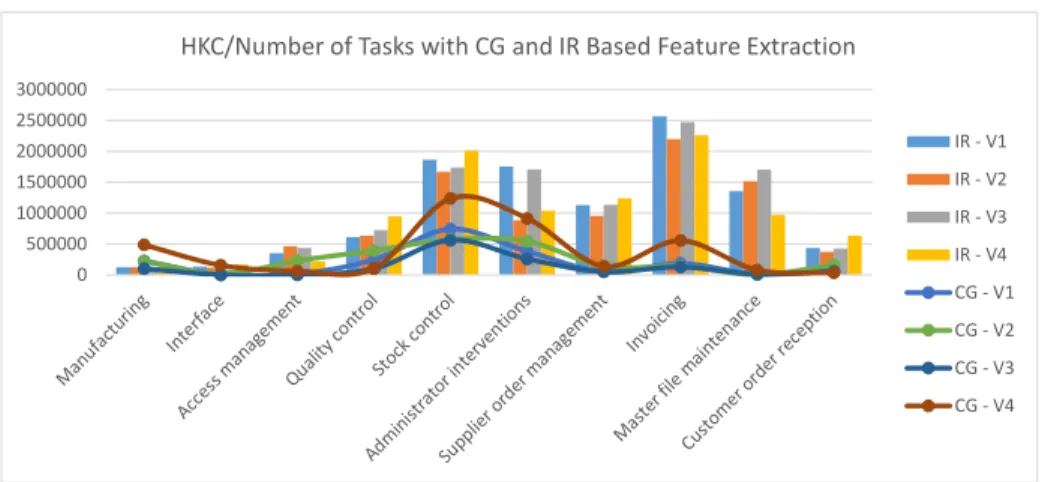
0 500000 1000000 1500000 2000000 2500000 3000000
HKC/Number of Tasks with CG and IR Based Feature Extraction
IR - V1 IR - V2 IR - V3 IR - V4 CG - V1 CG - V2 CG - V3 CG - V4
Fig. 8. Henry-Kafura Complexity in proportion to the number of programs at each variant with CG and IR based feature extraction
to any complexity metric to get the average complexity of programs or tasks of each feature or to SCBDO to get average reliance on data. These can paint a much different picture. For instance Henry-Kafura Complexity provides similar data to HV with a difference of some IR values becoming significantly higher.
On the other hand if we divide it by the number of tasks we get an average HKC value of tasks in each feature, this is illustrated in Figure 8. From this figure we can see that IR values are usually higher most probably because of the high number outer calls we have seen at the CBF metric. Even considering this it is apparent that IR and CG values move along the same lines meaning that on task level the features tend to behave the same way with both feature extraction methods.
Considering these findings our opinion is that feature level metrics are suit- able for the analysis of features in variants of Magic systems. Properly utilizing these we can come to realizations that can greatly aid not just product line adoption but also ease the future maintenance of a system.
5 Related work
By the time the 4GL paradigm arisen, most papers coped with the role of those languages in software development, including discussions demonstrating their viability. The paradigm is still successful, although only a few works are pub- lished about the automatic analysis and modeling 4GL or specifically Magic applications. The maintenance of Magic applications is supported by cost esti- mation and quality analysis methods [14, 15, 9]. Architectural analysis, reverse engineering and optimization are visible topics in the Magic community [16, 17, 3, 2], and after some years of Magic development migration to object-oriented languages [18] as well.
Measuring the complexity of a software at source code level is approached from many directions. First, and still popular complexity measures (McCabe [19], Halstead [13], Lines of Code [20]) were surveyed by Navlakha [21]. A re- cent survey which sums up complexity measures was published by Sheng Yu et al. [22]. In 3GL context there are papers available to analyze the correlation between certain complexity metrics. For instance, Meulen et al. [23] showed that there are very strong connections between LOC and HCM, LOC and CCM in C/C++ programs. In 4GL environment, to our best knowledge, there were no previous researches to measure structural complexity and copupling attributes of a Magic application at feature level. For other 4GLs there are some attempts to define metrics to measure the size of a project [14], [15], [24]. There are also some industrial solutions to measure metrics in 4GL environment. For instance RainCode Roadmap3for Informix 4GL provides a set of predefined metrics about code complexity (number of statements, cyclomatic complexity, nesting level), about SQLs (number of SQL statements, SQL tables, etc.), and about lines (number of blank lines, code lines, etc.). In the world of Magic, there is a tool for optimization purposes too called Magic Optimizer4which can be used to per- form static analysis of Magic applications. It does not measure metrics, but it is able to locate potential coding problems which also relates to software quality.
Software product line extraction is a time-consuming task. To speed up this activity, many semi-automatic approaches has been proposed [25–27]. Reverse engineering is a popular approach which has recently received an increased at- tention from the research community. With this technique missing parts can be recovered, feature models can be extracted a set of features, etc. [25, 28].
Applying these approaches companies can migrate their system into a software product line. However, changing to a new development process is risky and may have unnecessary costs. The work of J. Kr¨uger et al. [29] supports cost estimations for the extractive approaches and provides a basis for further re- search. Feature models are considered first class artifacts in variability model- ing. Haslinger et al. [27] present an algorithm that reverse engineers a FM for a given SPL from feature sets which describe the characteristics each product variant provides. She et al. [30] analyze Linux kernel (which is a standard subject in variability analysis) configurations to obtain feature models. Within product line research a related aim is to make systems dynamically configurable, which is a problem known as Dynamic SPL [31–35].
In this paper we introduce novel feature level metrics for the Magic 4GL language, which topic is not directly addressed in the related literature.
6 Conclusions
In this paper we reported experiments carried out on 4 variants of a large scale logistics wholesale system. The system is implemented in the Magic 4GL lan- guage. In this context the usual product metrics need to be adapted to the
3 http://www.raincode.com/fglroadmap.html
4 http://www.magic-optimizer.com/
unique properties of the language. We extended the state of the art methods by feature oriented metrics applicable to Magic programs. Experiments were con- ducted to compute metrics on these variants using high level features defined by domain experts of the developer company. We provided insights into the feature structure in two dimensions: feature coupling and complexity. We demonstrated the usability of feature oriented metric analysis in the large on variants contain- ing 2000 to 4000 Magic programs. We have shown that the proposed feature level metrics are suitable for highlighting previously not visible information with special value in the analysis and even the maintenance of the systems. Their appropriate utilization can highlight the properties of feature extraction and the system itself and even point out specific weak spots that deserve further attention.
Acknowledgements
The project has been supported by the European Union, co-financed by the European Social Fund (EFOP-3.6.3-VEKOP-16-2017-00002). We acknowledge the help of Magic experts of the SZEGED Software Llc.
References
1. Chidamber, S.R., Kemerer, C.F.: A metrics suite for object oriented design. IEEE Transactions on Software Engineering20(6) (Jun 1994) 476–493
2. Nagy, C., Vid´acs, L., Ferenc, R., Gyim´othy, T., Kocsis, F., Kov´acs, I.: MAGISTER:
Quality Assurance of Magic Applications for Software Developers and End Users.
In: 26th IEEE International Conference on Software Maintenance, IEEE Computer Society (September 2010) 1–6
3. Nagy, C., Vid´acs, L., Ferenc, R., Gyim´othy, T., Kocsis, F., Kov´acs, I.: Solutions for reverse engineering 4gl applications, recovering the design of a logistical wholesale system. In: Proceedings of CSMR 2011 (15th European Conference on Software Maintenance and Reengineering), IEEE Computer Society (March 2011) 343–346 4. Clements, P., Northrop, L.: Software Product Lines: Practices and Patterns.
Addison-Wesley Professional (2001)
5. Krueger, C. In: Easing the Transition to Software Mass Customization. Springer Berlin Heidelberg, Berlin, Heidelberg (2002) 282–293
6. K¨astner, C., Dreiling, A., Ostermann, K.: Variability Mining: Consistent Semi- automatic Detection of Product-Line Features. IEEE Transactions on Software Engineering40(1) (2014) 67–82
7. Assun¸c˜ao, W.K.G., Vergilio, S.R.: Feature location for software product line migra- tion. In: Proceedings of the 18th International Software Product Line Conference on Companion Volume for Workshops, Demonstrations and Tools - SPLC ’14, New York, New York, USA, ACM Press (2014) 52–59
8. Eyal-Salman, H., Seriai, A.D., Dony, C., Al-msie’deen, R.: Recovering traceability links between feature models and source code of product variants. In: Proceedings of the VARiability for You Workshop on Variability Modeling Made Useful for Everyone - VARY ’12, New York, New York, USA, ACM Press (2012) 21–25
9. Nagy, C., Vid´acs, L., Ferenc, R., Gyim´othy, T., Kocsis, F., Kov´acs, I.: Complexity measures in 4gl environment. In: Computational Science and Its Applications - ICCSA 2011, Lecture Notes in Computer Science. Volume 6786 of Lecture Notes in Computer Science., Springer Berlin / Heidelberg (2011) 293–309
10. Katzmarski, B., Koschke, R.: Program complexity metrics and programmer opin- ions. In: 2012 20th IEEE International Conference on Program Comprehension (ICPC), IEEE (jun 2012) 17–26
11. Kicsi, A., Vid´acs, L., Besz´edes, A., Kocsis, F., Kov´acs, I.: Information retrieval based feature analysis for product line adoption in 4gl systems. In: Proceedins of the 17th International Conference on Computational Science and Its Applications – ICCSA 2017, IEEE (2017) 1–6
12. Kicsi, A., Vid´acs, L., Csuvik, V., Horv´ath, F., Besz´edes, r., Kocsis, F.: Supporting product line adoption by combining syntactic and textual feature extraction. In:
New Opportunities for Software Reuse - 17th International Conference on Software Reuse (ICSR 2018). Volume 10826 of Lecture Notes in Computer Science., Springer International Publishing (2018) 1–16
13. Halstead, M.H.: Elements of Software Science (Operating and programming sys- tems series). Elsevier Science Inc., New York, NY, USA (1977)
14. Verner, J., Tate, G.: Estimating Size and Effort in Fourth-Generation Develop- ment. IEEE Software5(1988) 15–22
15. Witting, G., Finnie, G.: Using Artificial Neural Networks and Function Points to Estimate 4GL Software Development Effort. Australasian Journal of Information Systems1(2) (1994) 87–94
16. Harrison, J.V., Lim, W.M.: Automated Reverse Engineering of Legacy 4GL Infor- mation System Applications Using the ITOC Workbench. In: 10th International Conference on Advanced Information Systems Engineering, Springer-Verlag (1998) 41–57
17. Ocean Software Solutions: Homepage of Magic Optimizer. http://www.magic- optimizer.com (last visited February 2018)
18. M2J Software LLC: Homepage of M2J. http://www.magic2java.com (last visited February 2018)
19. McCabe, T.: A complexity measure. IEEE Transaction on Software Engineering SE-2(4) (dec 1976)
20. Albrecht, A.J., Gaffney, J.E.: Software function, source lines of code, and de- velopment effort prediction: A software science validation. IEEE Transaction on Software Engineering9(November 1983) 639–648
21. Navlakha, J.K.: A survey of system complexity metrics. The Computer Journal 30(June 1987) 233–238
22. Yu, S., Zhou, S.: A survey on metric of software complexity. In: Proceedings of ICIME 2010, The 2nd IEEE International Conference on Information Management and Engineering. (April 2010) 352–356
23. van der Meulen, M., Revilla, M.: Correlations between internal software metrics and software dependability in a large population of small C/C++ programs. In:
Proceedings of ISSRE 2007, The 18th IEEE International Symposium on Software Reliability. (November 2007) 203–208
24. MacDonell, S.: Metrics for Database Systems: An Empirical Study. IEEE Inter- national Symposium on Software Metrics (1997) 99–107
25. Valente, M.T., Borges, V., Passos, L.: A Semi-Automatic Approach for Extracting Software Product Lines. IEEE Transactions on Software Engineering 38(4) (jul 2012) 737–754
26. Assun¸c˜ao, W.K.G., Lopez-Herrejon, R.E., Linsbauer, L., Vergilio, S.R., Egyed, A.:
Multi-objective reverse engineering of variability-safe feature models based on code dependencies of system variants. Empirical Software Engineering22(4) (aug 2017) 1763–1794
27. Haslinger, E.N., Lopez-Herrejon, R.E., Egyed, A.: Reverse Engineering Feature Models from Programs’ Feature Sets. In: 18th Working Conference on Reverse Engineering, IEEE (oct 2011) 308–312
28. Lima, C., Chavez, C., de Almeida, E.S.: Investigating the Recovery of Product Line Architectures: An Approach Proposal. Springer, Cham (may 2017) 201–207 29. Kr¨uger, J., Fenske, W., Meinicke, J., Leich, T., Saake, G.: Extracting software
product lines: a cost estimation perspective. In: Proceedings of the 20th Interna- tional Systems and Software Product Line Conference on - SPLC ’16, New York, New York, USA, ACM Press (2016) 354–361
30. She, S., Lotufo, R., Berger, T., W¸asowski, A., Czarnecki, K.: Reverse engineering feature models. In: Proceeding of the 33rd international conference on Software engineering - ICSE ’11, New York, New York, USA, ACM Press (2011) 461 31. Lee, K., Kang, K.C., Lee, J.: Concepts and Guidelines of Feature Modeling for
Product Line Software Engineering. In: Software Reuse Methods Techniques and Tools. Volume 2319. Springer, Berlin, Heidelberg (2002) 62–77
32. Baresi, L., Quinton, C.: Dynamically Evolving the Structural Variability of Dy- namic Software Product Lines. 10th International Symposium on Software Engi- neering for Adaptive and Self-Managing Systems (2015)
33. Bashari, M., Bagheri, E., Du, W.: Dynamic Software Product Line Engineering: A Reference Framework. International Journal of Software Engineering and Knowl- edge Engineering27(02) (2017) 191–234
34. Capilla, R., Bosch, J., Trinidad, P., Ruiz-Cort´es, A., Hinchey, M.: An overview of Dynamic Software Product Line architectures and techniques: Observations from research and industry. Journal of Systems and Software91(1) (may 2014) 3–23 35. Uchˆoa, A.G., Bezerra, C.I.M., Machado, I.C., Monteiro, J.M., Andrade, R.M.C.:
ReMINDER: An Approach to Modeling Non-Functional Properties in Dynamic Software Product Lines. Springer, Cham (may 2017) 65–73