SPECIES RELATIONSHIP AND POPULATION STRUCTURE ANALYSIS IN GERANIUM SUBG. ROBERTIUM WITH THE USE OF ISSR MOLECULAR MARKERS
S. Esfandani Bozchaloyi1*, M. Sheidai1, M. Keshavarzi3 and Z. Noormohammadi2
1Faculty Life Sciences and Biotechnology, Shahid Beheshti University, Tehran, Iran;
E-mails: *somayehesfand@yahoo.com, msheidai@yahoo.com, msheidai@sbu.ac.ir
2Department of Biology, Science and Research Branch, Islamic Azad University, Tehran, Iran;
E-mail: marganm@yahoo.com
3Department of Plant Sciences, Faculty of Biological Science, Alzahra University, Tehran, Iran;
E-mail: neshat112000@yahoo.com, m.keshavarzi@alzahra.ac.ir
(Received 9 August, 2017; Accepted 17 November, 2017)
Species delimitation is essential since species is regarded as the basic unit of analysis in nearly all biological disciplines, such as ecology, biogeography, conservation biology, and macroevolution. The genus Geranium (Geraniaceae) comprises about 350 species distrib- uted throughout most parts of the world. The subg. Robertium comprises 30 species which are arranged in 8 sections. This subgenus is represented in Iran by 10 species. These species are grouped into 5 sections. In spite vast distribution of many Geranium species that grow in Iran, there are not any available report on their genetic diversity, mode of divergence and patterns of dispersal. Therefore molecular (ISSR markers) and morphological studies of 147 accessions from 10 species of Geranium (subg. Robertium), that were collected from different habitats in Iran were performed. The aims of the present study are: 1) to find the diagnostic value of ISSR markers in delimitation of Geranium species, 2) to find the genetic structure of these taxa in Iran, and 3) to investigate the species inter-relationship. The pre- sent study revealed that combination of morphological and ISSR data can delimit the spe- cies. AMOVA and STRUCTURE analysis revealed that the species of subg. Robertium are genetically differentiated but have some degree of shared common alleles.
Key words: Geranium, ISSR, morphology, species delimitation, STRUCTURE
INTRODUCTION
Species delimitation is important in different biological disciplines, like ecology, biogeography, and plant conservation (Mayr 1982, Wiens 2007). Spe- cies delimitation is done by tree-based and non-tree-based approaches (Sites and Marshall 2003). In the first method, species form distinguishing clades (phylogenetic species concept), whereas in non-tree-based method, the spe- cies are recognised on the basis of gene flow assessments (biological species concept; Pérez-Losada et al. 2005).
Wiens and Penkrot (2002), proposed to use DNA data, morphological data and character data for species delimitation while, Knowles and Carstens
(2007) addressed how molecular data (i.e., gene trees from DNA sequence data) can be used in species delimitation. The latter authors used coalescent simulations to test the species limits and incorporated data from multiple loci.
They showed the importance of population genetics in species delimitation.
Similarly, Medrano et al. (2014) applied population genetics methods to the species delimitation problem in Narcissus Linnaeus (1753: 289) (Amaryllida- ceae J. St.-Hil., nom. cons.) by the help of amplified fragment length polymor- phism (AFLP) molecular markers.
The genus Geranium Linnaeus (1753: 676) (Geraniaceae Juss.) with about 350 species is distributed through most of the world habitats (Aedo 2014, Aedo et al. 1998b). A brief history of the generic delimitation and infra-gener- ic classification, as well as a description of the genus, can be found in Aedo (1996). According to the currently accepted classification (Yeo 1984), Gera- nium is divided into three subgenera: subg. Geranium Linnaeus (1753: 676), subg. Erodioidea (Picard) Yeo (1984: 89), and subg. Robertium (Picard) Rouy (1897: 94). According to Yeo’s (1984) sectional classification, the subg. Rober- tium comprises 30 species in 8 sections, some of which have also been revised (Aedo et al. 1998a, Yeo 1973, 1992). Section Polyantha Reiche (1890: 8) (with 7 species) is endemic to the Eastern Himalayas and southern China, and sec- tion Trilopha Yeo (1984: 89) (with 5 species) is restricted to the mountains of tropical Africa, western Asia, and the eastern Himalayas. The distributions of the remaining 5 sections as Lucida R. Knuth (1912: 60), Ruberta Dumort. (1827:
112), Divaricata Rouy (1897: 88), Batrachioidea W. D. J. (1835: 139) and Unguicu- lata (Boiss.) (1890: 8) are in the Mediterranean area and western Asia (Aedo 2005, Aedo and Estrella 2006, Aedo et al. 1998a, b, Yeo 2004). Controversy ex- ists on the number of species in this genus, for example, there is occurring 22 annual and perennial species for this genus in Iran according to Flora Iranica (Schönbeck-Temesy 1970), but in Flora of Iran (Janighorban 2009). The genus is represented by 25 species but there are not clarified any sections for it (On- sori et al. 2010). Diagnostic features in infrageneric classification are related to fruit discharge methods, mericarp margin and leave shape. In Iran, there are Geranium species with carpel projection or seed ejection. Some species of the genus Geranium (cranesbill) are utilised as an anti-diabetic, hemostatic, anti- hemorrhoid, and anti-diarrhea, and as a remedy for tonsillitis, cough, whoop- ing cough, urticaria, dysentery, pain, fevers, and gastrointestinal ailments in some folk medicines. (Bate-Smith 1973, Baytop 1999). Geranium is both cross- pollinated and self-pollinated (Stebbins 1957, 1970), and interspecific hybrids and intermediate forms do occur in few Geranium species in the area of spe- cies overlap. Hybridisation experiments in Geranium subg. Robertium have involved species of section Anemonifolia R. Knuth (1912: 98), Batrachioidea, Lu- cida, Ruberta and Unguiculata (Van Loon 1984, Widler-Kiefer and Yeo 1987).
There are no available data for sections as Divaricata, Polyantha and Trilopha.
Previous study on species delimitation and species relationship per- formed in this genus (Salimi Moghadam et al. 2015) revealed that fruit char- acters are important for separating taxa at infrageneric rank and their results show that the species can be separated into subgenera and sections based on fruit morphology, while seed micromorphological features generally do not support the sectional taxonomy, but provide valuable characters for the delim- itation at species groups, species, and infraspecific levels (Salimi Moghadam et al. 2015). Studies on Geranium species are mainly dealing with taxonomy, seed and pollen morphology, stem and leaf anatomy (Esfandani Bozchaloyi et al. 2017a, b, c, d, Keshavarzi et al. 2015, Onsori et al. 2010, Salimi Moghadam et al. 2015, Salimpour et al. 2009), but there are no attempt to study genetic diver- sity, ecological adaptation and intra- and interspecific differentiation along with morphometric studies on Geranium of Iran. Therefore, we performed morphological and molecular study of 10 collected species of 5 sections in the subg. Robertium. The project try to answer the following questions: 1) Is there infra- and interspecific genetic diversity among studied species? 2) Is genetic distance among these species correlated with their geographical distance? 3) What is the genetic structure of populations and taxa? 4) Is there any gene ex- change between Geranium species in Iran? Therefore it is important to delimit the identified species for performing further detailed molecular studies.
MATERIALS AND METHODS Plant materials
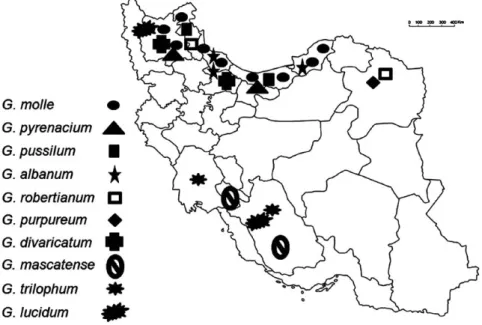
In present study, 147 plant samples were collected from 21 geographical populations belong to 10 species in the subg. Robertium. The species studied are G. pyrenaicum Burm. f. (1759: 27), G. pusillum L. (1759: 1144), G. molle L.
(1753: 682) (sec. Batrachioidea); G. robertianum L. (1753: 681), G. purpureum Vill.
(1786: 272) (sec. Ruberta); G. lucidum L. (1753: 682) (sec. Lucida); G. divaricatum Ehrh. (1792: 164), G. albanum M. Bieb. (1808: 137) (sec. Divaricata); G. trilophum Boiss. (1846: 30), G. mascatense Boiss. (1843: 59) (sec. Trilopha). Different refer- ences were used for the correct identification of species (Aedo et al. 1998a, Janighorban 2009, Schönbeck-Temesy 1970, Zohary 1972). Details of sampling sites are mentioned (Table 1, Fig. 1). Voucher specimens are deposited in Her- barium of Shahid Beheshti University (HSBU).
For morphological studies five samples from each species were used for morphometry. In total 80 morphological (42 qualitative, 38 quantitative) characters were studied (Table 2). Data obtained were standardised (mean= 0, variance = 1) and used to estimate Euclidean distance for clustering and ordi- nation analyses (Podani 2000).
Table 1 Geranium species and populations, their localities and voucher numbers Sp.LocalityLatitudeLongitudeAltitude (m)Voucher no. G. molleEast Azerbaijan, kaleybar, Shojabad38° 52’ 39.3”47° 25’ 92”1,133HSBU 201677 East Azerbaijan, kaleybar, cheshme ali akbar38° 52’ 35.3”47° 27’ 92”1,143HSBU 201678 G. pyrenaciumEast Azerbaijan, kaleybar, road side38° 52’ 37.3”47° 23’ 92”1,144HSBU 201679 East Azerbaijan, kaleybar cheshme ali akbar38° 52’ 35.3”47° 27’ 92”1,143HSBU 201680 East Azerbaijan, kaleybar, Shojabad38° 52’ 39.3”47° 25’ 92”1,137HSBU 201681 East Azerbaijan, Babak fort38° 51’ 51”47° 02’ 28”1,155HSBU 201682 G. pussilumEast Azerbaijan, kaleybar, road side38° 52’ 37.3”47° 23’ 92”1,144HSBU 201683 East Azerbaijan, kaleybar cheshme ali akbar38° 52’ 35.3”47° 27’ 92”1,143HSBU 201684 East Azerbaijan, kaleybar, Shojabad38° 52’ 39.3”47° 25’ 92”1,137HSBU 201685 G. purpureumEast Azerbaijan, kaleybar, cheshme ali akbar38° 52’ 35.3”47° 27’ 92”1,143HSBU 201686 Guilan, Gole rodbar37° 09’ 55”49° 55’ 49”27HSBU 201687 Guilan, Gole rodbar, road side37° 09’ 45”49° 55’ 39”15HSBU 201688 G. robertianumGuilan, Gole rodbar37° 09’ 55”49° 55’ 49”32HSBU 201689 G. albanumGuilan, Sangar, road side37° 07’ 02.32”49° 44’ 32.6”48HSBU 201690 Guilan, Lahijan37° 12’ 04.81”50° 03’ 11.98”9HSBU 201691 Guilan, Jirandeh36° 41’ 58.62”49° 47’ 30.34”1,335HSBU 201692 Mazandaran, Siah bisheh to Chalus36° 14’ 14.32”51° 18’ 07.09”1,807HSBU 201693 Golestan, Ramian37° 08’ 0.23”55° 85’ 07.03”1,320HSBU 201694 G. divaricatumEast Azerbaijan kaleybar38° 52’ 37.3”47° 23’ 92”1,144HSBU 201695 Tehran, Darband35° 50’ 03.36”51° 24’ 28.62”1,700HSBU 201696 G. lucidumEast Azerbaijan, kaleybar cheshme ali akbar38° 52’ 37.3”47° 23’ 92”1,144HSBU 201697 G. mascatenseKhuzestan, Shushtar-Masjed solyman32° 11’ 40.18”48° 16’ 11.47”88HSBU 201698 G. trilophumHormozgan, Amani village, Kushk-e Nar Rural27° 15’ 20.83”52° 57’ 50.79”36HSBU 201699
DNA extraction and ISSR assay
Fresh leaves were used randomly from 5–10 plants in each of the studied populations. These were dried by silica gel powder. CTAB activated charcoal protocol was used to extract genomic DNA (Sheidai et al. 2013). The quality
No Characters 1 Plant height (mm)
2 Length of stem leaves petiole (mm) 3 Length of stem leaves (mm) 4 Width of stem leaves (mm) 5 Length / Width of stem leaves (mm) 6 Width / Length of stem leaves (mm) 7 Number of segment stem leaves (mm) 8 Length of basal leaves petiole (mm) 9 Length of basal leaves (mm) 10 Width of basal leaves (mm) 11 Length / Width of basal leaves (mm) 12 Width / Length of basal leaves (mm) 13 Number of segment basal leaves 14 Calyx length (mm)
15 Calyx width (mm)
16 Calyx length / Calyx width (mm) 17 Petal length (mm)
18 Petal width (mm)
19 Petal length / Petal width (mm) 20 Mericarp length (mm)
21 Mericarp width (mm)
22 Mericarp length / Mericarp width (mm) 23 Seed length (mm)
24 Seed width (mm)
25 Seed length / Seed width (mm) 26 Stipules length (mm)
27 Stipules width (mm)
28 Stipules length / Stipules width (mm) 29 Bract length (mm)
30 Bract width (mm)
31 Bract length / Bract width (mm) 32 Pedicel length (mm)
33 Peduncle length (mm) 34 Rostrum length (mm) 35 Style length (mm)
36 Stamen filament length (mm) 37 Fruit length (mm)
38 Number of flowers per inflorescence 39 Type root
40 Vegetation forms
No Characters
41 State of stem strength 42 State of stem branches 43 Leave shape
44 Phyllotaxy 45 Leaf tips
46 Shape of segments basal leaves 47 Stamen filament colour 48 Stigma hair
49 Mericarp shape 50 Mericarp surface 51 Mericarp hair 52 Mericarp rostrum hair 53 Sepal hair
54 Sepal hair density 55 Peduncle and pedicel hair 56 Anthers colour
57 Stem hair 58 Stem hair density 59 Leaf hair 60 Bract shape 61 Stipules shape
62 Bract and stipules hair density 63 Bract and stipules hair
64 Shape of segments cauline leaves 65 Shape of calyx
66 Calyx apex 67 Petal shape 68 State of petal ligule 69 Shape of petal lobes 70 State of petal ligule hair 71 Stamen filament hair 72 Mericarp hair density 73 Mericarp colour 74 Seed colour 75 Seed shape
76 Seed surface ornamentation 77 Peduncle and pedicel hair density 78 Petioles hair
79 Petioles hair density 80 Leaf hair density Table 2
Morphological characters in studied species
of extracted DNA was examined by running on 0.8% agarose gel. Ten ISSR primers: (AGC) 5GT, (CA) 7GT, (AGC) 5GG, UBC 810, (CA) 7AT, (GA) 9C, UBC 807, UBC 811, (GA) 9T and (GT) 7CA commercialised by UBC (the Uni- versity of British Columbia) were used. PCR reactions were carried in a 25 µl volume containing 10 mM Tris-HCl buffer at pH 8; 50 mM KCl; 1.5 mM MgCl2; 0.2 mM of each dNTP (Bioron, Germany); 0.2 µM of a single primer;
20 ng genomic DNA and 3 U of Taq DNA polymerase (Bioron, Germany). The amplifications, reactions were performed in Techne thermocycler (Germany) with the following program: 5 min initial denaturation step 94 °C, followed by 40 cycles of 1 min at 94 °C; 1 min at 52–57 °C and 2 min at 72 °C. The reaction was completed by final extension step of 7–10 min at 72 °C. The amplification products were observed by running on 1% agarose gel, followed by the eth- idium bromide staining. The fragment size was estimated by using a 100 bp molecular size ladder (Fermentas, Germany).
Data analyses
Morphological studies – Morphological characters were first standard- ised (mean = 0, variance = 1) and used to establish Euclidean distance among pairs of taxa (Podani 2000). For grouping of the plant specimens, UPGMA (unweighted paired group using average) and Ward (minimum spherical characters), as well as ordination methods of MDS (multidimensional scaling)
Fig. 1. Distribution map of studied species
and PCoA (principal coordinate analysis), were used (Podani 2000). ANO- VA (analysis of variance) were performed to show morphological difference among the populations, while PCA (principal components analysis) biplot was used to identify the most variable morphological characters among the studied populations (Podani 2000). PAST version 2.17 (Hammer et al. 2012) was used for multivariate statistical analyses of morphological data.
Molecular analyses – ISSR bands obtained were coded as binary characters (presence = 1, absence = 0) and used for genetic diversity analysis. A param- eter like Nei’s gene diversity (H), Shannon information index (I), the number of effective alleles, and percentage of polymorphism were determined (Free- land et al. 2011, Weising et al. 2005). Nei’s genetic distance among populations was used for neighbour joining (NJ) clustering and neighbour-net networking (Freeland et al. 2011, Huson and Bryant 2006). Mantel test checked the corre- lation between geographical and genetic distance of the studied populations (Podani 2000). These analyses were done by PAST ver. 2.17 (Hammer et al.
2012), DARwin ver. 5 (2012) and SplitsTree4 V4.13.1 (2013) software. AMO- VA (analysis of molecular variance) test (with 1,000 permutations) as imple- mented in GenAlex 6.4 (Peakall and Smouse 2006), and Nei’s Gst analysis as implemented in GenoDive ver. 2 (2013) (Meirmans and Van Tienderen 2004) were used to show genetic difference of the populations. Moreover, popula- tions, genetic differentiation was studied by G’ST est = standardised measure of genetic differentiation (Hedrick 2005), and D_est = Jost measure of differen- tiation (Jost 2008). The genetic structure of populations was studied by Bayes-
Table 3
Genetic diversity parameters in the studied Geranium species. (N = number of samples, Ne = number of effective alleles, I = Shannon’s information index, He = gene diversity,
UHe = unbiased gene diversity, P% = percentage of polymorphism, populations)
Pop N Na Ne I He UHe P%
sp1 12.000 1.247 1.304 0.281 0.184 0.192 55.91
sp2 8.000 0.419 1.097 0.084 0.056 0.060 16.13
sp3 6.000 0.258 1.029 0.028 0.018 0.020 5.38
sp4 12.000 0.925 1.259 0.233 0.155 0.162 44.09
sp5 11.000 0.774 1.171 0.162 0.104 0.109 36.56
sp6 14.000 0.344 1.069 0.064 0.041 0.043 13.98
sp7 14.000 0.570 1.106 0.098 0.064 0.066 21.51
sp8 10.000 0.441 1.036 0.033 0.022 0.023 7.53
sp9 5.000 0.301 1.031 0.027 0.018 0.020 5.38
sp10 5.000 0.312 1.029 0.028 0.018 0.020 5.38
ian based model STRUCTURE analysis (Pritchard et al. 2000), and maximum likelihood-based method of K-Means clustering of GenoDive ver. 2 (2013).
For STRUCTURE analysis, data were scored as dominant markers (Falush et al. 2007). We used the admixture ancestry model under the correlated al- lele frequency model. A Markov chain Monte Carlo simulation was run 20 times for each value of K after a burn-in period of 105. The Evanno test was performed on STRUCTURE result to determine proper number of K by using delta K value (Evanno et al. 2005). In K-Means clustering, two summary statis- tics, pseudo-F, and Bayesian Information Criterion (BIC) provide the best fit for k (Meirmans 2012).
Gene flow was determined by (i) Calculating Nm an estimate of gene flow from Gst by PopGene ver. 1.32 (1997) as: Nm = 0.5(1–Gst)/Gst. This ap- proach considers the equal amount of gene flow among all populations. (ii) Population assignment test based on maximum likelihood as performed in Genodive ver. in GenoDive ver. 2. (2013). The presence of shared alleles was determined by drawing the reticulogram network based on the least square method by DARwin ver. 5 (2012).
RESULTS Species delimitation and inter-relationship
Morphometry – ANOVA showed significant differences (P < 0.01) in quan- titative morphological characters among the species studied. In order to de- termine the most variable characters among the taxa studied, PCA analysis has been performed. It revealed that the first three factors comprised over 64% of the total variation. In the first PCA axis with 32% of total variation, such characters as shape of petals, shape of sepals, peduncles and pedicels hair, stem hair, petioles hair, mericarp hair density have shown the highest correlation (> 0.7), length of bract and pedicel, length and width of the petal, length and width of stem leaves, width of mericarp were characters influenc- ing PCA axis 2 and 3, respectively.
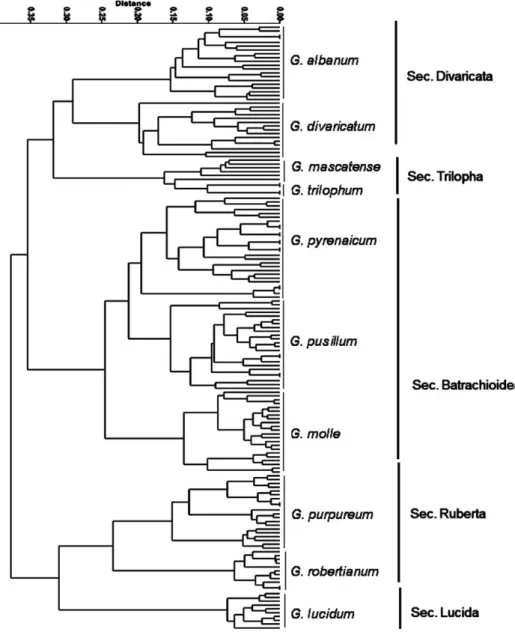
Different clustering and ordination methods produced similar results therefore, UPGMA clustering and MDS plot of morphological characters are presented here (Figs 2–3). In general, plant samples of each species belong to a distinct section, were grouped together and formed separate cluster. This re- sult show that morphological characters studied can delimit Geranium species in two different major clusters or groups. In the studied specimens we did not encounter intermediate forms. In general, two major clusters were formed in UPGMA tree (Fig. 2), Populations of G. robertianum, G. purpureum (sec. Ruber- ta) and G. lucidum (sec. Lucida) were placed in the first major cluster and were
placed with great distance from the other species. The second major cluster included two subclusters. Plants of G. divaricatum, G. albanum (sec. Divaricata) and G. trilophum, G. mascatense (sec. Trilopha) comprised the first subcluster, while plants of G. pyrenaicum, G. pusillum, G. molle (sec. Batrachioidea) formed the second subcluster.
Fig. 2. UPGMA clustering of morphological characters revealing species delimitation in subg. Robertium
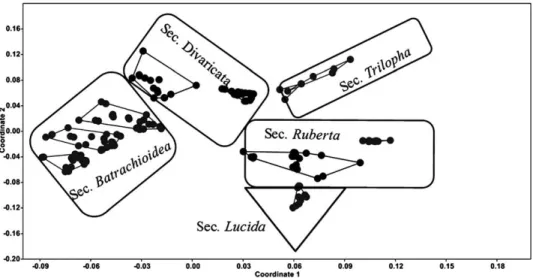
The MDS plot of morphological characters (Fig. 3) separated the species into distinct groups with no intermixing. This is in agreement with UPGMA tree presented before. The plants of G. lucidum (sec. Lucida) showed more sim- ilarity to G. robertianum, G. purpureum (sec. Ruberta) and were placed close to each other. Similarly, plants of G. pyrenaicum, G. pusillum, G. molle (sec. Batra- chioidea) were placed close to each other due to morphological similarity and were separated from the other species.
Species delimitation and genetic diversity
All ISSR primers produced polymorphic bands. Genetic diversity pa- rameters determined in the studied species (Table 3) revealed that G. molle (sp1) had the highest level of genetic polymorphism (55.91%), while the low- est level of genetic polymorphism (5.38%) occurred in G. pusillum, G. trilo- phum, G. mascatense (sp3, sp9, sp10). G. molle also had the highest values for ef- fective number of alleles (Ne = 1.30) and Shannon information index (I = 0.28).
AMOVA test showed significant genetic difference (P = 0.01) among studied species. It revealed that 65% of total variation was among species and 35% was within species. Pair-wise FST values showed significant difference among all studied species (Table 4). Moreover, genetic differentiation of these species was demonstrated by significant Nei’s GST (0.51, P = 0.01) and D_est values (0.189, P = 0.01).
Fig. 3. Multidimentional scaling plots of morphological characters revealing species de- limitation in subg. Robertium
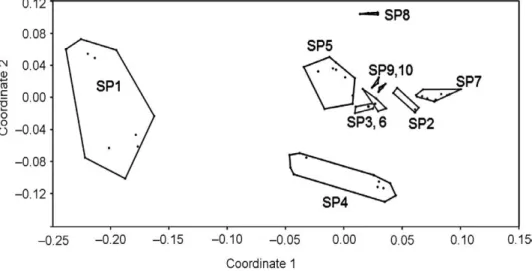
Non-metric MDS plots of ISSR data (Fig. 4) showed higher within species genetic diversity in the species number 1 (G. molle), supporting genetic diver- sity parameters obtained (Table 3).
The MDS plot separated the species into distinct groups. This indicates that ISSR molecular markers can be used in Geranium species delimitation.
This is in agreement with AMOVA and genetic diversity parameters present- ed before. The species are genetically well differentiated from each other. The
Table 4
Pair-wise FST values among the studied Geranium species (above diagonal = FST value, below diagonal = P value)
sp1 sp2 sp3 sp4 sp5 sp6 sp7 sp8 sp9 sp10
sp1 – 0.010 0.010 0.010 0.010 0.010 0.010 0.010 0.010 0.010 sp2 0.582 – 0.010 0.010 0.010 0.010 0.010 0.010 0.010 0.010 sp3 0.597 0.743 – 0.020 0.010 0.010 0.010 0.010 0.010 0.010 sp4 0.429 0.513 0.515 – 0.010 0.010 0.010 0.010 0.010 0.010 sp5 0.520 0.500 0.593 0.459 – 0.010 0.010 0.010 0.010 0.010 sp6 0.636 0.699 0.775 0.576 0.598 – 0.010 0.010 0.020 0.010 sp7 0.628 0.568 0.709 0.554 0.631 0.720 – 0.010 0.010 0.010 sp8 0.654 0.855 0.923 0.665 0.713 0.891 0.816 – 0.010 0.010 sp9 0.579 0.724 0.845 0.543 0.596 0.759 0.697 0.926 – 0.060 sp10 0.565 0.737 0.848 0.551 0.597 0.758 0.717 0.923 0.244 –
Fig. 4. MDS plot of Geranium species based on ISSR data. SP1 = G. molle, SP2 = G. pyrenai- cum, SP3 = G. pusillum, SP4 = G. purpureum, SP5 = G. robertianum, SP6 = G. albanum, SP7 = G.
divaricatum, SP8 = G. lucidum, Sp9 = G. mascatense, and SP10 = G. trilophum
Nm analysis by Popgene software also produced mean Nm = 0.21, that is con- sidered very low value of gene flow among the studied species.
Mantel test with 5,000 permutations showed a significant correlation (r = 0.3, p = 0.0002) between genetic distance and geographical distance, so isola- tion by distance (IBD) occurred among the Geranium species studied.
Nei’s genetic identity and the genetic distance determined among the studied species (Table is not included). The results showed that the highest degree of genetic similarity (0.98) occurred between G. trilophum and G. mas- catense (sec. Trilopha). The lowest degree of genetic similarity occurred be- tween G. molle and G. lucidum (0.71).
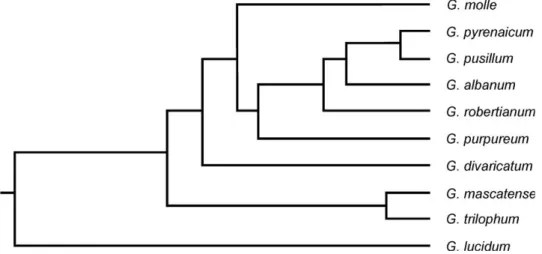
NJ tree based on Nei’s genetic distance (Fig. 5), showed that G. lucidum differed genetically from the other studied species, as it stands far from them.
This dendrogram showed close genetic affinity between G. trilophum and G.
mascatense (sec. Trilopha) supporting our morphological result presented be- fore (Fig. 2). The other Geranium species were placed closer to each other based on ISSR data, but their genetic affinity is not evident as is in morphology tree.
The species genetic STRUCTURE
We performed STRUCTURE analysis followed by the Evanno test to identify the optimal number of genetic groups. We used the admixture model to illustrate interspecific gene flow and/or ancestrally shared alleles in the species studied.
STRUCTURE analysis followed by Evanno test produced ΔK = 7. The STRUCTURE plot (Fig. 6) produced more detailed information about the ge-
Fig. 5. Neighbor joining tree of inter simple sequence repeats data in the studied Geranium species
netic structure of the species studied as well as shared ancestral alleles and/
or gene flow among Geranium species. This plot revealed that Genetic affinity between G. pyrenaicum, G. pusillum and G. divaricatum (similarly colored, No.
2, 3, 7), as well as G. trilophum and G. mascatense (sec. Trilopha, No. 9, 10) due to shared common alleles. This is in agreement with neighbour joining dendro- gram presented before. The other species are distinct in their allele composition.
The low Nm value (0.2) indicates limited gene flow or ancestrally shared alleles between the species studied and supports genetic stratification as indi- cated by K-Means and STRUCTURE analyses. Population assignment test also agreed with Nm result and could not identify significant gene flow among members of the studied species. However, reticulogram obtained based on the least square method (Fig. 7), revealed some amount of shared alleles be- tween species 6 and 5, 1 and between 7 and 4 also between 4 and 1, 2, 5, 6, 7, 8.
Fig. 6. STRUCTURE plot of Geranium species based on ISSR data. SP1 = G. molle, SP2 = G.
pyrenaicum, SP3 = G. pusillum, SP4 = G. purpureum, SP5 = G. robertianum, SP6 = G. albanum, SP7 = G. divaricatum, SP8 = G. lucidum, Sp9 = G. mascatense, and SP10 = G. trilophum
Fig. 7. Reticulogram of Geranium species. SP1 = G. molle, SP2 = G. pyrenaicum, SP3 = G. pusil- lum, SP4 = G. purpureum, SP5 = G. robertianum, SP6 = G. albanum, SP7 = G. divaricatum, SP8 =
G. lucidum, Sp9 = G. mascatense, and SP10 = G. trilophum
As evidenced by STRUCTURE plot based on admixture model, these shared alleles comprise very limited part of the genomes in species studied and all these results are in agreement in showing a high degree of genetic stratifica- tion in species studied.
DISCUSSION Species delimitation and taxonomic consideration
In the present study, subg. Robertium that is characterised by the “carpel- projection” type fruit discharge, comprises 10 species in 5 sections in Iran: 1) sec. Ruberta is characterised by the leaves divided to the base, 2) sec. Divari- cata characterised by the fruit discharge mechanism inoperative, 3) sec. Batra- chioidea characterised by the fruit discharge mechanism operative and pollen blue, 4) sec. Lucida characterised by the calyx longitudinally carinate, 5) sec.
Trilopha characterised by annual and petals shape (Yeo 1984).
Morphological analyses of the studied Geranium species showed that they are well differentiated from each other both in quantitative measures (ANOVA test result) and qualitative characters (MDS plot result). In addition, PCA suggests that characters like pedicel length, bract length, seed shape, calyx shape, petal shape, length and width of stem-leaf, length and width of petal, peduncle and pedicel hair, mericarp hair density, mericarp surface, fruit discharge type, fruit discharge mechanism, pollen colour, habit and petal claw could be used in species groups delimitation. This morphological dif- ference was due to quantitative and qualitative characters, for example, G.
robertianum has longest stem-leaf (4–5 cm), the broadest stem-leaf (6–7 cm) and the longest petal (10–13 mm) among the studied species. Similarly, G.
trilophum and G. mascatense had the broadest petal (6–7 mm) and the broadest mericarp (3.2 mm). G. albanum has the longest pedicel (20–30 mm) among the studied species. The genus Geranium contains a number of apparently suit- able small-flowered annual species, some of which hybridise together, but the greatest range of variation appears to be provided by G. robertianum and its close relative G. purpureum. The hybrid G. robertianum × G. purpureum might occur where both parents are present. It is possible that G. purpureum subsp.
forsteri (Wilmott) comb. nov. H. G. Baker arose from this cross (Stace 1997).
The present study revealed that G. robertianum and G. purpureum are clearly separated from each other based on few morphological characters as shape of petal lobes, anthers colour, mericarp colour, petal shape and mericarp surface.
No intermediate forms were observed throughout the area studied. These species, together with G. lucidum were placed by Knuth (1903) in the section Robertiana, which was originally created by Boissier (1867). Later, the same
author (Knuth 1912) made G. lucidum the type species of another section. Mor- phologically, however, the differences between the members of the otherwise isolated sections Lucida, Anemonefolia and Robertiana are not extreme and G.
lucidum, in particular, shares a number of characters with G. purpureum. Ge- ranium lucidum, however, is extremely uniform in morphology and ecology.
Morphological analysis also separated G. lucidum from the other species stud- ied. It differs in characters like outer sepals winged and with transverse keels, bright green (with shorter petioles than in G. robertianum and G. purpureum), lamina of the rosette up to 6 cm wide, bright green, sometimes red-edged.
Genetic structure and gene flow
AMOVA and STRUCTURE analysis revealed that the species of this subg. Robertium are genetically differentiated but have some degree of shared common alleles. Several trends in pollination mechanism can be observed in Geranium with gradual transition between them. According to Philipp (1985), most perennial species of Geranium produce large and protandrous flowers, while a slight or null protandry is accompanied by an increased selfing and a reduction in flower size. Selfing is here related to annual or coloniser strat- egies, which occur in many other taxa (Ambruster 1993, Baker 1955, 1967, Stebbins 1957, 1970). Annual or biennial species with small flowers, such as G.
lucidum, G. pusillum, G. molle, G. dissectum, G. rotundifolium are expected to be automatically self-pollinated. This has been proved for G. molle, G. dissectum.
Usually large flowered perennial species rely on insects for pollination. The flowers of G. pratense are pollinated by bees, honeybees and bumblebees. The methods we used are indirect estimation of gene flow and if it is identified to occur among species may be either due to ancestral shared alleles or ongoing gene flow. The Nm value obtained based on ISSR data, revealed very limited amount of gene flow among the studied species that was also supported by STRUCTURE analysis as Geranium species mostly had distinct genetic struc- ture. Reticulation analysis also showed some degree of gene flow for ISSR.
We did not observe any intermediate forms in our extensive plant collection, but morphological variability within each species did occur to some extent.
Therefore, the low degree of gene flow identified by indirect methods applied may be due to a low degree of gene flow both ancestral shared alleles and ongoing gene.
To conclude, the present study revealed the use of ISSR molecular mark- ers along with morphological characters in Geranium species delimitation.
Some degrees of interspecific genetic admixture occur in Geranium, but the studied species are strongly differentiated during the speciation process and invasion in new habitats. Genetic drift, strong inbreeding, and local adapta-
tion are effective evolutionary forces operating in Geranium species and popu- lation divergence and adaptation.
Plant species delimitation is of central importance in phylogenetic sys- tematics, evolution, biogeography and biodiversity. It is significant to infer patterns and mechanisms of speciation and hybridisation, the evolutionary process by which new biological species arise and gene flow between closely related phylogenetic species can occur (Duminil and Di Michele 2009, Schlut- er 2001). Isolation by distance, local adaptation and gene flow are different mechanisms responsible for species differentiation and genetic diversity (Freeland et al. 2011, Frichot et al. 2013).
*
Acknowledgement – The authors thank anonymous reviewers for valuable comments on an earlier draft.
REFERENCES
Aedo, C. (1996): Revision of Geranium subgenus Erodioidea (Geraniaceae). – Syst. Bot.
Monogr. 49: 1–104. https://doi.org/10.2307/25027866
Aedo, C. (2005): Proposal to conserve the name Geranium ibericum against G. mon- tanum (Geraniaceae) with a conserved type. – Taxon 54(4): 207–208. https://doi.
org/10.2307/25065331
Aedo, C. (2014): Novas ocorrências de Geranium L. para la flora do Brasil. – Iheringia, Sér.
Bot. 69: 221–223. [in Portugese with an English abstract]
Aedo, C. and Estrella, M. D. L. (2006): Taxonomic revision of Geranium subsect. Tu- berosa (Boiss.) Yeo (Geraniaceae). – Israel J. Plant Sci. 54(1): 19–44. https://doi.
org/10.1560/054k-6548-3818-7932
Aedo, C., Garmendia, F. M. and Pando, F. (1998a): World checklist of Geranium L. (Gera- niaceae). – Anal. Jardín Bot. Madrid 56(2): 211–252. https://doi.org/10.3989/ajbm.1998.
v56.i2.230
Aedo, C., Aldasoro, J. J. and Navarro, C. (1998b): Taxonomic revision of Geranium L., sec- tions Divaricata Rouy and Batrachioidea W. D. J. Koch (Geraniaceae). – Ann. Mo. Bot.
Gard. 85(4): 594–630. https://doi.org/10.2307/2992018
Armbruster, W. S. (1993): Evolution of plant pollination systems: hypotheses and tests with the neotropical vine Dalechampia. – Evolution 47(5): 1480–1505. https://doi.
org/10.2307/2410162
Baker, H. G. (1955): Self-compatibility and establishment after “long-distance” dispersal. – Evolution 9(3): 347–349. https://doi.org/10.2307/2405656
Baker, H. G. (1967): Support for Baker’s law as a rule. – Evolution 21(4): 853–856. https://doi.
org/10.2307/2406780
Bate-Smith, E. C. (1973): Chemotaxonomy of Geranium. – Bot. J. Linn. Soc. 67(4): 347–359.
https://doi.org/10.1111/j.1095-8339.1973.tb02552.x
Baytop, T. (1999): Therapy with medicinal plants in Turkey (past and present). 2nd ed. – Nobel Tıp Kitabevi, Istanbul, 163 pp.
Boissier, E. P. (1867): Flora Orientalis, I. – Geneva & Basle.
Duminil, J. and Di Michele, M. (2009): Plant species delimitation: a comparison of mor- phological and molecular markers. – Plant Biosyst. 143(3): 528–542. https://doi.
org/10.1080/11263500902722964
Esfandani Bozchaloyi, S., Sheidai, M., Keshavarzi, M. and Noormohammadi, Z. (2017a):
Genetic diversity and morphological variability in Geranium purpureum Vill. (Ge- raniaceae) of Iran. – Genetika 49(2): 543–557. https://doi.org/10.2298/gensr1702543b Esfandani Bozchaloyi, S., Sheidai, M., Keshavarzi, M. and Noormohammadi, Z. (2017b):
Species delimitation in Geranium Sect. Batrachioidea: morphological and molecular.
– Acta Bot. Hung. 59(3–4): 319–334. https://doi.org/10.1556/034.59.2017.3-4.3
Esfandani Bozchaloyi, S., Sheidai, M., Keshavarzi, M. and Noormohammadi, Z. (2017c):
Genetic and morphological diversity in Geranium dissectum (Sec. Dissecta, Gerania ceae) populations. – Biologia 72(10): 1121–1130. https://doi.org/10.1515/bi- olog-2017-0124
Esfandani Bozchaloyi, S., Sheidai, M., Keshavarzi, M. and Noormohammadi, Z. (2017d):
Analysis of genetic diversity in Geranium robertianum by ISSR markers. – Phytologia Balcanica 23(2): 157–166.
Evanno, G., Regnaut, S. and Goudet, J. (2005): Detecting the number of clusters of individu- als using the software STRUCTURE: a simulation study. – Mol. Ecol. 14(8): 2611–2620.
https://doi.org/10.1111/j.1365-294x.2005.02553.x
Falush, D., Stephens, M. and Pritchard, J. K. (2007): Inference of population structure using multilocus genotype data: dominant markers and null alleles. – Mol. Ecol. Notes 7(4):
574–578. https://doi.org/10.1111/j.1471-8286.2007.01758.x
Freeland, J. R., Kirk, H. and Peterson, S. D. (2011): Molecular ecology. 2nd ed. – Wiley-Black- well, UK, 449 pp.
Frichot, E., Schoville, S. D., Bouchard, G. and Francois, O. (2013): Testing for associations between loci and environmental gradients using latent factor mixed models. – Mol.
Biol. Evol. 30(7): 1687–1699. https://doi.org/10.1093/molbev/mst063
Hammer, Ø., Harper, D. A. T. and Ryan, P. D. (2012): PAST: paleontological statistics soft- ware package for education and data analysis. – Palaeontol. Electron. 4: 9.
Hedrick, P. W. (2005): A standardized genetic differentiation measure. – Evolution 59(8):
1633–1638. https://doi.org/10.1554/05-076.1
Huson, D. H. and Bryant, D. (2006): Application of phylogenetic networks in evolutionary studies. – Mol. Biol. Evol. 23(2): 254−267. https://doi.org/10.1093/molbev/msj030 Janighorban, M. (2009): Flora of Iran. Vol. 62. Geraniaceae. – The Research Institute of For-
ests and Rangelands. [in Persian]
Jost, L. (2008): GST and its relatives do not measure differentiation. – Mol. Ecol. 17(18):
4015–4026. https://doi.org/10.1111/j.1365-294x.2008.03887.x
Keshavarzi, M. (2015): Infrageneric classification of Geranium (Geraniaceae) based on fruit and seed morphology. – Acta Biol. Szeged. 59(1): 45–54.
Keshavarzi, M., Behzadifar, M. and Nazem Bokaee, Z. (2016): Pollen morphology of some Geranium subgenus Robertium species of Iran. – Modern Phytomorphol. 10(7): 39–45.
https://doi.org/10.5281/zenodo.155359
Knowles, L. L. and Carstens, B. (2007): Delimiting species without monophyletic gene trees. – Syst. Biol. 56(6): 887–895. https://doi.org/10.1080/10635150701701091
Knuth, R. (1903): Über die geographische Verbreitung und die Anpassungserscheinungen der Gattung Geranium im Verhaltnis zu ihrer systematischen Gliederung. – Engl.
Bot. Jb., 32.
Knuth, R. (1912): Geraniaceae. – In: Engler, A. (ed.): Das Pflanzenreich. Heft 53. Leipzig.
Mayr, E. (1982): The growth of biological thought: diversity, evolution and inheritance. – Harvard University Press, Cambridge, MA.
Medrano, M., López-Perea, E. and Herrera, C. M. (2014): Population genetics methods ap- plied to a species delimitation problem: endemic trumpet daffodils (Narcissus sec- tion Pseudonarcissi) from the Southern Iberian Peninsula. – Int. J. Plant Sci. 175(5):
501–517. https://doi.org/10.1086/675977
Meirmans, P. G. (2012): AMOVA-based clustering of population genetic data. – J. Heredity 103(5): 744–750. https://doi.org/10.1093/jhered/ess047
Meirmans, P. G. and Van Tienderen, P. H. (2004): GENOTYPE and GENODIVE: two pro- grams for the analysis of genetic diversity of asexual organisms. – Mol. Ecol. Notes 4(4): 792–794. https://doi.org/10.1111/j.1471-8286.2004.00770.x
Onsori, S., Salimpour, F. and Mazooji, A. (2010): The new record of Geranium linearilobum DC. based on anatomy and micromorphological study of pollen and seed, in Iran. – J.
plant environm. physiol. 5(3): 21–30. [in Persian with English abstract]
Pérez-Losada, M., Eiroa, J., Mato, S. and Domínguez, J. (2005): Phylogenetic species delimi- tation of the earth worms Eisenia fetida (Savigny, 1826) and Eisenia andrei Bouché, 1972 (Oligochaeta, Lumbricidae) based on mitochondrial and nuclear DNA sequenc- es. – Pedobiologia 49(5): 317–324. https://doi.org/10.1016/j.pedobi.2005.02.004
Peakall, R. and Smouse, P. E. (2006): GENALEX 6: genetic analysis in Excel. Population genetic software for teaching and research. – Mol. Ecol. Notes 6(1): 288–295. https://
doi.org/10.1111/j.1471-8286.2005.01155.x
Philipp, M. (1985): Reproductive biology of Geranium sessiliflorum, 1. Flower and flow- ering biology. – New Zealand J. Bot. 23(4): 567–589. https://doi.org/10.1080/002882 5x.1985.10434228
Podani, J. (2000): Introduction to the exploration of multivariate data. – Backhuys Publishers, Leiden, Netherlands, 470 pp.
Pritchard, J. K., Stephens, M. and Donnelly, P. (2000): Inference of population structure us- ing multilocus genotype data. – Genetics 155(2): 945–959.
Salimi Moghadam, N., Mehrvarz, S. S., Namin, A. A. and Shavvon, R. S. (2015): Micromor- phology of fruits and seeds of Iranian Geranium (Geraniaceae) and its systematic significance. – Nordic J. Bot. 33(6): 673–683. https://doi.org/10.1111/njb.00859
Salimpour, F., Mazooji, A. and Onsori, S. (2009): Stem and leaf anatomy of ten Geranium L.
species in Iran. – Afr. J. Plant Sci. 3(11): 238–244.
Schluter, D. (2001): Ecology and the origin of species. – Trends Ecol. Evol. 16(7): 372–380.
https://doi.org/10.1016/s0169-5347(01)02198-x
Schönbeck-Temesy, E. (1970): Geraniaceae. – In: Rechinger, K. H. (ed.): Flora Iranica. Vol. 69.
Akademische Druck, Graz, Austria, pp. 30–58.
Sheidai, M., Zanganeh, S., Haji-Ramezanali, R., Nouroozi, M., Noormohammadi, Z. and Ghsemzadeh-Baraki, S. (2013): Genetic diversity and population structure in four Cirsium (Asteraceae) species. – Biologia 68(3): 384–397. https://doi.org/10.2478/
s11756-013-0162-x
Sites, J. W. and Marshall, J. C. (2003): Delimiting species: a Renaissance issue in sys- tematic biology. – Trends Ecol. Evol. 18(9): 462–470. https://doi.org/10.1016/s0169- 5347(03)00184-8
Stace, C. A. (1997): New flora of the British Isles. 2nd ed. – Cambridge University Press, Cam- bridge, UK.
Stebbins, G. L. (1957): Self fertilization and population variability in the higher plants. – Amer. Nat. 91(861): 337–354. https://doi.org/10.1086/281999
Stebbins, G. L. (1970): Adaptive radiation of reproductive characteristics in angiosperms, I: pollination mechanisms. – Annu. Rev. Ecol. Syst. 1: 307–326. https://doi.org/10.1146/
annurev.es.01.110170.001515
Van Loon, J. C. (1984): Hybridization experiments in Geranium. – Genetica 65(6): 167–171.
https://doi.org/10.1007/bf00135281
Weising, K., Nybom, H., Wolff, K. and Kahl, G. (2005): DNA fingerprinting in plants. Prin- ciples, methods, and applications. 2nd ed. – CRC Press, Boca Raton, 472 pp. https://doi.
org/10.1201/9781420040043
Widler-Kiefer, H. and Yeo, P. F. (1987): Fertility relationships of Geranium (Geraniaceae):
sects. Ruberta, anemonifolia, Lucida and Unguiculata. – Plant Syst. Evol. 155(1–4):
283–306. https://doi.org/10.1007/bf00936305
Wiens, J. J. (2007): Species delimitation: new approaches for discovering diversity. – Syst.
Biol. 56(2): 875–878. https://doi.org/10.1080/10635150701748506
Wiens, J. J. and Penkrot, T. A. (2002): Delimiting species using DNA and morphological variation and discordant species limits in spiny lizards (Sceloporus). – Syst. Biol.
51(5): 69–91. https://doi.org/10.1080/106351502753475880
Yeo, P. F. (1973): The biology and systematics of Geranium, sections Anemonifo- lia Knuth and Ruberta Dum. – Bot. J. Linn. Soc. 67(4): 285–346. https://doi.org/
10.1111/j.1095-8339.1973.tb02551.x
Yeo, P. F. (1984): Fruit-discharge-type in Geranium (Geraniaceae): its use in classi- fication and its evolutionary implications. – Bot. J. Linn. Soc. 89: 1–36. https://doi.
org/10.1111/j.1095-8339.1984.tb00998.x
Yeo, P. F. (1992): A revision of Geranium L. in south-west China. – Edinb. J. Bot. 49(2):
123–211. https://doi.org/10.1017/s0960428600001566
Yeo, P. F. (2004): The morphology and affinities of Geranium sections Lucida and Unguicu- lata. – Bot. J. Linn. Soc. 144(4): 409–429. https://doi.org/10.1111/j.1095-8339.2003.00258.x Zohary, M. (1972): Flora Palaestina. Platanaceae to Umbelliferae. – The Israel Academy of Sci-
ences and Humanities, Jerusalem, Israel.