COMPARISON OF DNA EXTRACTION METHODS FROM GERANIUM (GERANIACEAE)
S. Esfandani-Bozchaloyi1*, M. Sheidai1 and M. Hassanzadeh Kalalegh2
1Faculty Life Sciences and Biotechnology, Shahid Beheshti University, Tehran, Iran E-mail: *somayehesfand@yahoo.com, msheidai@yahoo.com, msheidai@sbu.ac.ir
2Department of Biology, Science and Research Branch, Islamic Azad University, Tehran, Iran E-mail: mhasanzade311@gmail.com
(Received: 15 November, 2017; Accepted: 22 May, 2019)
The genus Geranium (Geraniaceae); with about 320 species throughout the temperate re- gions, is chemically characterised by the presence of tannins, flavonoids, anthocyanins and essential oils which interfere with the extraction of pure genomic DNA. It is necessary to optimise the extraction protocols to reduce the effects of the presence of these compounds to the lowest level.
The present study compares the plant genomic DNA extraction Kit (DNPTM Kit), CTAB DNA extraction method by Murray and Thompson and Sahu et al., from the ex- tracting DNA point of view Geranium species. The results showed significant differences in DNA contents between the three methods. Quantity and quality of extracted genomic DNAs were compared by employing the spectrophotometer, Nano-Drop, agarose gel elec- trophoresis, and polymerase chain reaction (PCR) methods and molecular marker such as (ITS and trnL-F) and ISSR. The method of Sahu et al., provided the best results (200 ng/µL) in terms of quantity and quality of DNA, therefore, this method was taken and optimised for DNA extraction. Our results proposed that this method could be effective for plants with same polysaccharides, proteins and polyphenols components. The advantage of this method is that it omits the use of liquid nitrogen and toxic phenols which are expensive.
The success of this method in obtaining high-quality genomic DNA has been demonstrat- ed in the Geranium species group and the reliability of this method has been discussed.
Key words: DNA extraction, Geranium, ISSR, PCR, secondary metabolites
INTRODUCTION
Molecular markers are extensively used in the development of genetic and physical maps of genomes for different purposes as germplasm charac- terisation, genetic diagnostics, characterisation of transformants, the study of genome organisation, phylogenetic analysis, marker-assisted selection, map- ping quantitative trait loci (QTL), etc. (Gupta et al. 1999). The thermostable Taq DNA polymerase caused the development of several PCR-based markers, such as random amplified polymorphic DNA (RAPD), inter-simple sequence repeats (ISSR), sequence tagged microsatellite site (STMS) and amplified frag- ment length polymorphism (AFLP), etc.
The genus Geranium L. (Geraniaceae) with about 320 species distributed throughout the temperate regions, is chemically characterised by the presence of tannins, flavonoids, anthocyanins and essential oils which affect the extrac- tion of pure genomic DNA (Aedo et al. 1998, Esfandani-Bozchaloyi et al. 2018a, b, c). There are 25 annual and perennial species of this genus in Iran according to Flora Iranica (Schönbeck-Temesy 1970). Some species of the genus Gerani- um (cranesbill) are utilised as an anti-diabetic, haemostatic, anti-haemorrhoid, and anti-diarrhoea, and as a remedy for tonsillitis, cough, whooping cough, urticaria, dysentery, pain, fevers, and gastrointestinal ailments in some folk medicines (Bate-Smith 1973, Baytop 1999).
DNA extraction is a critical step for genomic analysis especially from the plant materials with high accumulation of interfering substances including polysaccharides, proteins, polyphenols and secondary metabolites, which af- fect DNA restriction, amplification and another related process (Zamboni et al. 2008).
General problems in the isolation and purification of high molecular weight DNA from medicinal and aromatic plant species include: (1) degra- dation of DNA due to endonucleases, consolation of highly viscous polysac- charides, and (2) inhibitor compounds like polyphenols and other secondary metabolites which directly or indirectly interfere with the enzymatic reactions (Weising et al. 1995). The presence of polyphenols, as oxidising agents present in many plant species, can reduce the production of the purified extracted DNA (Loomis 1974, Porebski et al. 1997).
Several DNA extraction protocols have been successfully utilised to plant species (Doyle and Doyle 1990, Reichandt and Rogers 1994). Doyle and Doyle’s method (1990) is applied to extract DNA in fruit trees (Jenderek et al.
1997). The extraction technique of Lodhi et al. (1994) has been utilised for the grape, apple, apricot, peach, cherry and snapdragon. Sarkhosh et al. (2006) used the Bi et al. (1996) method for some Iranian pomegranate (Punica gra- natum L.) genotypes. Murray and Thompson (1980) method were used for DNA extraction in cabbage, olive, rose (Csaikl et al. 1998) and sweet cherry (Khadivi-Khub et al. 2008).
Saghai-Maroof et al. (1984)’s method was used for DNA extraction in mangroves and salt marsh species (Sahu et al. 2012). Talebi-Baddaf et al. (2003) introduced Murray and Thompson (1980)’s method as the most appropriate method to achieve high-quality DNA extraction from pomegranate leaves.
Because plants contain high amounts of many different substances, it is un- likely that just one nucleic acid isolation method suitable for all plants can ever exist (Loomis 1974). Therefore, it is necessary to modify the extraction protocols.
A perfect method is the one that is highly reproducible and represents the highest yield and pure DNA with the lowest content of contaminants that could be amplified in PCR.
Therefore, the present study aims to compare three different DNA ex- traction methods to isolate high-quality DNA from Geranium leaves. In this study, we showed the results of tests from several DNA extraction protocols that were made to overcome the problems that mainly arise from polysaccha- ride contamination. We evaluate a highly effective method for high-quality DNA isolation from young and mature leave of Geranium species.
ISSR amplification was also performed in order to evaluate the suitabil- ity of the DNA extraction methods for PCR-based techniques. As far as we know, this is the first report on DNA extraction from Geranium species leaves in Iran, and we expect that the suggested protocol can be an incentive to per- form further studies in order to investigate the genetic diversity among the plants with same chemical components as Geranium species.
MATERIALS AND METHOD Plant samples for DNA isolation
In present study leaves of 22 species Geranium were collected from dif- ferent habitats in Iran (Table 1). The leaves dried by silica gel powder (Chase and Hills 1991), were used in all experiments. One gram of young and mature leaf were collected and stored at –80 °C until extraction. For molecular studies we used different number of plant specimens, as they were required. For ex- ample, in ISSR analysis, we used 22 samples of 22 species, while for cp-DNA 10 species, and for nrDNA ITS 10 species were used (Esfandani-Bozchaloyi et al. 2017a, b, c, d, 2018a, b).
Extraction methods
Plant genomic DNA extraction Kit (DNPTM Kit), CTAB DNA extraction method by Murray and Thompson (1980) and a modified method of Saghai- Maroof et al. (1984), which was used by Sahu et al. (2012), is used and evaluat- ed here for Geranium species. Among all the tested protocols, Saghai-Maroof’s method, which was used by Sahu et al. (2012) produced good quality DNA.
Therefore, this method was taken and optimised for DNA extraction by modi- fications of the concentration of Tris-HCl, NaCl, β-mercaptoethanol, and PVP (polyvinyl pyrrolidone).
Table 1
Geranium species and populations, their localities and voucher numbers
No Species Locality Section Voucher no.
1 G. dissectum Guilan, Siahkal, Ezbaram Dissecta HSBU 201658
2 G. columbinum Guilan, Lahijan Geranium HSBU 201659
E Azerbaijan, Kaleybar cheshme
ali akbar HSBU 201660
E Azerbaijan, Kaleybar, Shojabad HSBU 201661
3 G. rotundifolium Tehran, Tuchal Geranium HSBU 201662
4 G. collinum Tehran, Damavand Geranium HSBU 201663
5 G. platypetalum E Azerbaijan, Kaleybar Tuberosa HSBU 201668 6 G. sylvaticum E Azerbaijan, Kaleybar cheshme
ali akbar Geranium HSBU 201669
7 G. pratense E Azerbaijan, Kaleybar, Shojabad Geranium HSBU 201670 8 G. ibericum Mazandaran, Tonekabon-jannat
rudbar Tuberosa HSBU 201671
9 G. gracile Mazandaran, Noshahr, Kheyrud
kenar Forest Tuberosa HSBU 201672
10 G. linearilobum Tehran, Firuz kuh Tuberosa HSBU 201673
11 G. kotschyi Alborz, Karaj- Qazvin Tuberosa HSBU 201674
12 G. tuberosum E Azerbaijan, Kaleybar cheshme
ali akbar Tuberosa HSBU 201675
13 G. trilophum Tehran, Tuchal Trilopha HSBU 201676
14 G. molle E Azerbaijan, Kaleybar, Shojabad Batrachioidea HSBU 201677 E Azerbaijan, Kaleybar, cheshme
ali akbar HSBU 201678
15 G. pyrenaicum E Azerbaijan, Kaleybar, road side Batrachioidea HSBU 201679 E Azerbaijan, Kaleybar cheshme
ali akbar HSBU 201680
E Azerbaijan, Kaleybar, Shojabad HSBU 201681
E Azerbaijan, Babak fort HSBU 201682
16 G. pusillum E Azerbaijan, Kaleybar, road side Batrachioidea HSBU 201683 E Azerbaijan, Kaleybar cheshme
ali akbar HSBU 201684
E Azerbaijan, Kaleybar, Shojabad HSBU 201685 17 G. purpureum E Azerbaijan, Kaleybar, cheshme
ali akbar Ruberta HSBU 201686
Guilan,Gole rodbar HSBU 201687
Guilan,Gole rodbar, road side HSBU 201688
Standardised extraction method
1. Preheat suspension buffer (pH 8) containing 50 mM EDTA, 120 mM Tris-HCl, 1 M NaCl, 0.5 M sucrose, 2% Triton-X 100, 5% PVP and 0.2%
β-mercaptoethanol in water bath at 60 °C for 60 min.
2. Grind 0.03–0.05 g of dried leaves to have a fine powder at room tem- perature and a mortar and pestle. – Note: To avoid usage of liquid nitrogen, this method is successfully employed.
3. Transfer the content in 2 mL micro centrifuge tubes and add 400–500 µl of suspension buffer.
4. Invert and mix gently and incubate at 60 °C for 40 min.
5. Centrifuge the suspension at 10,000 rpm for 15 min at room tempera- ture.
6. Add 1.5 mL of extraction buffer containing 20 mM EDTA, 100 mM Tris-HCl, 1.5 M NaCl, 2% CTAB, 1% β-mercaptoethanol and incubate at 60 °C for 30 min.
7. Centrifuge at 12,000 rpm for 15 min at room temperature. Carefully transfer the aqueous phase into a new tube. – Note: Use wide-bore tips for transferring the aqueous phase to avoid mechanical damage to DNA.
8. Add double volume of chloroform: isoamyl alcohol (24 : 1), and invert gently 15 to 20 times and centrifuge at 12,000 rpm for 15 min. – Note: If the aqueous layer appears translucent, repeat the step until the solution is trans- parent.
Table 1 (continued)
No Species Locality Section Voucher no.
18 G. robertianum Guilan,Gole rodbar Ruberta HSBU 201689
19 G. albanum Guilan, Sangar, road side Divaricata HSBU 201690
Guilan, Lahijan HSBU 201691
Guilan, Jirandeh HSBU 201692
Mazandaran, Siah bisheh to
Chalus HSBU 201693
Golestan, Ramian HSBU 201694
20 G. divaricatum E Azerbaijan, Kaleybar Divaricata HSBU 201695
Tehran, Darband HSBU 201696
21 G. lucidum E Azerbaijan, Kaleybar cheshme
ali akbar Lucida HSBU 201697
22 G. mascatense Khuzestan, Shushtar- Masjed
solyman Trilopha HSBU 201698
9. Add double volume of chilled isopropanol and keep at –20 °C for 1–24 hrs to precipitate the DNA. – Note: The longer the chilled incubation, the more the precipitation.
10. Centrifuge at 12,000 rpm for 15 min and discard the supernatant. To the pellet, add 300 µl of 70% chilled ethanol and spool out the pellet carefully and centrifuge again at 12,000 rpm for 15 min.
11. Discard the supernatant and vacuum dry or air dry the pellet at room temperature. – Note: Make sure that there is no residual ethanol, this is very critical especially if the DNA is to be used directly for PCR. Overdrying should also be avoided as it makes the pellet difficult to suspend.
12. Add 100 µL of high salt TE buffer (0.5 M NaCl, 10 mM Tris-HCl, 1 mM EDTA (pH 8) and keep at 37 °C for 30 min.
13. Add 300 µL of chloroform : isoamyl alcohol (24 : 1), and shake slowly for 15 min on a rocker.
14. Centrifuge at 12,000 rpm for 15 min at room temperature.
15. Carefully transfer the aqueous phase into a new tube. Add 300 µl of chilled ethanol precipitation in the presence of 3 M sodium acetate (pH 5.2) and keep at –20 °C for 1–2 hrs to precipitate the DNA.
16. Centrifuge at 12,000 rpm for 15 min and discard the supernatant. To the pellet, add 300 µl of 70% chilled ethanol and spool out the pellet carefully and centrifuge again at 12,000 rpm for 15 min.
17. Discard the supernatant and vacuum dry or air dry the pellet at room temperature.
18. Add 50 µL (depending upon the pellet) of TE 139 buffer (10 mM Tris- HCl, 1 mM EDTA, pH 8) to dissolve the precipitate. – Note: Chelator present in TE can affect PCR and restriction digests. DNA in TE should be suitably diluted before use in such reactions.
We have made some modification to the Sahu et al. (2012) protocol:
1. Grind 0.03–0.05 gram of dried leaves to have a fine powder at room temperature with a mortar and pestle.
2. Add an equal volume of chilled isopropanol and add 30 to 50 µL of 3 M sodium acetate (pH 5.2) and keep at –20 °C for 1–24 hrs to precipitate the DNA, step 10 Sahu et al. (2012).
3. We omitted also step15 Sahu et al. (2012); (Add 3 µL RNase 10 mg/mL and keep at 37 °C for 30 min).
High level of β-mercaptoethanol successfully removes the polyphenols (Suman et al. 1999). It was evident that high concentration of β-mercaptoethanol resulted in high-quality DNA. Using of NaCl concentrations higher than 0.5 M, along with CTAB, was previously recorded to be efficient in removing poly saccharides during DNA extraction (Moreira and Oliveira 2011, Paterson et al. 1993). It was also efficient in the present study with 1.5 M of NaCl concen-
tration. Polysaccharides and secondary metabolites of Geranium species were bounded by PVP and it is in concordance with previous studies (Chaudhry et al. 1999, Couch and Fritz 1990, Zhang and Stewart 2000). More replications for using chloroform : isoamyl alcohol resulted in better removing of proteins in Geranium species. Sahu et al. (2012) used sodium acetate and isopropanol only in step 15, but we used one more time of this material in order to have the better precipitation of DNA and removing most of the secondary metabo- lites and polysaccharides from the DNA. The presence of higher quantities of polyphenols and polysaccharides in mature leaves are proved by Porebski et al. (1997), which makes it very difficult to isolate DNA of good quality. So we used fresh and young leaves to overcome this problem.
Concentration, purity and quality of the DNA extracted
The quantity (concentration and extraction efficiency) and quality (pu- rity and intactness) of the DNA obtained in ratio of 1:49 (20 µL of DNA stock solution + 980 µL of double distilled sterile water) were assessed spectropho- tometrically at 260 and 280 nm, and the A260/A280 ratio was used to assess contamination with proteins by employing the spectrophotometry (Hitachi U-2001 UV/VIS), Nano-DropTM (Thermo Scientific) described by Brodmann (2008) and Wilmington (2008), and agarose gel electrophoresis, PCR meth- ods and molecular markers, such as ITS and ISSR. This spectrophotometric analysis was performed in triplicate on the samples of extracted DNA using spectrophotometer. In order to verify DNA integrity, 5 µL DNA from 7 sam- ple were subjected to gel electrophoresis on 0.8% (w/v) agarose gel, stained with ethidium bromide, and a constant voltage of 120 V for 90 min. The DNA bands were visualised and images were acquired using Gel Doc XR+ Imaging system (Bio-Rad Laboratories Inc., Germany).
ISSR amplifications
The quality of extracted DNA was examined by running on 0.8% agarose gel. 10 ISSR primers; (AGC) 5GT, (CA) 7GT, (AGC) 5GG, UBC 810, (CA) 7AT, (GA) 9C, UBC 807, UBC 823, (GA) 9T and (GT) 7CA commercialised by UBC (the University of British Columbia) were used (see Table 2). The final volume of 12 µL was tested in PCR reaction (2.5 µL PCR reaction buffer 10x, 0.875 µL MgCl2 50 mM, 0.5 µL dNTPs 10 mM, 1.0 µL primer 10 µM, 0.2 µL Taq DNA polymerase 5 unit/µL, 2.0 µL template DNA (5 ng/µL). The amplification, re- actions were performed in Techne thermocycler (Germany) with the follow- ing program: 5 min initial denaturation step 94 °C, followed by 40 cycles of 1 min at 94 °C; 1 min at 52–57 °C and 2 min at 72 °C. The reaction was completed by a final extension step of 7–10 min at 72 °C. The amplification products were
observed by running on 1% agarose gel, followed by the ethidium bromide staining. The fragment size was estimated by using a 100 bp molecular size ladder (Fermentas, Germany).
ITS-sequences
The ITS region was amplified using PCR with following primer pairs ITS4 and ITS5 (White et al. 1990). The final volume of 12 µL was tested in PCR reaction (2.5 µL PCR reaction buffer 10x, 0.875 µL MgCl2 50 mM, 0.5 µL dNTPs 10 mM, 1.0 µL primer 10 µM, 0.2 µL Taq DNA polymerase 5 unit/µL, 2.0 µL template DNA (5 ng/µL). The amplification, reactions were performed in Techne thermocycler (Germany) with the following program: 5 min initial denaturation step 94 °C, followed by 35 cycles of 1 min at 94 °C; 45 sec, at 57 °C and 2 min at 72 °C. The reaction was completed by a final extension step of 7–10 min at 72 °C. The amplification products were observed by running on 1% agarose gel, followed by the ethidium bromide staining. The fragment size was estimated by using a 100 bp molecular size ladder (Fermentas, Ger- many). The ITS and trnL-F regions were amplified using primers reported as universal primers by White et al. (1990) and Taberlet et al. (1991), respectively, for flowering plants (see Table 2).
Table 2
Primer sequences used in this study
Region Primer Sequences (5’-3’) Tm Reference
TABC CGAAATCGGTAGACGCTACG 56 Taberlet et al. (1991)
TABF ATTTGAACTGGTGACACGAG 56 Taberlet et al. (1991)
ITS4 TCCTCCGCTTATTGATATGC 57 White et al. (1990)
ITS5 GGA AGT AAA AGTCGT AAC AAG G 57 White et al. (1990)
UBS807 AGAGAGAGAGAGAGAGT 54 UBS set no. 9
UBS810 GAGAGAGAGAGAGAGAT 54 UBS set no. 9
UBC 823 TCTCTCTCTCTCTCTCC 56 UBS set no. 9
(AGC) 5GT AGC AGC AGC AGC AGC GT 56 UBS set no. 9
(CA) 7GT CACACACACACACAGT 56 UBS set no. 9
(AGC) 5GG AGC AGC AGC AGC AGC GG 56 UBS set no. 9
(CA) 7AT CACACACACACACAAT 56 UBS set no. 9
(GA) 9C GAGAGAGAGAGAGAGAGAC 56 UBS set no. 9
(GA) 9T GAGAGAGAGAGAGAGAGAT 55 UBS set no. 9
(GT) 7CA GTGTGTGTGTGTGTCA 55 UBS set no. 9
cp-DNA- sequences
The sequent of trnL-F intergenic spacer was amplified with the forward primer pair of 5’-CGAAATCGGTAGACGCTACG-3’ and reverse primer pair of 5’-ATTTGAACTGGTGACACGAG-3’ (Taberlet et al. 1991). The final vol- ume of 12 µL was tested in PCR reaction (2.5 µL PCR reaction buffer 10x, 0.875 µL MgCl2 50 mM, 0.5 µL dNTPs 10 mM, 1.0 µL primer 10 µM, 0.2 µL Taq DNA polymerase 5 unit/µL, 2.0 µL template DNA (5 ng/µL). The PCR ampli- fication program was 5 min at 95 °C, followed by 35 cycles of 1 min at 95 °C, 45 sec at 56 °C, and 2 min at 72 °C, with a final extension step of 7 min at 72
°C. The amplification products were observed by running on 1% agarose gel, followed by the ethidium bromide staining. The fragment size was estimated by using a 100 bp molecular size ladder (Fermentas, Germany).
RESULTS AND DISCUSSION
Comparison of different DNA extraction methods on agarose gel electrophoresis
The quality of 7 extracted DNA sample was verified spectrophotometri- cally using a NanoDrop instrument and agarose gel electrophoresis. DNA purity and yield were compared between these three extraction methods.Plant genomic DNA extraction Kit (DNPTM Kit) did not give proper results for
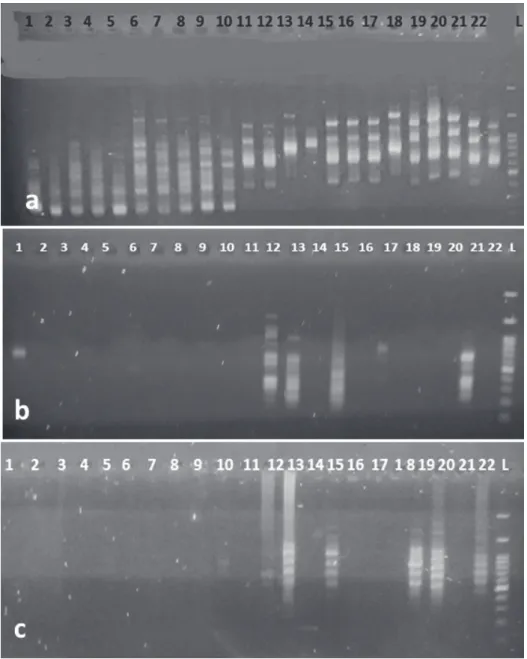
Fig 1. Electrophoretic pattern of DNA extracted by the three different methods from Gera- nium leaves. The electrophoresis was performed in 0.8% (w/v) agarose gel. The extraction
methods were: a) Kit (DNPTM Kit); b) Murray and Thompson (1980); c) Sahu et al. (2012)
Fig. 2. Amplification of DNA from Geranium leaf using three different extraction methods by ISSR amplification and the primer (AGC) 5GG. – Fig. 2a): Sahu et al. (2012); Fig. 2b): Kit (DNPTM Kit); Fig. 2c): Murray and Thompson (1980) (1 = G. dissectum, 2 = G. columbinum, 3 = G. rotundifolium, 4 = G. collinum, 5 = G. platypetalum, 6 = G. sylvaticum, 7 = G. pratense, 8
= G. ibericum, 9 = G. gracile, 10 = G. linearilobum, 11 = G. kotschyi, 12 = G. tuberosum, 13 = G.
trilophum, 14 = G. molle, 15 = G. pyrenaicum; 16 = G. pusillum; 17 = G. purpureum, 18 = G. rober- tianum, 19 = G. albanum, 20 = G. divaricatum, 21 = G. lucidum, 22 = G. mascatense)
Geranium species due to the presence of polysaccharides and proteins in the pellet and show brown or yellow DNA precipitate that presents the gDNA gel image (Fig. 1a). In Murray and Thompson (1980)’s method of extraction, we encountered many difficulties from the cell lysis to DNA separation phases in the supernatant and subsequent reactions. The presence of phenolic com- pounds caused a brownish pellet (Fig. 1b).
The results confirmed that extracted DNA by Sahu et al. (2012)’s method from leaves possess better quality in comparison with the other extraction methods as well as Kit (DNPTM Kit) and Murray and Thompson (1980)’s meth- ods (Fig. 1c).
Due to the elimination of polysaccharides or protein contaminations DNA has been extracted with high quality. We believe that this method will be efficient for molecular studies of many other aromatic and herbal plants.
Clear banding patterns were observed in the ISSR study by Sahu et al.
(2012)’s method (Fig. 2a) that possess better quality in comparison with the other extraction methods as well as Kit (DNPTM Kit) (Fig. 2b) and Murray and Thompson (1980)’s methods (Fig. 2c).
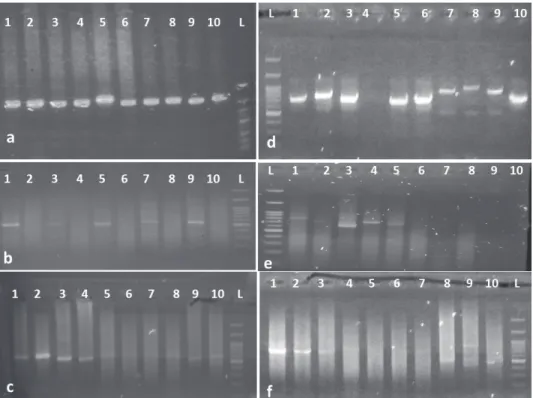
PCR tests outcomes in the ITS (Fig. 3a–c) and trnL-F (Fig. 3d–f) study showed that the extracted DNA by Sahu et al. (2012)’s method (Fig. 3a, d) from leaf samples brings an acceptable quality for PCR, and as the most appropri- ate method in aspect of quality of DNA extracted from young leaves of Ge- ranium. The PCR-amplified DNA fragments of ITS and trnL-F for 10 samples showed a clean single band product when examined on an agarose gel (Fig.
3). The PCR products were of about 800 bp.
UV spectrophotometer and NanoDrop™ 1000 spectrophotometer
In spectrophotometer procedure, absorption of double-stranded DNA in wavelength of 260 nm is 50 µg/µL. In fact, the ratio of absorption amount resulted in 260 nm to 280 nm is range from 1.7 to 2. It shows the most absorp- tion is done by nucleic acids and therefore extracted DNA is well-qualified and its purity is acceptable. If the ratio is appreciably lower in either case, it may indicate the presence of protein, phenol or other contaminants that ab- sorb strongly at or near 280 nm. The results showed that the DNA yield and DNA purity obtained from one g of the fresh leaf tissue in different methods using UV spectrophotometer was statistically significant (P ≤ 0.01). A higher DNA yield was obtained with method of Sahu et al. (2012) (450±88.1 ng/µL fresh weight), while the lowest was obtained with method of Murray and Thompson (1980) (292±44.4 ng/µL fresh weight) (Table 3). Therefore, the re- sults confirmed that extracted DNA by Sahu et al. (2012)’s method from leaves of Geranium possess better quality and quantity in comparison with the other
methods. DNA sample was measured with a UV spectrophotometer for the ratio of OD260/OD280 using TE buffer. The ratio of OD260/OD280 was de- termined in order to assess the purity and concentration of the DNA sample.
DNA concentration was calculated according to the equation of Wilmington (2008). DNA concentration (ng/µL) = OD260 × a (dilution factor) × 50.
Absorbance measurements made on a spectrophotometer, including any Thermo Scientific NanoDrop Spectrophotometer, will include the absorbance of all molecules in the sample that absorb at the wavelength of interest.
The ratio of absorbance at 260 nm and 280 nm is used to assess the purity of DNA and RNA. A ratio of ~1.8 is generally accepted as “pure” for DNA; a ratio of ~2.0 is generally accepted as “pure” for RNA. If the ratio is appreci- ably lower in either case, it may indicate the presence of protein, phenol or other contaminants that absorb strongly at or near 280 nm.
Some researchers encounter a consistent 260/280 ratio change when switching from a standard cuvette spectrophotometer to a NanoDrop spec-
Fig. 3. Agarose gel (1.5%) showing the PCR amplified ITS (Fig. 3a, b, c) and trnL-F (Fig. 3d, e, f) of the plant materials used in the present study. – Fig. 3a, d): Sahu et al. (2012); Fig.
3b, e): Kit (DNPTM Kit); Fig. 3c, f): Murray and Thompson (1980) (1 = G. dissectum, 2 = G.
columbinum, 3 = G. rotundifolium, 4 = G. collinum, 5 = G. platypetalum, 6 = G. sylvaticum, 7 = G.
pratense, 8 = G. ibericum, 9 = G. gracile, 10 = G. linearilobum) 100 bp DNA ladder)
trophotometer. The three main explanations for this observation are listed be- low: Small changes in the pH of the solution will cause the 260/280 to vary*.
Acidic solutions will under-represent the 260/280 ratio by 0.2–0.3, while a basic solution will over-represent the ratio by 0.2–0.3. If comparing results obtained using a NanoDrop spectrophotometer to results obtained using oth- er spectrophotometers, it is important to ensure that the pH of an undiluted sample measured on our instruments is at the same pH and ionic strength as the diluted sample measured on the conventional spectrophotometer.
The NanoDrop absorbance is useful for detection of contaminants such as protein, salts, and polysaccharides, which can inhibit and interfere in DNA se- quencing. The NanoDrop 1000 spectrophotometer has the capability to meas- ure highly concentrated samples without dilution. The ratio of 260 and 280 nm absorbance is used to assess the purity of DNA and RNA. This ratio is between 1.7 and 1.8, and this range is generally accepted as “pure” for DNA (Table 3).
CONCLUSIONS
In this study, three DNA extraction methods were compared to isolate high quality DNA that can be efficiently amplified using PCR. Murray and Thompson (1980) and DNPTM Kit resulted in brown or yellow DNA precipi- tate that could not be reliably amplified by PCR. Therefore, we used the pro- tocol of Sahu et al. (2012)’s method that produced good quality DNA from these sources that of the methods also was applied successfully to mangroves and salt marsh plants containing elevated concentrations of polysaccharide and polyphenolic compounds (Sahu et al. 2012).
Sahu et al. (2012)’s method helped us to provide a pure DNA with high efficiency in Geranium species. Advantages of the present method for study- ing medicinal plants with secondary metabolites are as follows: 1) omission of liquid nitrogen, 2) decrease of toxic effects, hazardous, expensive of some component as phenol in other methods, 3) lower amount of dried or fresh
Table 3
Comparison of means for efficiency of three different DNA extraction methods in leaf samples of leaves Geranium using Duncan’s multiple range test (P ≤ 0.01)
Methods Spectrophotometer Nano-Drop
DNA yield
(ng/µL) DNA purity
(ng/µL) DNA yield
(ng/µL) DNA purity (ng/µL) Sahu et al. (2012) 450±88.1 2.1±0.15 590.4±86.5 1.84±0.15 Kit (DNPTM Kit) 323±33.8 1.8±0.18 767.5±11.8 1.70±0.09 Murray and Thompson (1980) 292±44.4 1.7±0.19 555±76.4 1.78±0.07
plant material, without any conservation specific condition. Although this method has many advantages, it is time-consuming. The DNA extracted us- ing this protocol can be used for whole-genome sequencing, advanced se- quencing technologies, and bioinformatics tools.
*
Acknowledgement – This project was supported by Faculty Life Sciences and Biotechnology, Shahid Beheshti University, Tehran, Iran.
REFERENCES
Aedo, C., Aldasoro, J. J. and Navarro, C. (1998): Taxonomic revision of Geranium L., sec- tions Divaricata Rouy and Batrachioidea W. D. J. Koch (Geraniaceae). – Ann. Mo. Bot.
Gard. 85: 594–630. https://doi.org/10.2307/2992018
Bate-Smith, E. C. (1973): Chemotaxonomy of Geranium. – Bot. J. Linn. Soc. 67: 347–359.
https://doi.org/10.1111/j.1095-8339.1973.tb02552.x
Baytop, T. (1999): Therapy with medicinal plants in Turkey (past and present). 2nd ed. – Nobel Tip Kitabevleri Ltd., Istanbul, 334 pp.
Bi, I. V., Harvengt, L., Chandelier, A., Mergeai, G. and Jardin, P. D. (1996): Improved RAPD amplification of recalcitrant plant DNA by the use of activated charcoal during DNA extraction. – Plant Breeding. 115: 205–206. https://doi.org/10.1111/j.1439-0523.1996.
tb00905.x
Brondmann, P. (2008): DNA extraction from different matrices. – Molecular Biology Methods for Traceability Purposes, BfR Berlin, Germany, pp. 18–19.
Chase, M. W. and Hills, H. H. (1991): Silica gel: an ideal material for field preservation of leaf samples for DNA studies. – Taxon. 40: 215–220. https://doi.org/10.2307/1222975 Chaudhry, B., Yasmeen, A., Husnain, T. and Riazuddin, S. (1999): Mini-scale genom-
ic DNA extraction from cotton. – Plant Mol. Biol. Rep. 17: 280. https://doi.
org/10.1023/A:1007629715971
Couch, J. A. and Fritz, P. J. (1990): Isolation of DNA from plants high in polyphenolics. – Plant Mol. Biol. Rep. 8: 8–12. https://doi.org/10.1007/bf02668875
Csaikl, U., Bastian, H., Brettschneider, R., Gauch, S., Meir, A., Schauerte, M. and Zie- genhagen, B. (1998): Comparative analysis of different DNA extraction proto- cols: a fast, universal maxi-preparation of high quality plant DNA for genetic evaluation and phylogenetic studies. – Plant Mol. Biol. Rep. 16: 69–86. https://doi.
org/10.1023/A:1007428009556
Doyle, J. J. and Doyle, J. E. (1990): Isolation of plant DNA from fresh plant tissue. – Focus 12: 13–15.
Esfandani-Bozchaloyi, S., Sheidai, M., Keshavarzi, M. and Noormohammadi, Z. (2017a):
Genetic diversity and morphological variability in Geranium purpureum Vill. (Gera- niaceae) of Iran. – Genetika 49: 543–557. https://doi.org/10.2298/gensr1702543b Esfandani-Bozchaloyi, S., Sheidai, M., Keshavarzi, M. and Noormohammadi, Z. (2017b):
Species delimitation in Geranium Sect. Batrachioidea: morphological and molecular.
– Acta Bot. Hung. 59(3–4): 319–334. https://doi.org/10.1556/034.59.2017.3-4.3
Esfandani-Bozchaloyi, S., Sheidai, M., Keshavarzi, M. and Noormohammadi, Z. (2017c):
Genetic and morphological diversity in Geranium dissectum (Sec. Dissecta, Ge- raniaceae) populations. – Biologia 72(10): 1121–1130. https://doi.org/10.1515/bi- olog-2017-0124
Esfandani-Bozchaloyi, S., Sheidai, M., Keshavarzi, M. and Noormohammadi, Z. (2017d):
Analysis of genetic diversity in Geranium robertianum by ISSR markers. – Phytol.
Balcan. 23(2): 157–166.
Esfandani-Bozchaloyi, S., Sheidai, M., Keshavarzi, M. and Noormohammadi, Z. (2018a):
Species relationship and population structure analysis in Geranium subg. Robertium (Picard) Rouy with the use of ISSR molecular markers. – Acta Bot. Hung. 60(1–2):
47–65. https://doi.org/10.1556/034.60.2018.1-2.4
Esfandani-Bozchaloyi, S., Sheidai, M., Keshavarzi, M. and Noormohammadi, Z. (2018b):
Species identification and population structure analysis in Geranium subg. Gerani- um (Geraniaceae). – Hacquetia 17(2): 235–246. https://doi.org/10.1515/hacq-2017-0007 Esfandani-Bozchaloyi, S., Sheidai, M., Keshavarzi, M. and Noormohammadi, Z. (2018c):
Morphometric and ISSR-analysis of local populations of Geranium molle L. from the southern coast of the Caspian Sea. – Cytol. Genet. 52: 309–321. https://doi.org/10.3103/
s0095452718040102
Gupta, P. K., Varshney, R. K., Sharma, P. C. and Ramesh, B. (1999): Molecular markers and their applications in wheat breeding. – Plant Breeding 118: 369–390. https://doi.
org/10.1046/j.1439-0523.1999.00401.x
Jenderek, M., Shierenbeck, K. and Olney, A. (1997): Development of random amplified poly- morphic DNA markers characteristic of Hibiscus rosa-sinensis and H. syriacus. – Center for Irrigation Technology, California State University, USA.
Khadivi-Khub, A., Zamani, Z. and Bouzari, N. (2008): Evaluation of genetic diversity in some Iranian and foreign sweet cherry cultivars by using RAPD molecular markers and morphological traits. – Hortic. Environ. Biotechnol. 49: 188–196.
Lodhi, M. A., Ye, G. N., Weeden, N. F. and Reisch, B. I. (1994): A simple and efficient meth- od for DNA extraction from grapevine cultivars and Vitis species. – Plant Mol. Biol.
Rep. 12: 6–13. https://doi.org/10.1007/bf02668658
Loomis, W. D. (1974): Overcoming problems of phenolics and quinones in the isola- tion of plant enzymes and organelles. – Meth. Enzymol. 31: 528–544. https://doi.
org/10.1016/0076-6879(74)31057-9
Moreira, P. A. and Oliveira, D. A. (2011): Leaf age affects the quality of DNA extracted from Dimorphandra mollis (Fabaceae), a tropical tree species from the Cerrado region of Brazil. – Genet. Mol. Res. 10: 353–358. https://doi.org/10.4238/vol10-1gmr1030
Murray, M. G. and Thompson, W. F. (1980): Rapid isolation of high molecular weight plant DNA. – Nucleic Acids Res. 8: 4321–4325. https://doi.org/10.1093/nar/8.19.4321
Paterson, A. H., Brubaker, C. L. and Wendel, J. F. (1993): A rapid method for extraction of cotton (Gossypium spp.) genomic DNA suitable for RFLP or PCR analysis. – Plant Mol. Biol. Rep. 11: 122–127. https://doi.org/10.1007/bf02670470
Porebski, S., Bailey, L. G. and Baum, B. R. (1997): Modification of a CTAB DNA extraction protocol for plants containing high polysaccharide and polyphenol component. – Plant Mol. Biol. Rep. 15: 8–15. https://doi.org/10.1007/bf02772108
Reichandt, M. and Rogers, S. (1994): Preparation of plant DNA using CTAB. – Curr. Protoc.
Mol. Biol. 12: 233–237.
Saghai-Maroof, M. A., Soliman, K. M., Jorgensen, R. A. and Allard, R. W. (1984): Ribosomal DNA spacer-length polymorphisms in barley: mendelian inheritance, chromosomal
location, and population dynamics. – Proc. Natl. Acad. Sci. USA 81: 8014–8018. https://
doi.org/10.1073/pnas.81.24.8014
Sahu, S. K., Thangaraj, M. and Kathiresan, K. (2012): DNA extraction protocol for plants with high levels of secondary metabolites and polysaccharides without using liquid nitrogen and phenol. – ISRN Mol. Biol. 11: 1–6. https://doi.org/10.5402/2012/205049 Sarkhosh, A., Zamani, Z., Fatahi, R. and Ebadi, A. (2006): RAPD markers reveal polymor-
phism among some Iranian pomegranate (Punica granatum L.) genotypes. – Sci.
Hort. 111: 24–29. https://doi.org/10.1016/j.scienta.2006.07.033
Schönbeck-Temesy, E. (1970): Geraniaceae. – In Rechinger, K. H. (ed.): Flora Iranica, Vol 69.
Akademische Druck, Graz, Austria, pp. 30–58.
Suman, P. S. K., Ajit, K. S., Darokar, M. P. and Sushil, K. (1999): Rapid isolation of DNA from dry and fresh samples of plants producing large amounts of secondary metabolites and essential oils. – Plant Mol. Biol. Rep. 17: 74. https://doi.org/10.1023/A:1007528101452 Taberlet, P., Gielly, L., Pautou, G. and Bouvet, J. (1991): Universal primers for amplifica-
tion of three non-coding regions of chloroplast DNA. – Plant Mol. Biol. 17: 1105–1109.
https://doi.org/10.1007/bf00037152
Talebi-Baddaf, M., Sharifi-Neia, B. and Bahar, M. (2003): Analysis of genetic diversity in pome- granate cultivars of Iran, using random amplified polymorphic DNA (RAPD) markers. – Proceeds., Third National Congress of Biotechnology, Iran, pp. 343–345.
Weising, K., Nybom, H., Wolff, K. and Meyer, W. (1995): DNA isolation and purification. In:
DNA fingerprinting in plants and fungi. – CRC Press, Boca Raton, Florida, pp. 44–59.
White, T. J., Bruns, T., Les, S. and Taylor, J. (1990): Amplification and direct sequencing of fun- gal ribosomal RNA genes for phylogenetics. – In: Innis, M. A., Gelfand, D. H., Sninsky, J. J. and White, T. J. (eds): PCR protocols: a guide to methods and application. Aca- demic Press, San Diego, pp. 315–322.
Wilmington, D. E. (2008): NanoDrop 1000 Spectrophotometer V3.7 User’s Manual. – Thermo Fisher Scientific Inc., 105 pp.
Zamboni, A., Pierantoni, L. and De Franceschi, P. (2008): Total RNA extraction from straw- berry tree (Arbutus unedo) and several other woody-plants. – IForest, Biogeosci. For- est. 1: 122–125. https://doi.org/10.3832/ifor0465-0010122
Zhang, J. and Stewart, J. M. (2000): Economical and rapid method for extracting cotton genomic DNA. – J. Cotton. Sci. 4: 193–201.