Sustainable Cities and Society 72 (2021) 103029
Available online 21 May 2021
2210-6707/© 2021 The Author(s). Published by Elsevier Ltd. This is an open access article under the CC BY license (http://creativecommons.org/licenses/by/4.0/).
Urban mobility scenarios until the 2030s
M ´ ark Miskolczi
a,*, D ´ avid F oldes ¨
b, Andr ´ as Munk ´ acsy
c, Melinda J aszber ´ ´ enyi
daCorvinus University of Budapest, Institute of Marketing, Budapest, Hungary
bBudapest University of Technology and Economics, Faculty of Transportation Engineering and Vehicle Engineering, Department of Transport Technology and Economics, Budapest, Hungary
cKTI Institute for Transport Sciences, Department for Transport Management, Budapest, Hungary
dCorvinus University of Budapest, Institute of Marketing, Budapest, Hungary
A R T I C L E I N F O Keywords:
Automation Autonomous vehicles Shared mobility Electrification Scenario analysis Scenario building
Systematic literature review (SLR) Future of urban mobility
A B S T R A C T
Urban mobility is particularly affected by technology development. This research focuses on the mobility system of cities in the foreseeable future – that is, until the 2030s. A systematic literature review (SLR) of 62 scientific documents and 52 scenarios predicted and developed by researchers are presented here, providing a compre- hensive picture of current urban transport research perspectives. Based on a complex method built for this re- view, four scenarios (‘Grumpy old transport’, ‘At an easy pace’, ‘Mine is yours’, and ‘Tech-eager mobility’) have been created, each forecasting a different path towards future urban mobility. The scenarios so formed describe the expected role and potential of emerging mobility solutions (namely autonomous vehicles, shared mobility, and electrification) and include socio-economic and environmental perspectives. By 2030, most likely pathways are the ‘At an easy pace’ or the ‘Mine is yours’ scenarios, which means that only an incremental advance, such as a slow shift towards self-driving, electric and shared vehicle use is predicted.
1. Introduction
While the future of urban mobility seems uncertain, several concepts are generated by new or improved technologies including autonomous vehicles (AVs), electric vehicles (EVs) and the integration of shared mobility services (Burns, 2013; Dia, 2019; Nijkamp & Kourtit, 2013;
Schuckmann, Gnatzy, Darkow, & Heiko, 2012). The evolution is con- strained by increasing global challenges, such as rapidly changing and diverse consumer demands and urbanization (Brenden, Kristoffersson, &
Mattsson, 2017; Zmud, Ecola, Phleps, & Feige, 2013). As a result, there is a growing demand for mobility services, including passenger and freight transport, which leads to severe problems in larger cities, such as congestion and air pollution (Becker et al., 2020; Menezes, Maia, & de Carvalho, 2017; Tromaras, Aggelakakis, Hoppe, Trachsel, & Anoyrkati, 2018). A key challenge facing future urban mobility is to find an effec- tive balance between economic sustainability, environmental regula- tions, and travellers’ satisfaction (Canitez, 2019; Nikitas, Kougias, Alyavina, & Njoya Tchouamou, 2017).
Currently, shared mobility is identified as one of the most promising solutions in urban mobility (Nikitas et al., 2017; Shaheen & Chan, 2016;
Standing, Standing, & Biermann, 2019) in order to reduce negative
externalities and to raise user satisfaction. Other ways of reducing negative impacts of urban mobility could be a shift towards low and zero-emission modes, enhancing the role of EVs (Csonka & Csisz´ar, 2017; Ferrero, Perboli, Rosano, & Vesco, 2018; Lee & Erickson, 2017;
Yamagata & Seya, 2013), and moderating travel demand (Bohnes, Gregg, & Laurent, 2017; Lah, Fulton, & Arioli, 2019). Reducing the burden on the environment may be achieved by minimizing travel needs (e.g., enabling telecommuting and distance learning, as well as improving and extending online services) and reorganizing the capac- ities of on-demand services (Liyanage, Dia, Abduljabbar, & Bagloee, 2019). This could work within the framework of the Mobility-as-a-Service (MaaS) concept (Kamargianni, Li, Matyas, &
Sch¨afer, 2016; Kane & Whitehead, 2017; Smith, Sochor, & Karlsson, 2018), which offers mobility services as packages rather than offering access to individual means of transport.
Another promising way to develop urban mobility systems is the spread of AVs (Burns, 2013; Schuckmann et al., 2012; Tromaras et al., 2018). The purpose of automation is to ensure that various processes are carried out with minimum human intervention and in compliance with required cost-effectiveness criteria (Fagnant & Kockelman, 2015). The expected impacts generated by AVs are the increased performance of the
* Corresponding author.
E-mail addresses: mark.miskolczi@uni-corvinus.hu (M. Miskolczi), foldes.david@mail.bme.hu (D. F¨oldes), munkacsy.andras@kti.hu (A. Munk´acsy), jaszberenyi@
uni-corvinus.hu (M. J´aszber´enyi).
Contents lists available at ScienceDirect
Sustainable Cities and Society
journal homepage: www.elsevier.com/locate/scs
https://doi.org/10.1016/j.scs.2021.103029
Received 20 January 2021; Received in revised form 3 May 2021; Accepted 16 May 2021
transport system, for instance, efficient route distribution (Pauer &
T¨or¨ok, 2019), safer transport, individual travel options for people without a driving license, increased energy efficiency and improved land use (Fagnant & Kockelman, 2015; Tor¨ok, Derenda, Zanne, ¨ & Z¨oldy, 2018). The general approach is to think in terms of the highest auto- mation level for vehicles, as defined by SAE (2018), which is usually foreseen for 2040 or rather 2050 (Bagloee, Tavana, Asadi, & Oliver, 2016).
Previous research into new technologies (Kane & Whitehead, 2017;
Lyons, 2018; Nikitas et al., 2017; Tromaras et al., 2018) suggest that the implementation of shared solutions and the development of EVs and AVs are the possible drivers of future mobility systems; however, the role of these innovations in future urban mobility is not yet clear. Therefore, it is necessary to synthesize previous research on future mobility and narrow down the potential outcomes.
Accordingly, this paper provides a comprehensive insight into cur- rent expectations of researchers concerning future urban mobility. The objective of this research is to better understand what major trends shape urban mobility in the tangible future, i.e., until the 2030s. This has
been translated into three (sub-)questions:
▪ What are the technological innovations that might shape the future of urban mobility?
▪ What are the current issues of urban passenger transport that thematize researchers’ forecasts?
▪ Based on researchers’ forecasts (scenarios), what are the most likely directions for the alteration in urban passenger transport?
A systematic literature review has been carried out to achieve the objective, paying particular attention to recent scientific literature (published between 2012 and early 2021). Potential transition pathways towards urban mobility and scenarios were identified.
The remainder of the paper is structured as follows. In Section 2, the methodology – the process of SLR, as well as scenario analysing and building – is introduced. Forecasts and scenarios built are presented and discussed in Section 3. Finally, conclusions and limitations are drawn.
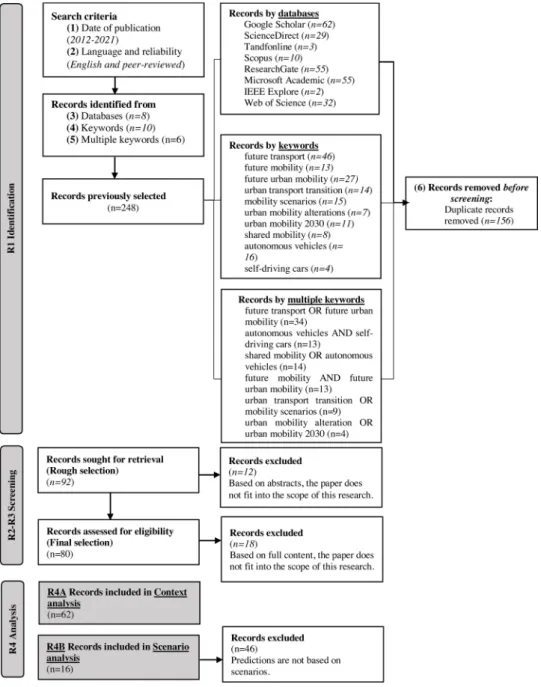
Fig. 1. SLR flow diagram.
2. Methodology
To explore the future of the transport sector is challenging, as in addition to technological changes, other aspects, such as user behaviour, policy perspectives and economic constraints also have significant in- fluence. Most researchers have elaborated scenarios using the Delphi method (Jittrapirom et al., 2017; Spickermann, Grienitz, & Heiko, 2014) or conducting a literature review (Kamargianni et al., 2016; Sochor, Stromberg, ¨ & Karlsson, 2015; Standing et al., 2019).
In this paper, a systematic literature review (SLR) is applied, an exploratory research method to synthesize and critically appraise research into a specific topic according to a pre-defined perspective (Denney & Tewksbury, 2013). SLRs aim to recognize areas that require more consideration from researchers and unify existing concepts.
Herein, the SLR is used to analyse trends and scenarios of future urban mobility. Scenarios provide insights into the technological and socio-economic details of alterations as a conceptual proposal and particularly support decision-making in uncertain circumstances, espe- cially for long-term planning (Bishop, Hines, & Collins, 2007; Melander, 2018; Wee & Banister, 2016). The SLR has been carried out following the PRISMA guidelines, an evidence-based set of items for systematic reviews and meta-analyses (Page, McKenzie, & Bossuyt, 2021).
2.1. Systematic literature review (SLR) method
Based on the PRISMA framework, a four-step literature analysis method has been elaborated and applied (Fig. 1): identification (R1), screening in 2 phases (R2 and R3), and analysis (R4).
R1 Identification: defining the research criteria and conducting a systematic keyword-based search to find papers (for details, see this online Table of records).
(1) Date of publication: defining the time interval. Papers published between 2012 and early 2021 were considered to identify research trends of recent years.
(2) Language and reliability: determining the languages and types of paper. Primarily, papers published in international peer- reviewed scientific journals in English were considered.
(3) Database selection: selecting the search engines. Comprehensive, reliable, and easily accessible databases were selected: Google Scholar, ScienceDirect, Tandfonline, Scopus, ResearchGate, Microsoft Academic, IEEE Explore, Web of Science.
(4) Keyword selection: determining the keywords according to the research objectives: searching papers including urban mobility scenarios or forecasts, and papers relating to urban passenger transport including different system features (especially techno- logical, socio-economic and/or environmental). The following 10 keywords were applied: “future transport”, “future mobility”,
“future urban mobility”, “urban transport transition”, “mobility scenarios”, “urban mobility alteration”, “urban mobility 2030”,
“shared mobility”, “autonomous vehicles”, “self-driving cars”.
(5) Multiple keywords: determination of keyword-pairs to improve the searching process. Boolean operators were applied: OR searches including similar search terms were conducted to broaden the number of records on future mobility regardless of which term is used in the document, as well as AND searches were run to nar- row the search and to capture documents in which both concepts appear.
(6) Duplicate records: removing duplicate records found in several databases. A total of 248 seemingly relevant results were detected in the first step. After organizing the records, duplications (n = 156) were removed, thus 92 papers were included in the first screening (R2).
R2 Screening based on abstracts (Rough selection): screening of the identified 92 papers by title and abstract whether they fit in the
scope of the research (to answer RQs). It resulted in the exclusion of 12 papers.
R3 Screening based on the full content (Final selection):
screening of 80 papers by full text review resulted in the exclusion of 18 papers.
R4 Qualitative analysis: two-step analysis of topics and scenarios.
R4A Context analysis: an overview of the findings about the future transport in selected papers (n =62) to explore themes along which scenario analysis (S1 – Thematic scenario analysis – Fig. 2) can be done.
R4B Scenario analysing and building: identifying future mobility scenarios. In total, 16 papers included explicit scenarios. These papers have been selected for analysis to formulate complex scenarios.
2.2. Scenario analysing and building
In R4, papers including scenarios were further analysed to reveal their basic features (e.g., the similarity of papers, date of publication, methodology applied, geographical scope) (S0). A multi-criteria sce- nario building method was elaborated (S1-S2) to reveal alternative di- rections of the future (Fig. 2).
S0 Synthetization: analysing the selected papers containing sce- narios with the following attributes:
a Date of publication: presenting differences in the interpretation of future mobility trends over time.
b Methodology applied: explaining the reliability and standardization of the results.
c Geographical scope: identifying the regions the results relate to, as well as to clarify the regional issues of each scenario.
d Similarity: determining the similarity of scientific documents.
Bibliographic coupling and co-citation analysis are applied to calculate the coupling strength among papers analyzed (Gipp & Beel, 2009). Papers are bibliographically coupled if they cite one or more documents in common (Zhang, Chen, & Li, 2009). In contrast, two papers are co-cited if at least one paper cites both (Gipp & Beel, 2009;
Zhang et al., 2009). During step S0, papers with scenarios are examined whether they refer to each other to point correlations between researchers’ perceptions.
S1 Thematic scenario analysis: analysing scenarios in terms of themes selected based on the context analysis (R4A). A parameter was introduced for evaluation (Table 1) to assess the impacts of each theme in each scenario: 1 represents the current stage without relevant changes, 2 promises some (moderate) changes, and 3 indicates an expected future stage with a significant change(s).
Based on this, the evaluation value is xji;where j is the evaluation of key themes (A–F) and i is the number of scenarios. To determine the aggregated evaluation value of scenarios, the xji evaluation values are summarized (Eq. 1). Accordingly, aggregated evaluation values (total score) can range from 6 to 18.
Xj=∑
i
xji (1)
S2 Scenario building: in the Thematic scenario analysis (S1), key themes are defined to categorize existing scenarios and create new ho- mogenous groups, i.e., comprehensive scenarios based on existing sce- narios from the literature. Key themes were selected from the themes that have the strongest influence on urban transport transition. The number of new scenarios depends on the heterogeneity of the existing visions (that is, how many groups can be classified as uniform according to the six themes examined).
3. Results
3.1. Context analysis
As a result of the literature review, 16 papers contain scenarios and 46 further papers contain forecast trends or particular features of future mobility. In line with the introduction of the present paper providing general overview of current issues and emerging trends, a brief review of these 62 papers is carried out. Mobility-related problems and challenges identified by the papers are as follows:
▪ Researchers argue that, due to poor performances and the obsolescence of mobility services and vehicles, travel times are increasing (Dia, 2019; McCormick, Anderberg, Coenen, & Neij, 2013; Schuckmann et al., 2012; Wegener, 2013), whilst
consumer satisfaction is decreasing and environmental im- pacts, particularly GHG emissions are worsening (Dong et al., 2018; Schipper, Emanuel, & Oldenziel, 2020; Lyons, 2018;
Moradi & Vagnoni, 2018; Waisman, Guivarch, & Lecocq, 2013).
▪Social issues, especially social attitudes, such as individual be- liefs and mobility culture (Bagloee et al., 2016; Bergman, Schwanen, & Sovacool, 2017; Clements & Kockelman, 2017;
Madigan, Louw, Wilbrink, Schieben, & Merat, 2017), as well as consumers’ mobility-related decisions influenced by economic measures (Manski, 2000; Nijkamp & Kourtit, 2013; Shaheen &
Chan, 2016; Standing et al., 2019) were pointed out as signif- icant challenges.
▪ In the above-mentioned papers, one of the core topics is how to influence users’ decision-making to relieve congestion and, thus, how to reduce the overload in the urban transport system.
Besides problems and challenges, solutions are also foreseen:
▪ Several studies (e.g., Currie, 2018; Nikitas et al., 2017; Standing et al., 2019) found that shared mobility might be one to face major problems. Intermodal services, MaaS and basic forms of sharing mobility may encourage travellers to dispose their private cars (Liyanage et al., 2019; Madigan et al., 2017;
Spickermann et al., 2014). However, some of the papers reviewed (Jittrapirom et al., 2017; Kamargianni et al., 2016;
Tokody & Mezei, 2017) underline that the widespread use of shared mobility might have significant social constraints.
Furthermore, sharing mobility does not address many of the comfort factors (e.g., driving without any zone restrictions) (Bergman et al., 2017). The integration of AV use into a shared Fig. 2. Scenario analysing and building method.
Table 1
Evaluation parameter.
xji Meaning Description
1 current stage without
relevant changes It is stated that the theme does not make a significant change (e.g., the mass public uptake of the technology has not happened), or its effect is not mentioned.
2 moderate changes The theme is mentioned and its effects are clearly described (e.g., the spread of the technology is increasing), but it does not result in radical changes (e.g., conventional means of transport remain essential).
3 significant changes The significance of the theme is highlighted (e.g., innovation takes over the role of conventional solutions).
mobility system or linking it to MaaS is also discussed as a potential solution to mobility problems (Aparicio, 2017;
Clements & Kockelman, 2017; Narayan, 2017; Nikitas et al., 2017; Standing et al., 2019; Zawieska & Pieriegud, 2018).
▪ In general terms, automation is considered a tool for creating smart cities and smart mobility (Canitez, 2019; Coppola &
Silvestri, 2019; Dey, Fries, & Ahmed, 2018; Pauer & T¨or¨ok, 2019; Seuwou, Banissi, & Ubakanma, 2020) and faces several challenges. As regards economic impacts, the increasing adoption of automated technology affects almost every in- dustry (Freudendal-Pedersen, Kesselring, & Servou, 2019;
Zawieska & Pieriegud, 2018; Melander, Dubois, Hedvall, &
Lind, 2019, Schoettle and Sivak 2014). Many questions related to technology acceptance, barriers and risks (e.g., moral and legal dilemmas) of driverless cars seem to still be unanswered.
The evolution will result in losses in some industries, for instance in employment in the legal profession, in the insurance sector and of professional drivers (Madigan et al., 2017).
Moreover, several moral issues, such as re-training redundant workforce or managing human-machine interactions influence the extent of this technology (Bergman et al., 2017; Fagnant &
Kockelman, 2015; T¨orok et al., 2018). However, during the ¨ transition period and due to the mixed technological scene and the uncertain legal environment, the role of some business
Table 2
S0 – Date of publication, methodology applied and geographical scope of scenario-based papers.
Code Author(s) No. of
scenarios Scenario Year Date of
publication Methodology applied Geographical scope
P1 Ecola et al. 1 The great reset
2030 2016 expert interviews, cluster analysis Asia (China)
2 Slowing but growing
3 Wild card - Low probability
P2 Kane and Whitehead
4 Sub-optimal scenario A
2030 2017 literature review Australia
5 Sub-optimal scenario B 6 Sub-optimal scenario C 7 Sub-optimal scenario D P3 Kaufmann and
Ravalet
8 Ultramobility
2050 2016 literature review, survey Europe (France)
9 Altermobility
10 Proxymobility
P4 Keseru et al.
11 Slow is beautiful
2030 2019 stakeholder interviews Europe
12 Data world
13 Digital nomads
14 Minimum Carbon
P5 Marletto 15 Auto-city
2030 2014 literature review Europe (Netherlands)
16 Eco-city
17 Electri-city
P6 Marletto 18 Individual transition pathway
2040 2019 literature review Europe (Netherlands)
19 Shared Transition pathway 20 Smart transition pathway
P7 Milakis et al.
21 AV in demand
2030 2017 stakeholder interviews/workshops Europe (Netherlands)
22 AV in doubt
23 AV in standby
24 AV in bloom
P8 Brenden et al.
25 Same same but different
2030 2017 literature review Europe (Sweden)
26 Follow the path
27 Sharing is the new black 28 What you need is what you get
P9 Schippl et al. 29 Waterberg
2025 2016 stakeholder interviews/workshops Europe
30 Viga
31 Valanov
P10 Shergold et al.
32 Home ties
2030 2015 expert interviews/workshops Europe
(UK)
33 Communal Call-out
34 Gimme Shelter
35 Home alone and Wired
P11 Zmud et al. 36 37 Scenario 1 Scenario 2 2030 2013 expert interviews, cluster analysis Europe
P12 Zmud et al. 38 No Free Lunch
2030 2014 five-step scenario development based on both quantitative and qualitative (expert
opinions) data United States
39 Fuelled and Freewheeling
P13 Banister and Hickman
40 BAU
2030 2013 exploratory research – secondary data
analysis Asia
(India - Delhi) 41 Scenario 1—Lower Carbon
Emissions Motor Vehicles 2030 42 Scenario 2—Increased Active
Travel 2030
43 Scenario 3—Towards
Sustainable Transport 2030
P14 Fulton et al.
44 BAU - Limited intervention
2050 2017 exploratory research – secondary data
analysis United States, Europe,
Asia (China and Japan)
45 The 2R Scenario:
Electrification and Automation 46 The 3R Scenario: Adding
Shared Mobility
P15 Rohr et al. 47 Driving Ahead
2035 2016 Desktop research, expert interviews Europe (UK)
48 Live Local
49 Digital Divide
P16 Julsrud and Uteng
50 Controlled mobility
2050 2015 Delphi-method Europe (Norway)
51 Technopolis
52 Shared mobility
areas resolving uncertainty (e.g., the legal profession) will in- crease for a short period (Clements & Kockelman, 2017).
▪ The future urban mobility predicted is not only shared and autonomous but electric (Becker et al., 2020; Csonka & Csisz´ar, 2017). In that way, sustainability can be delivered (Bohnes et al., 2017; Burns, 2013; Lah et al., 2019; Olsson, Hjalmarsson, Wikstr¨om, & Larsson, 2015). However, others (Dong et al., 2018; Fagnant & Kockelman, 2015; Freudendal-Pedersen et al., 2019) call into question the global sustainability of EVs (the environmental impacts of battery production, vehicle life cycle, etc.). Market positioning (Zawieska & Pieriegud, 2018) and service standards (Lopez-Carreiro, Monzon, Lopez, &
Lopez-Lambas, 2020) of EVs also come into question. Some researchers (Jittrapirom et al., 2017; Sochor et al., 2015) emphasize that as part of mobility packages, low and zero emission mobility (e.g., human-powered micro-mobility:
cycling, scootering, and walking) should dominate.
Based on context analysis, the themes selected for the analysis of scenarios (S1-S2) are automation (theme A), shared mobility (B), electri- fication (C), as well as urban mobility problems to solve: road congestion (D), social attitude (E) and GHG emissions (F).
3.2. Scenario analysing and building
S0 Synthetisation: Researchers predicted two to four different urban mobility scenarios, allowing us to identify a total of 52 scenarios.
Names of authors and basic features (a. Date of publication, b. Method- ology applied and c. Geographical scope) of the papers, as well as the list of scenarios and their timespan are shown in Table 2.
d. Similarity: only low correlation is detected between some of the scenario-based papers (Table 3). P6 and P16 are bibliographically coupled since they cite P5 in common. P5 and P7 are co-cited since they are cited by P6. P5 and P10 are co-cited since they are cited by P16. In the absence of significant overlaps, a reason for exclusion cannot be identified, therefore, 52 scenarios are analyzed in the next phase (S1).
S1 Thematic scenario analysis: interpretation of evaluation values related to themes identified in Context analysis (R4A) can be seen in Fig. 3.
In line with this, the evaluation of each theme in each scenario was carried out. Table 4 presents the results. The number of squares repre- sents the values of xji evaluation parameters.
Changes related to automation (A) and shared mobility (B) seem to be the drivers of alterations in future mobility: there are scenarios in which a distinction may be made by the expected level of automation (A) if the total score is relatively high (equal to or above the median of 12) and scores for sharing mobility (B) is above the average. Scenarios
with an overall lower value (below 12) show the same pattern, i.e., the scenarios with the lowest total scores foresee the tangible future without a higher level of automation. This suggests that these are key themes, which may determine the clustering of previously created scenarios into new and more comprehensive ones. In other words, by the study of in- terconnections, values of xCi;xDi; xEi;xFi depend primarily on the alter- ations of xAiand xBi.
S2 Scenario building: Based on S1, four categories may have been distinguished (Table 5).
In scenarios in category I (Xi≤7) researchers (Brenden et al., 2017;
Banister & Hickman, 2013; Fulton, Mason, & Meroux, 2017; Marletto, 2014, 2019; Milakis, Snelder, van Arem, van Wee, & de Almeida Cor- reia, 2017; Shergold, Lyons, & Hubers, 2015; Zmud et al., 2013; Zmud, Phleps, & Ecola, 2014) forecast potential realities without AVs and predict almost the same state of vehicle ownership and road transport dominance as nowadays, (xBi = 1). This is attached to lack of im- provements in terms of the level of congestion (xDi =1)and environ- mental problems (xFi =1). Only a slight further development and spread of electric vehicles can be detected in these scenarios. These scenarios predict potential future urban mobility in Europe, some of them particularly in the Netherlands (Milakis et al., 2017), Sweden (Brenden et al., 2017), Norway (Julsrud & Uteng, 2015) and outside Europe (Asia – Banister & Hickman, 2013; in the United States – Fulton et al., 2017;
Zmud et al., 2014)). In sum, this is the category of a traditional transport system with no significant changes, hereinafter it is named scenario Grumpy old transport.
Scenarios in category II (8≤Xj≤11) describe a minimal trans- formative change (i.e., a slow or moderate reduction of existing urban transport problems) (Banister & Hickman, 2013; Brenden et al., 2017;
Fulton et al., 2017; Kane & Whitehead, 2017; Shergold et al., 2015;
Zmud et al., 2013; Zmud et al., 2014); Julsrud & Uteng, 2015; Rohr et al., 2016). In addition, a moderate development of automation (xAi =2)and spreading of sharing are expected. The geographical scope of slow transition scenarios is mainly Europe, but some scenarios refer to Asia (Zmud et al., 2013; Banister & Hickman, 2013) and the United States (Fulton et al., 2017; Zmud et al., 2014)). This is the category of a traditional transport system with a moderate or slow transition towards automation and shared vehicle use, hereinafter this is the scenario At an easy pace.
Reducing the number of privately used vehicles plays a key role in scenarios in category III (12≤Xj≤14) (Banister & Hickman, 2013;
Ecola, Zmud, Gu, Phleps, & Feige, 2016; Julsrud & Uteng, 2015; Kane &
Whitehead, 2017; Kaufmann & Ravalet, 2016; Keseru et al., 2019; Rohr et al., 2016; Shergold et al., 2015; Schippl et al., 2016). The increasing role of shared mobility (xBi =3) is predicted. Shared mobility scenarios are considered for Europe and, in two cases, Asia (China – Ecola et al.,
Table 3
S0 – Reference-reference matrix of scenario-based papers.
P1 P2 P3 P4 P5 P6 P7 P8 P9 P10 P11 P12 P13 P14 P15 P16
P1 0 0 0 0 0 0 0 0 0 0 0 0 0 0 0
P2 0 0 0 0 0 0 0 0 0 0 0 0 0 0 0
P3 0 0 0 0 0 0 0 0 0 0 0 0 0 0 0
P4 0 0 0 0 0 0 0 0 0 0 0 0 0 0 0
P5 0 0 0 0 1 0 0 0 0 0 0 0 0 0 1
P6 0 0 0 0 0 0 0 0 0 0 0 0 0 0 0
P7 0 0 0 0 0 1 0 0 0 0 0 0 0 0 0
P8 0 0 0 0 0 0 0 0 0 0 0 0 0 0 0
P9 0 0 0 0 0 0 0 0 0 0 0 0 0 0 0
P10 0 0 0 0 0 0 0 0 0 0 0 0 0 0 1
P11 1 0 0 0 0 0 0 0 0 1 0 0 0 0 0
P12 0 0 0 0 0 0 0 0 0 0 0 0 0 0 0
P13 0 0 0 0 0 0 0 0 0 0 0 1 0 0 0
P14 0 0 0 0 0 0 0 0 0 0 0 0 0 0 0
P15 0 0 0 0 0 0 0 0 0 0 0 0 0 0 0
P16 0 0 0 0 0 0 0 0 0 0 0 0 0 0 0
2016; India – Banister & Hickman, 2013). Most researchers analyse the role of automation in the context of shared mobility, but some scholars (Ecola et al., 2016; Keseru, Coosemans, & Macharis, 2019) predict un- changed levels of automation (xAi =1). Social attitudes are slightly or largely changing (2≤xEi ≤3). In other words, this is the category with a vision of a radical shift towards sharing mobility with a low penetration of automation, hereinafter this is the scenario Mine is yours.
Scenarios in category IV (15≤Xj≤18) forecast a highly advanced system. The two main characteristics are the prominent role of high automation and shared mobility (xAi =3; xBi =3)(Brenden et al., 2017;
Banister & Hickman, 2013; Fulton et al., 2017; Marletto, 2019; Milakis et al., 2017); Rohr et al., 2016). These visions provide a largely changed picture of future mobility as, due to the emergence of electric pro- pulsions (2≤xCi ≤3), automation and sharing, environmental problems are widely resolved (2≤xFi ≤3). Alongside Europe and Asia (Banister &
Hickman, 2013), a vision for Australia has also appeared (Kane &
Whitehead, 2017). This is the vision of the dominance of sharing-based transport solutions with a high level of automation, hereinafter this is the scenario Tech-eager mobility.
3.3. General characteristics of scenarios
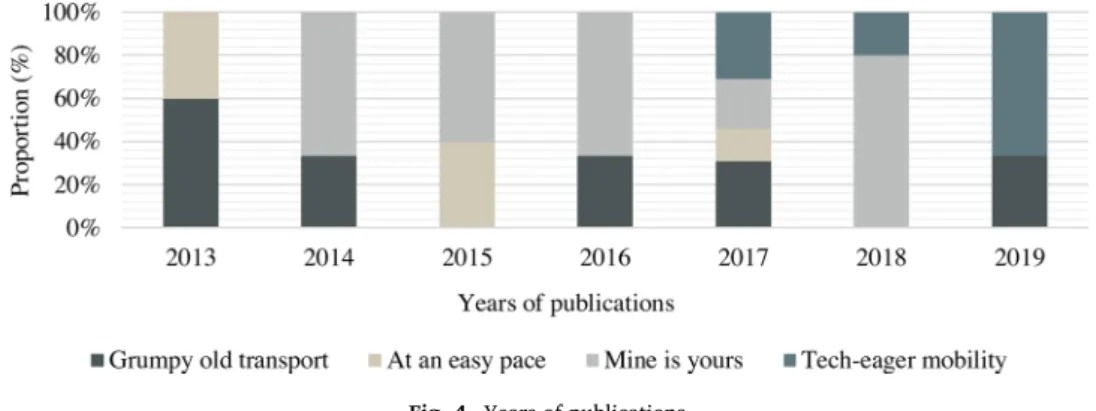
The proportion in terms of the number of existing scenarios included of the scenarios formulated indicates their relevance: ‘Mine is yours’ shows 35 %, ‘Grumpy old transport’ 19 %, ‘Tech-eager mobility’ 17 % and ‘At an easy pace’ 29 %. Although the analysis is merely qualitative, shared mobility is suggested to shape urban mobility transition in the future. However, the proportion of scenario ‘Grumpy old transport’ is also significant whilst forecasting no transformative changes.
The period analysed in the existing scenarios is diverse, therefore, the uncertainty of predictions regarding tangible future (the 2030s) is relatively high. Among the scenarios for 2030, the proportion of sce- narios formulated presents minimal alteration. The dominance of ‘Mine is yours’ remains remarkable (35 % of the visions belong to this group), but the importance of ‘Grumpy old transport’ declines to 18 %, and the proportion of ‘Tech-Eager mobility’ is slightly higher (18 %).
Publication dates of scenarios are summarized in Fig. 4. Over the last few years, a remarkable shift in findings can be seen. The results show that the role of the scenarios supporting the ‘Grumpy old transport’
future was greater in the earlier publications than after 2016. Scenarios forecasting future potentials of shared mobility is nearly equally rele- vant in the analysed years. Visions related to ‘Tech-eager mobility’ only appear in post-2016 literature.
3.4. Description of scenarios
The scenarios formulated are described in terms of mobility
challenges and socio-economic issues, as follows.
3.4.1. Grumpy old transport
The Grumpy old transport scenario forecasts an urban transport system very similar to the current one, in which the use of privately- owned cars is the most conventional way of private mobility (Banister
& Hickman, 2013; Milakis et al., 2017; Zmud et al., 2014). Shared
mobility services are attractive only to a narrow segment (Fulton et al., 2017; Julsrud & Uteng, 2015)). The dominant groups are generation Y and Z, and the use of shared services is not expected to become wide- spread (Brenden et al., 2017; Marletto, 2014, 2019). Even with auto- mation developments, no breakthrough is expected, and the sale of vehicles at the current automation level (SAE 2 or 3) remains constant (Fulton et al., 2017; Zmud et al., 2013)).
3.4.1.1. Challenges in transport.Due to private car ownership, the level of vehicle kilometers travelled increases, and overcrowded roads continue to be a common issue (Banister & Hickman, 2013; Milakis et al., 2017; Zmud et al., 2014). The ‘ever-increasing’ presence of private cars contributes to congestion, whilst inadequate infrastructure and obsolete mobility services (public transport with no serious innovation) make passenger transport difficult in larger cities. The basic capacity of the urban transport system is further strained by urbanization processes (Milakis et al., 2017). Due to excessive traffic, the burden on the envi- ronment caused by industry continues to grow (Marletto, 2014, 2019). If this scenario is realised, the contribution of the transport sector to environmental pollution will be challenging.
3.4.1.2. Socio-economic factors. In general, slow transition is mainly due to consumer behaviour. Travellers prefer convenience-oriented ways of fulfilling mobility needs (Fulton et al., 2017)). Comfortable, seamless mobility, even with the negative effects of congestion, seems to be dependent on using cars (Brenden et al., 2017; Zmud et al., 2013).
Individual car ownership is consistently regarded as a status symbol in many countries, and travellers consider shared mobility as a useful possibility only until they can afford to own a car (Fulton et al., 2017);
Milakis et al., 2017). Lack of communication between stakeholders and decreasing ‘coopetition’ are typical. Due to consumers’ reluctance, the government and transport companies do not see any major benefits from the rapid improvement of mobility services. Progressive legislation and supportive policies are lacking, so the rise of any innovative mobility solutions is dismissed; automation is available for only the elite class (Fulton et al., 2017; Zmud et al., 2013)).
3.4.2. At an easy pace
In this scenario, some moderate changes can be detected. Although the dominant transport mode remains privately-owned cars (com- plemented by public transport) (Brenden et al., 2017; Zmud et al., Fig. 3.Scenario analysing and building method – Phase S1.
2013), progress towards change in vehicle propulsion varies. The role of EVs is increasing significantly, but, at the same time, the role of shared mobility is improving slowly (Kane & Whitehead, 2017; Shergold et al., 2015). Further, the spread of automation is slow, and faster develop- ment is expected only in the USA (Fulton et al., 2017; Zmud et al., 2014)), China and Japan (Fulton et al., 2017); Banister & Hickman, 2013). Due to excessive use of cars, environmental and traffic problems remain serious and unsolved.
3.4.2.1. Challenges in transport. Transport problems continue to be
significant, but some measures strive to reduce their impacts. Zone re- strictions are introduced to mitigate congestion in urban traffic. Some forms of employment, such as flexitime, home-office and the emergence of home-based positions are able to reduce the amount of travel required. This would also result in a slight reduction in congestion (Banister & Hickman, 2013; Zmud et al., 2013). Due to the increase in the use of EVs, GHG emissions are less likely to increase (Brenden et al., 2017; Julsrud & Uteng, 2015).
3.4.2.2. Socio-economic impacts.Leading players in industry are still the oil companies and car manufacturers (Zmud et al., 2013, 2014). The market share of electric and self-driving car manufacturers is expected to grow (Fulton et al., 2017; Rohr et al., 2016)). Willingness to change mobility habits is increasing, but not explicitly towards sustainable modes. Due to general improvement in living standards, more and more people can afford to buy a car (Julsrud & Uteng, 2015; Shergold et al., 2015). The need for comfortable and meaningful travel is growing, other options are used only when there is no alternative.
3.4.3. Mine is yours
In this scenario, major changes may be predicted. The sharing-based economy business model has immense market-shaping power (Julsrud
& Uteng, 2015; Schippl et al., 2016). The role of shared mobility dom- inates transport modes. Further, the spread of EVs and the decline of the manufacture of vehicles with traditional propulsion are typical (Kauf- mann & Ravalet, 2016; Keseru et al., 2019). The large-scale develop- ment of automation does not appear. Shared mobility and EVs reduce some traffic problems and the negative impact of transport on envi- ronment is diminished (Ecola et al., 2016; Shergold et al., 2015).
3.4.3.1. Challenges in transport. The increase of shared mobility reduces transport problems (Julsrud & Uteng, 2015; Schippl et al., 2016). In addition, other modes, such as public transport, cycling and walking are integrated, enabling door-to-door travel. The importance of alternative micro-mobility vehicles (e.g., e-bikes and e-scooters) is also increasing (Ecola et al., 2016; India – Banister & Hickman, 2013). To establish high-quality and integrated solutions, significant developments in rail and public transport services are needed (Kane & Whitehead, 2017;
Rohr et al., 2016). The role of private cars has hugely decreased. To minimize carbon emissions, urban traffic is shaped by strong regula- tions: car-free areas as well as zero-emission zones are created (Ecola et al., 2016; Shergold et al., 2015).
3.4.3.2. Socio-economic impacts. A significant proportion of commuters uses shared vehicles; however, the role of public transport is further reinforced (Ecola et al., 2016; Keseru et al., 2019). This can be achieved through major infrastructure and service improvements (for instance, by the implementation of MaaS). In addition to traditional industry players, car-sharing and ride-sourcing companies become more powerful and the role of producers of EVs is growing, whilst oil company penetration is minimized (Ecola et al., 2016; Kane & Whitehead, 2017). Users accept the alterations, prefer sharing economy solutions; they become open to new mobility options, and less and less eager to owning cars (Banister &
Hickman, 2013; Julsrud & Uteng, 2015). Consequently, several auto- motive companies may leave the market. The environmental con- sciousness of the whole of society increases, resulting in a decreased need for mobility (Kane & Whitehead, 2017; Shergold et al., 2015). Due to strong individualization and flexible employment, the boundaries between private life and work disappear, but this benefits the transport sector. Travellers can reduce travel demand to decrease travel time and costs, and this attitude can greatly relieve the already optimized trans- port system (Ecola et al., 2016; Kaufmann & Ravalet, 2016; Keseru et al., 2019).
Table 4
Evaluation of scenarios by themes.
i Scenario xji Xi
A B C D E F Σ
18 Individual transition pathway 1 1 1 1 1 1 6
36 Scenario 1 1 1 1 1 1 1 6
15 Auto-city 1 1 1 1 1 1 6
31 Valanov 1 1 1 1 1 1 6
39 Fuelled and Freewheeling 1 1 1 1 1 1 6
44 BAU - Limited intervention 1 1 1 1 1 1 6
25 Same same but different 1 1 2 1 1 1 7
21 AV in demand 1 1 2 1 1 1 7
40 BAU 1 2 1 1 1 1 7
50 Controlled mobility 1 1 2 1 1 1 7
22 AV in doubt 2 1 2 1 1 1 8
23 AV in standby 2 1 1 1 1 2 8
32 Home ties 2 1 1 1 2 1 8
4 Sub-optimal scenario A 2 1 1 1 2 2 9
8 Ultramobility 2 1 1 1 2 2 9
45 The 2R Scenario: Electrification and
Automation 2 1 2 2 1 1 9
51 Technopolis 2 1 1 1 2 2 9
1 The great reset 2 1 2 2 1 2 10
34 Gimme Shelter 2 1 1 2 2 2 10
38 No Free Lunch 2 1 2 1 2 2 10
48 Live Local 2 1 1 2 2 2 10
26 Follow the path 2 1 2 2 2 2 11
29 Waterberg 2 1 2 2 2 2 11
33 Communal Call-out 2 1 2 2 2 2 11
35 Home alone and Wired 1 3 1 2 3 2 12
11 Slow is beautiful 1 3 1 2 3 2 12
9 Altermobility 1 3 1 3 2 2 12
41 Scenario 1—Lower Carbon Emissions
Motor Vehicles 2030 2 1 2 2 2 2 11
10 Proxymobility 1 3 1 3 2 3 13
16 Eco-city 1 3 3 2 2 2 13
27 Sharing is the new black 1 3 2 2 3 2 13
37 Scenario 2 1 3 3 2 2 2 13
42 Scenario 2—Increased Active Travel
2030 1 3 3 2 2 2 13
17 Electri-city 1 3 3 2 2 3 14
30 Viga 1 3 3 2 2 3 14
6 Sub-optimal scenario C 1 3 3 2 2 3 14
19 Shared Transition pathway 1 3 3 2 3 2 14
2 Slowing but growing 1 3 2 3 2 3 14
12 Data world 1 3 3 2 2 3 14
52 Shared mobility 1 3 2 2 3 3 14
13 Digital nomads 3 3 2 2 3 2 15
28 What you need is what you get 3 3 3 2 2 2 15 43 Scenario 3—Towards Sustainable
Transport 2030 1 3 3 3 3 3 16
46 The 3R Scenario: Adding Shared
Mobility 3 3 2 2 3 3 16
47 Driving Ahead 3 3 2 3 2 2 15
49 Digital Divide 3 3 2 2 3 3 16
3 Wild card - Low probability 3 3 2 3 3 3 17
5 Sub-optimal scenario B 3 3 3 2 3 3 17
14 Minimum Carbon 3 3 3 3 3 3 18
24 AV in bloom 3 3 3 3 3 3 18
7 Sub-optimal scenario D 3 3 3 3 3 3 18
20 Smart transition pathway 3 3 3 3 3 3 18
Legend: xji =1 current stage without relevant changes, 2 moderate changes, 3 significant changes.
3.4.4. Tech-eager mobility
This scenario predicts the most intense transition. Technological advances affect the transport process as well as travel behaviour. Ve- hicles with a high level of automation will have become widely avail- able. AVs and EVs go hand-in-hand; both technologies are highly advanced, strengthening each other’s market position (Marletto, 2019;
Milakis et al., 2017). However, public transport remains one of the most effective means of transport. Transport is completely environmental-friendly and traffic problems are minimized owing to shared and autonomous vehicles (Brenden et al., 2017; Milakis et al., 2017).
3.4.4.1. Challenges in transport. Although AVs are widespread, trans- port is predicted more likely to be mixed in the near future when con- ventional and autonomous vehicles run on the same road at the same time (Marletto, 2019; Milakis et al., 2017). AVs are connected, resulting in optimised traffic flow, travel time and minimised congestion. Even though total kilometers travelled increase, the transport infrastructure is not overloaded, as a consequence of the shared use of AVs (Brenden et al., 2017; Milakis et al., 2017). In addition, the role of public transport remains significant, although its importance is somewhat reduced as a consequence of shared mobility services, especially in last-kilometer travel. Even if travellers use AVs in a non-sharing form, the number of cars per household is also likely to decline, as only one AV can meet the needs of a whole family (Banister & Hickman, 2013; Fulton et al., 2017;
Rohr et al., 2016). The spreading of AVs may also contribute to land use change. As less parking space is needed, current parking lots can be used for other purposes (e.g., green areas, non-motorized transport modes).
Pedestrian traffic has also increasing importance due to the reorgani- zation of the infrastructure (Rohr et al., 2016; Kane & Whitehead, 2017).
As a consequence, the impact of transport on the environment is reduced.
3.4.4.2. Socio-economic factors. The market is dominated by EV and AV manufacturers and sharing companies in cooperation with public transport (Marletto, 2019; Milakis et al., 2017). Supportive policies allow the smooth application of technology. Changes predicted have the greatest impact on travel behaviour. Travellers switch to low emission mobility forms; they are less likely to own cars and even be licensed drivers (Brenden et al., 2017; Fulton et al., 2017)). They appreciate in- tegrated and ICT-based mobility solutions (MaaS applications, e-ticket- ing, real-time information, etc.). Moreover, the productivity of travellers is increased using AVs (Fulton et al., 2017; Kane & Whitehead, 2017;
Rohr et al., 2016)). The divide between private and professional spheres could be blurred; employees can work from anywhere without wasting time driving a car (Marletto, 2019; Milakis et al., 2017). Overall optimal time control reduces the need for fast transport, which can positively influence users’ perception of each transport mode.
4. Conclusion
In this paper, the methods and outcomes of a literature review con- cerning the tangible future (until the 2030s) of urban mobility are summarized. With a systematic literature review, employing 10 key- words and 8 search engines, 62 recently published papers discussing the emerging trends and the innovations of the future of urban mobility have been analysed. In sum, 52 scenarios outlining the possible future state of mobility have been identified and evaluated by a complex method. Based on the context analysis, a multi-criteria scenario analysis with six themes (role of automation, sharing mobility, electric vehicles, congestions, GHG emissions and social attitudes) that, according to the literature, significantly affect the future paths of urban mobility, has been applied. On this basis, answers to the research questions posed in the Introduction are as follows:
Table 5
Identification of categories based on evaluation values.
No. Aggregated
evaluation value Evaluation value xji Description
j =A j =
B j =C j =D j =E j =F
I 6≤Xi≤7 1 1 ≤2 1 1 1 Most of the themes indicate a constant state, except Electrification (C), which may indicate a slight advance.
II 8≤Xi≤11 2 1 ≤2 ≤2 ≤2 ≤2 A slight development of Automation (A) is foreseen in each case, without changes in Sharing mobility (B). No significant changes are foreseen in other themes (at least one of them indicate moderate changes).
III 12≤Xi≤14 1 3 2≤C≤3 2≤C≤3 2≤C≤3 2≤C≤3 Automation (A) indicates no development, while Sharing mobility (B) is going to highly dominate. Other themes indicate some development, incl. the value of 3 in one or two of them.
IV 15≤Xi≤18 3 3 2≤C≤3 2≤C≤3 3 2≤C≤3 Automation (A), Shared mobility (B) and Social attitude (E) indicate significant changes in each case and one or two further themes promise moderate changes.
Legend: A =Automation, B =Shared mobility, C =Electric vehicles, D =Congestion, E =Social attitude, F =GHG emission.
Fig. 4.Years of publications.