Identification of Risks to the Achievement of Climate Neutrality Targets – in Order to Audit the Riskiest Branches of the Hungarian
Economy
GYULA PULAY PH.D
ASSOCIATE PROFESSOR
UNIVERSITY OF MISKOLC e-mail: szvpulay@uni-miskolc.hu
SUMMARY
Reducing greenhouse gas (GHG) emissions, considered to be the main cause of global warming, is one of the greatest challenges of our time. The implementation of new practices is assisted by the supreme audit institutions, among them the State Audit Office of Hungary, with advice based on their audits. Auditing is effective when it is carried out in the areas most at risk of failing the objective. The SAO's experts have developed a method for identifying the branches of the national economy the most at risk in terms of reducing GHG emissions. The essence of this method, the developed logical probability model and the results of the calculations are presented in this article.
Keywords: Climate change, mitigation of GHG emission, risk identification, auditing, logical probability model JEL codes: C4 E6 F64 Q54
DOI: http://dx.doi.org/10.18096/TMP.2021.03.07
I NTRODUCTION
In line with the aim of the European Union, the Hungarian Parliament set the achievement of carbon neutrality by 2050 in Act 44 of 2020 on Climate Protection. To this end, greenhouse gas (GHG) emissions should be reduced to 50 percent of 1990 emissions by 2030. The State Audit Office of Hungary (SAO), as the main financial and economic audit body of the Parliament, tries to help achieve the goal set by the Parliament through its audits. The first step is to identify those sectors of the economy where GHG emissions need to be significantly reduced, as the failure to do so poses a serious risk to meeting the national target. As a second step, it is expedient to focus the SAO's audits on the GHG emission reduction programs of the sectors of the national economy that are considered to be at risk This article presents the risk identification method developed for this purpose and its results found. The method can be widely used, as reducing GHG emissions is a vital task for every country, so it is important to identify the risks that threaten the achievement of this goal.
S UMMARY OF THE L ITERATURE U SED
One of the most widely used methods of climate protection research and official analysis is risk assessment. The risks associated with global warming can be divided into two major groups: The first is the 'mitigation risk', i.e. the inadequate reduction of greenhouse gas emissions. The second is the
"adaptation risk," which means that humanity, individual communities, the economy among others cannot adapt to warming temperatures which cause severe ecological damage. The literature on climate risks deals with the latter to a greater extent. However, the topic of this article is related to the mitigation risk.
Mitigation in the climate change context refers to actions aimed at the reduction of greenhouse gas emissions relative to baseline case. The importance of climate change risk assessments is recognized by the United Nations Framework Convention on Climate Change (UNFCCC) which underlines the importance of evidence-based risk assessment to guide public policy (Adger et al, 2018.)
Given that the fight against global warming requires international cooperation, it is appropriate that the risks associated with this issue be analysed in accordance with an internationally agreed methodology. In order to standardize risk assessment at a national level, the European Commission has published Guidelines (European Commission, 2010).
In this article, we use the terminology of these Guidelines. This is also justified as EU regulations on climate protection set mandatory requirements for Member States.
Our research, on which this article is based, aims to identify mitigation risks in climate protection in order to focus the SAO’s audits on the most significant risks.
According to the Guidelines, risk identification is “the process of finding, recognizing and describing risks. It is a screening exercise and serves as a preliminary step for the subsequent risk analysis stage.” (European Commission, 2010. p. 20.)
There is a century-old tradition of risk assessment in auditing. “The idea of the inevitability of audit risk in the context of achieving a balance between the benefits associated with its presence and the costs, expressed in Dicksee (1904). …. This, in turn, initiated systematic scientific research aimed at understanding the essence, structure and key characteristics of the risks associated with the implementation of the professional function of the auditor.” (Arzhenovskíj et al 2019. p. 74.)
“The fundamental question during the identification of risks, i.e. “Which are the possible events the effects of which can threaten goals?” remains unchanged. In this case, however, “goal” is not construed to mean an organisation’s goals, rather, in broader terms, the basic social expectation of the compliant and efficient utilisation of public funds … Where analysis involves a population (e.g. central subsystem institutions, partnerships, private individuals) with a great number of elements, the key goal of risk analysis is to sort the elements according to the specified risk criteria, i.e. to establish a kind of risk “ranking” in the interest of selecting the riskiest elements.” (Domokos et al 2015.
p. 11.)
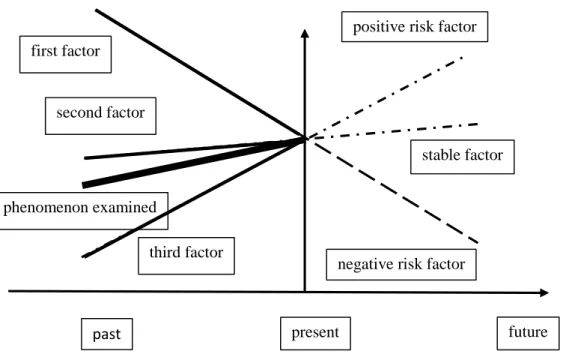
To explore risk factors in more detail, audit experts began to apply the decomposition or breakdown method. The essence of this is to break down the studied phenomenon (process) into factors (sub- processes) and to examine how (positively or negatively) and with what weight these factors influenced the process itself in the past. We then extrapolate the future development of the sub- processes and, on this basis, determine how the main process itself would develop, if the past sub-processes were to continue. (See Figure 1.) Instead of the technical projection, we can develop different scenarios for the expected evolution of the sub-processes and assign different probabilities to their occurrence.
Source: Based on Pulay - Simon (2020) p. 35., own edited
Figure 1. Risk identification of processes by breaking down the process into factors (sub-processes) Of course, it does matter how the breakdown into
factors (sub-processes) takes place. A practical way to
do this is to use a logical probability model. Each step of this model is outlined in Figure 2.
past present future
positive risk factor
stable factor
negative risk factor phenomenon examined
first factor second factor
third factor
Source: Arzhenovskíj et al (2019) p 82.
Figure 2. Steps of the logical probability model
● The starting step is to outline the logical structure of the studied phenomenon (task). The essence of this step is to explore the nature of the relationship between the factors that have a significant impact on the given process: for example, their impacts add up or multiply.
● During the formalization of the logical model of the process, it is expedient to graphically represent the process, indicating the relationship among the factors, the nature of the relationship, and their impacts on the process.
● In the third step, we assign probabilities to the revealed impacts, i.e., estimate the probability that these impacts will occur. We can primarily use the data of the previous period for the estimation, but we can also use expert estimates.
● In the fourth step, we use the logical model to determine the mathematical function by which the impacts and their probabilities can be summed and to calculate the degree of risk. The probabilities estimated in the third step can be modified somewhat, and by substituting these into the logic model, sensitivity tests can be performed.
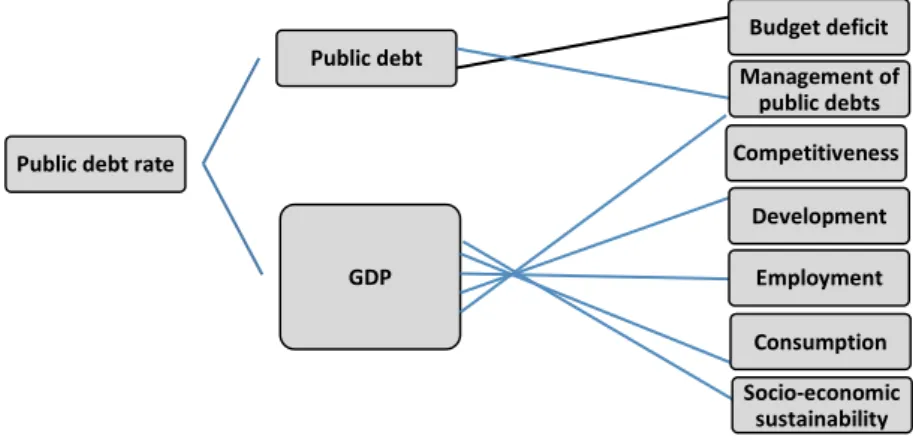
The logical probability model was applied by the SAO to assess the risks threatening the fulfilment of the public debt rule. The essence of this rule is that the Hungarian public debt rate, which is the ratio of public debt to GDP, must decrease from year to year until it reaches the level of 50 percent. It is clear that both public debt and GDP are affected by a number of factors, which is why the SAO analysts divided the risk of non-compliance with the government debt rule into factors. Through this decomposition, they were able to assess one by one the expected evolution of the factors influencing the numerator or the denominator, as well as the likely impact of each factor on the public debt rate. As a logical probability model, the SAO analysts adapted the value-tree model developed by the international consultancy company McKinsey’s researchers for evaluating corporate property (Copeland at al, 1994) to the public debt risk assessment. The first part of the model is presented by Figure 3. The value tree developed by the SAO has an additional branch, so a total of 21 factors were examined for impact during the risk assessment.
Source: Domokos – Pulay (2020) p. 40
Figure 3. The logic probability (value-tree) model for the risk assessment of the public debt rule From the SAO’s audit aspect the breakdown to
factors is important because it is likely to reach risk factors the audit of which belongs to SAO’s competence. For instance, from factors indicated in Figure 3, SAOI is mandated to audit – and actually
does so regularly – the management of public debts or the implementation of employment programmes. By using the presented risk assessment method, the SAO was able to identify a number of negative and positive Public debt rate
Public debt Budget deficit
Management of public debts
GDP
Competitiveness Development
Employment Consumption Socio-economic
sustainability
risks. (See: Pulay – Simon 2020 and Domokos – Pulay 2020).
T HE A PPLICATION OF THE L OGIC P ROBABILITY M ODEL FOR THE
I DENTIFICATION OF R ISKS TO THE
A CHIEVEMENT OF C LIMATE N EUTRALITY T ARGETS
The aim of the research was to identify those branches of the national economy whose expected GHG emissions jeopardize the achievement of the 2030 greenhouse gas emission reduction national target. This risk identification not only provides information for decision-makers, but also provides guidance to the SAO in which sectors of the national economy to audit GHG emission reduction programs. Obviously, it is advisable to audit where the risk is high.
The National Energy and Climate Plan (NECP) of Hungary worked out and published by the Ministry of Innovation and Technology determines the target of reducing GHG emissions until 2030, demanding a 40 per cent reduction in GHG emissions until 2030 compared to the 1990 level. In order to reach the target set by the NECP, domestic GHG emissions should be reduced by an additional 15.7 per cent of the GHG emissions of 1990 until 2030, compared to 2018, since in 2018, Hungarian GHG emissions accounted for 84.3 per cent of the 1990 level. Considering the involuntary reduction in GHG emissions in 2020 (exact data are not known yet), it is realistic to expect that a one per cent reduction in GHG emission per year should be achieved from 2021 to 2030 on average.
Is there a risk that Hungarian GHG emissions will not reach this level? Based on the evolution of greenhouse gas emissions between 1990 and 2018, as shown in Figure 4, we must say a resounding yes as a reply to this question. .
Source: edited by author based on data HCSO STADAT 5. 3. 2
Figure 4. GHG emissions from manufacturing activities in 1990-2018 (thousand tons of carbon dioxide equivalents)
After 1990, we can observe two decreasing sections in the diagram. First in the period 1990-1992, factories of the heavy industry. that had earlier been the largest emitters, were closed causing the economy to decline, and as a result, GHG emissions dropped dramatically.
From 1993 to 2008, GHG emissions stagnated with some fluctuations, then the financial crisis of 2008 hat broke out and triggered a decreasing period of several years. However, that was followed by a period of rise, when GHG emissions increased with the economic expansion.
The figures indicate that, in spite of the improving numbers, it is a realistic risk that in the case of dynamic economic growth, the improving trend of GHG emissions might be broken, or at least will not reach the desired value. The occurrence of this risk depends on a number of factors. One such factor is economic growth itself which is accompanied by an increase in GHG emissions, unless GHG emissions per unit of
production decrease at a similar rate. The latter is therefore another significant factor.
It may be reasonable to break down the total GHG emissions of the economy into GHG emissions within individual branches of the economy. This is justified by the fact that the GHG emissions of the individual branches of the national economy are fairly different in both volumes and tendencies. That is t there is a risk that in spite of a general declining trend, individual branches of the national economy might see a growth in their GHG emissions, making the commitment of national level impossible to fulfil.
T HE L OGICAL P ROBABILITY
M ODEL U SED FOR C LIMATE R ISK
I DENTIFICATION
The main process in our risk identification is the GHG emission at the national level, and we identify risk factors by breaking them down to sub-processes. The sub-processes are the GHG emissions of individual branches of the national economy, which are further divided into two factors: One of the factors is production in the given branch of the national economy, and the other is the GHG emission per one unit of production (specific GHG emission). Reduction in GHG emissions is hindered by two factors: first, technological development and the transformation of the product mix do not result in the desired reduction in specific emission. Secondly, the volume of production grows dynamically, therefore the actual GHG emission may increase (or decrease less than required), even if the specific GHG emission is significantly reduced.
These are two completely different risks in their nature, therefore we should manage them separately.
In the calculations, the main process is measured in the quantity of GHG emission expressed in CO2
equivalents (hereinafter: K). The process is considered risky when GHG emission does not drop to the required level between two examined dates. The required level is α. (In the case of a 10 per cent required reduction α=0.9). Specifying the risk in a formula, we can say that the risk occurs when the following inequality is not satisfied:
(1) Kt < α ×K0
Placing the branches of the national economy into formula (1), we receive the following formula:
(2) ∑Kti < α ×∑K0i
where Kti is the volume of the GHG emission of the i-th branch of the national economy at time t,
K 0i is the volume of the GHG emission of the i-th
branch of the national economy at time 0.
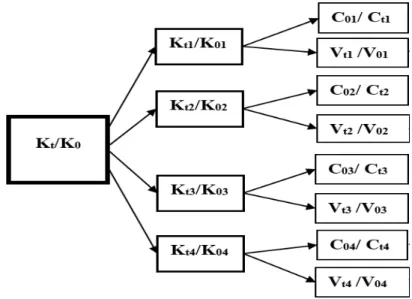
GHG emissions of national economy level can be broken down to the production in individual branches of the national economy (the added value created there) and the specific GHG emission of manufacturing (GHG emission of one unit of production). Following the breakdown to factors, the inequality in formula (2) is as follows:
(3) ∑Cti×Vti < α×∑ C0i×V0i
where
V0i is the added value of the i-th branch of the national economy at time 0,
Vti is the added value of the i-th branch of the national economy at time t,
C0i is the volume of the specific GHG emission of the i-th branch of the national economy at time 0,
Cti is the volume of the specific GHG emission of the i-th branch of the national economy at time t.
The model of breaking down to factors (for four branches of the national economy) is shown in Figure 5.
Source: own edited
Figure 5: Logical probability model of breaking down national GHG emissions to factors
I DENTIFICATION OF THE R ISK
The above model allows us to identify those branches of the national economy that involve risks as regards GHG emissions, and, as a result, audit may focus on these branches. Considering the changes in the GHG
economy over time as sub-processes, processes where the extent of reduction does not reach the required rate can be identified as processes carrying negative risks.
Expressed in a formula:
(4) C0i×V0i /Cti×Vti > α After rearranging:
(5) C0i×V0i /Cti×Vti /α > 1
Now we shall use this method to analyse the following: in the case of a dynamic economic growth, the expected emissions of which branches of the national economy would present a risk factor for the achievement of the national objective.
Considering the above points, we identified the key question of our risk analysis as follows: In which branches of the national economy will the expected GHG emissions present a risk to Hungary’s ability to reach the target set by the NECP for 2030 in the reduction of GHG emissions during a dynamic growth in the economy? The annual average reduction of one percent was considered a risk criterion. With this in mind, in order to identify the risks, we formulated the following question: in which branch of the national economy is there a risk that the reduction of GHG emissions will not reach 1 per cent on an annual average by 2030.
The previously mentioned risk assessment guidelines issued by the European Commission states that “risk identification should be based as much as possible on quantitative (historical, statistical) data.”
(European Commission, 2010. p. 20.) Following this instruction, we examined whether the GHG emissions of individual branches of the national economy reached the 1 per cent reduction on average in the five-year
period between 2013 and 2018. The GHG emissions of branches not reaching the five percent decline over the five-year period analysed, are considered as risky from the aspect of reaching the target set for 2030.
Consequently, in formula (5), α should be replaced by 5.
Calculations according to formula (5) were performed with the data of each branch. In terms of inequality (5), branches where the calculation yielded a value greater than 1 were considered risky.
Data used for the research: The Hungarian Central Statistical Office (HCSO) publishes GHG emission data in a breakdown according to the branches of the national economy, too, and this allows us to examine this phenomenon in the depth of individual branches, based on official data.
T HE R ESULTS
Figure 6 shows how the indicator metering the reaching of the GHG emission target developed in the individual branches of the national economy in 2013- 2018. Branches that achieved values below 1 satisfied the one per cent annual GHG emission reduction rate.
However, the GHG emissions of national economy branches characterised by values over 1 present risks to the objectives of reducing GHG emissions.
Source: own edited based on own calculations
Figure 6. Results of the calculations by branches of the national economy The figure shows that until 2018, seven branches of
the national economy managed to reduce emissions by 5 per cent compared to the base value of 2013. These branches of the national economy accounted for 38.1%
of the emissions at the national level in 2018. Among the branches that did not reach the targets, four branches of the national economy achieved extremely
high values (over 1.40), while six branches had values between 1.10 and 1.40. Three branches of the national economy were close to reaching the target, as their indicators were 1.10 or lower.
The risk analysis confirmed that changes in the GHG emissions of individual branches of the national economy in a dynamic growth period project both
negative and positive risks regarding the question whether Hungary is able to achieve the GHG emission reduction target set in the NECP by 2030, assuming a dynamic economic growth. However, from the aspect of reaching the target, it is alarming that among national economy branches that were well below the annual average one per cent reduction in GHG emissions in 2013-2018 (their indicator was over 1.10), we found four branches that had their specific GHG emissions among the six highest values. At the same time, it is a positive risk that in the branch of “Electric energy”, which has the highest specific emission, the requirement of reducing the GHG emission by one per cent in a year was met between 2013 and 2018. It is also favourable, that the “Water supply” branch, which has the second highest specific emission, was only slightly below the required value.
T HE USE OF OUR RESEARCH RESULTS FOR AUDIT PURPOSES
From the audit point of view, it does matter whether a branch of the national economy has proven to be risky because its specific GHG emissions have fallen less than desired or because its production growth rate has been above average. Since the SAO can formulate proposals for reducing GHG emissions, but it is not expedient to make recommendations for curbing production.
Consequently, it is useful to arrange risky branches of the national economy into groups, based on the question whether their risks are the consequences of their over-the-average economic growth or the slower reduction in their specific GHG emissions, or both.
When defining the principles of this grouping, we use the national objective of reducing GHG emissions as the basis. Placing the specific GHG emission and the volume of production into formula (1), we get the following formula:
(6) C t × Vt < α × V0 × C0
where V0 = GDP of the base year V t = GDP of year t
C0 = specific GHG emission in the base year Ct = specific GHG emission of year t
After rearranging the formula, we get the following inequality:
(7) Ct / C0 < α ×V0 / Vt
If we specify the rate of economic growth in the period between years 0 and t, we can calculate the value of Ct / C0 too, i.e. we can define the minimum reduction in specific GHG emissions that would make sure that GHG emissions do not exceed the required level. Along this logic, it can be identified as a risk originating from the insufficient rate of reduction in GHG emissions that the reduction in the specific GHG emission of the given branch of the national economy did not reach the rate of Ct / C0, i.e.
(8) Ct / C0 < Cti/ C0i
It is a risk originating from the dynamic economic growth of a given branch of the national economy when the growth rate of production in a branch of the national economy exceeds the national average growth rate, i.e.:
(9) Vti/ V0i > Vt / V0
It may also happen that these two risks occur at the same time, and there will be risk-free branches in the national economy, too.
We performed these calculations based on the facts that in 2013-2018 the growth rate was 14.5%. With this growth, specific GHG emission had to fall to 83.05 per cent of the 2013 value to achieve a five per cent reduction in the GHG emission in five years.
We identified the risk of dynamic economic growth in those branches of the national economy where growth exceeded the average rate, and we found the risk of slow specific improvement in branches where the improvement did not reach the above value. In certain branches, both risks occurred. The results of the calculations are summarised in Table 1.
Table 1
Classification of the branches of the national economy into risk groups Specific emission reduction
below the expected level Specific emission reduction above the expected level
Economic growth below average
Risk of slow specific improvement:
Manufacturing industry Water supply Transportation Public administration
Education Human
No risk Inf. comm.
Real estate business Miscellaneous
Economic growth above average
Risk (double):
Agriculture Construction industry
Trade Administrative
Culture Household activities
Risk of dynamic economic growth:
Mining Electric energy
Hospitality Finance Science, technology Source: own edited
The table contains - in italics - those branches of the national economy, too, that were not qualified as risky in the calculations, as this does not exclude the possibility that they carry some risks in one of the two risk factors. In the case of the “Education” branch of the national economy, the rate of specific emission did not reach the expected level, so GHG emission remained under the required level because of the relatively low rate of economic growth. This fact includes the risk that in the case of a faster economic growth, the GHG emission of the “Education” branch of the national economy will also exceed the required level.
Among the branches qualified as risky in the calculations, altogether two branches of the national economy were identified in which it was not possible to reduce emissions to the required level only because of their growth exceeding the average growth dynamics
of the economy. This draws attention to the fact that in the dynamic growth period of the Hungarian economy, the major risk factor was not dynamic growth, either, but the fact that it was not coupled with the expected decrease in specific GHG emission. This is clearly indicated by the fact that from the 13 branches qualified as risky, the risk of “specific emission reduction being below the expected level” was identified in the case of 11 branches. This proves that there is still room for improvement, and an audit carried out by the SAO may discover the conditions that hindered the necessary reduction in specific GHG emissions in several branches of the national economy.
The risk-based selection of audit areas is important for audit offices, as in principle they are able to achieve the highest added value by analysing the riskiest areas.
The risk-based selection is supported by the risk tree, which is shown in Figure 7.
Source: own edited
Figure 7. Risk tree for the selection of the focus areas of the auditing of reductions in GHG emissions Figure 7 follows the logical model of breaking
down GHG emissions into factors. The figure shows the seven branches we found the riskiest in our calculations, in a sequence of their risk indicators. The list differs from the sequence presented in Figure 6 as we omitted those branches of the economy where GHG emissions in 2018 were lower than one per cent of the GHG emissions of the whole national economy. The risk of dynamic economic growth is marked in grey and the risk of slow improvement of specific emission is marked in black. (The relevant information can be found in Table 1) The use of the colour grey is justified by the fact that dynamic growth in itself cannot be considered as a risk from an audit point of view, as it would be hardly reasonable to submit a proposal to slow down growth. Audit should focus on those branches of the national economy where the risk is
generated by the slow improvement in specific GHG emissions. In these cases, the audit may inquire whether the given branches of the national economy have taken the measures and worked out the programmes required for a significant improvement in specific GHG emissions, and whether they have established the framework of the successful and efficient implementation of these programmes, and whether they monitor implementation.
As a summary, we can say that the risk tree is like a fruit tree, where harvest should start with the fruits on the highest branch. In the case of the risk tree, the black box of the highest branch means the area of the highest risk, and as we go down, we may select additional areas marked with black blocks that should be in the focus of audits.
REFERENCES
ADGER,W.N.–BROWN,I.– SURMINSKI,S. (2018): Advances in risk assessment for climate change adaptation policy rsta.royalsocietypublishing.org Downloaded from https://royalsocietypublishing.org/ on 20 September Philosophical Transactions
National:
1,10
Administrative 1,72
Construction: 1,68
Manufacturing: 1,42
C: 1,32 V: 1,24 C: 1,24
V: 1,29 C:1,19
V: 1,13 C: 0,98 V: 1,19 C: 0,97
V: 1,17 C: 0,97
V: 1,14 C: 0,71 V: 1,52
Trade: 1,23
Agriculture: 1,19
Transportation: 1,16
Mining: 1,14
ARZHENOVSKIY, S.V.– BAKHTEEV,A.V. – SINYAVSKAYA,T.G.– HAHONOVA, N.N. (2019): Audit Risk Assessment Model International Journal of Economics and Business Administration Volume VII, Special Issue 1, 2019. pp. 74-85
COPELAND,T.–KOLLER,T–MURRIN,J. (1994): Valuation: Measuring and Managing the Value of Companies, Second Edition, by, published by John Wiley & Sons, New York.
DICKSEE,L.R. (1904): Auditing: Practical Manual for Auditors. 6th edn. Gee & Company.
DOMOKOS,L.–NYÉKI,M.–JAKOVÁC,K.–NÉMETH,ERZSÉBET–HATVANI,CSABA (2015): Risk Analysis and Risk Management in the Public Sector and in Public Auditing
DOMOKOS, L. – PULAY, GY (2020): Sustainable Budget and the Sustainability Appearing in the Budget Public Finance Quarterly 2020/2. special edition (p. 25-56.) https://doi.org/10.35551/PFQ_2020_s_2_2
EUROPEANCOMMISSION (2010): Risk Assessment and Mapping Guidelines for Disaster Management, Commission Staff Working Paper Brussels
HUNGARIAN CENTRAL STATISTICAL OFFICE (2020): 5.3.2. Nemzetgazdasági ágak és háztartások üvegházhatású gáz-kibocsátása. (Greenhouse gas emissions of industries and households)
http://www.ksh.hu/docs/hun/xstadat/xstadat_eves/i_ua025d.html
MINISTRYOFINNOVATIONANDTECHNOLOGY of HUNGARY (2020): Nemzeti Energia- és Klímaterv (National Energy and Climate Plan)
https://ec.europa.eu/energy/sites/ener/files/documents/hu_final_necp_main_hu.pdf
PULAY,GY.–SIMON,J. (2020): Measuring the Macroeconomic Performance of Public Finance Management Public Finance Quarterly 2020/special edition (p. 23-43.) https://doi.org/10.35551/PFQ_2020_s_1_2