Adaptive Coding of Face Identity in the Human Visual Cortex
Dissertation submitted for the degree of Doctor of Philosophy
Petra Hermann Scientific advisor:
Prof. Zoltán Vidnyánszky, Ph.D., D.Sc .
Roska Tamás Doctoral School of Sciences and Technology Faculty of Information Technology and Bionics
Pázmány Péter Catholic University
Budapest, 2015
[1]; [2];
[3]; [4];
;[5]; [6]; [7];
[8]; [9]; [10]; [11]; [12]; [13]; [14]; [15]
“Because I am always interested in faces. I just want you to sit down and look at the human face. But if there is too much going on in the background, if the face moves too much, if you can’t see the eyes, if the lighting is too artistic, the face is lost.”
(Ingmar Bergman)
Acknowledgements
I would like to express my gratitude for those who accompanied me during my exciting journey. First of all, I would like to say thanks to my supervisor, Prof. Zoltán Vidnyánszky, for his support and careful guidance throughout my study and research. Zoli, your attitude to scientific thinking and writing makes you a role model for me. I am especially grateful for your trust in me, your attention, patience and impatience as well. I gladly remember our personal discourses about Hantai (“Hantás”). Thank you.
Hereby I also acknowledge the collaborative work and help of Prof. Gyula Kovács. Gyula, I am particularly thankful to you for the time that I could spend in your lab of Jena.
I am also very grateful to the Doctoral School, especially to Prof. Tamás Roska and Prof.
Péter Szolgay for providing the opportunity to spend my PhD years in a multi-disciplinary environment. I am indebted to Prof. József Hámori for his attention and for sharing his educational experiences and abundant knowledge of science and art with me.
I am tremendously thankful to my close tutor colleagues, Éva Bankó, Viktor Gál, István Kóbor, and Béla Weiss, for their help, inspiring discussions, and useful advice. Éva, I cannot express enough my gratitude for your invaluable scientific and friendly support that I received from you from my first time in the lab. I am very glad that I found a tutor and friend in you.
Viktor, your grandiose knowledge in MRI methods impressed me and I learned from you that humor is essential in research. Thank you for letting me be part of the “Viktor milieu”, and thank you for your friendship.
I am indebted to Anita Deák and Beatrix Lábadi from the Institute of Psychology of the University of Pécs for encouraging me to take the first steps. Anita, I feel enormously grateful to you that I could be part of the fMRI Research Group in Pécs. Thank you for tutoring me and still being my genuine friend up to this day.
Very special thanks to all my fellow PhD students and colleauges in our lab, especially to Balázs Knakker, Vanda Nemes, Pál Vakli, Petra Kovács, Gergely Drótos, Regina Meszlényi, Ádám Kettinger, Máté Kiss, Emese Maróti, Krisztián Buza, and Annamária Manga for all their help, productive discussions and for the everyday lunch. Balázs, we took our first steps in this journey together, sometimes we felt lost, but we could lean on each other and continue our
ride. I am very grateful for your continuous scientific and emotional support, and also for our deep conversations. Thank you for being by my side in trouble too. I am privileged to have such a companion and friend.
I would like to thank my two opponents, István Hernádi and Lajos Kozák, for evaluating my dissertation and their relevant questions and valuable suggestions contributing to the finalization of this work.
I would also like to thank Gábor Rudas, the director of the MR Research Center of the Semmelweis University, for the opportunity to conduct the measurements and the wonderful atmosphere.
I owe a lot to Katinka Vida Tivadarné for her help in all the administrative issues. Katinka néni, I am very grateful for your genuine humanity and limitless patience. I am very pleased to know you. I am also very thankful to Viktória Sifter from the Library.
I would like to say thanks to all of my friends for accepting me and being so patient and supportive and giving me new energy to move on during my busy days. Thank you all for your friendship.
I say thanks to Prof. Zsuzsa Hetényi for encouraging and guiding me along the paths of Nabokov. I am especially thankful to Ágnes Juhász for guiding me along my own paths.
I am also grateful to Dvořak, Brahms, and the experimental minimal techno artists, especially to S Olbricht for inspiring me with their music. I owe special thanks to Zoltán Nagy from Zürich for involving me in the AntiNode shows.
Last but not least, I am most grateful to my Mother and Father who have helped me tremendously in every possible way so that I could focus on research. Anya, thank you for being the source of continuous, limitless, unconditional support for me. Thank you for believing in me all the time, especially when I could not.
Thank you!
Contents
Summary of abbreviations ... ix
1 Introduction ... 1
1.1 Motivations ... 1
1.2 How faces are special ... 1
1.3 The fusiform face area (FFA) and its role in face perception ... 2
1.4 Re-entrant mechanisms in the visual system ... 3
1.5 Predictive coding model of sensory information processing ... 4
1.6 Goals of the dissertation ... 5
1.7 Methods ... 5
1.7.1 Task-based fMRI method ... 6
1.7.2 Intrinsic functional connectivity fMRI method ... 6
1.7.3 Combined fMRI and psychophysics methods ... 7
2 Neural basis of identity information extraction from noisy face images ... 9
2.1 Introduction ... 9
2.2 Materials and Methods ... 10
2.2.1 Subjects ... 10
2.2.2 Psychophysics experiment ... 10
2.3 fMRI experiment ... 11
2.3.1 fMRI scanning ... 12
2.3.2 fMRI data analysis ... 12
2.3.3 Correlation analysis ... 15
2.4 Results ... 15
2.4.1 Behavioral results ... 15
2.4.2 Results of the whole-brain analysis ... 16
2.4.3 Relationship between behavior and fMRI responses to noisy faces ... 17
2.4.4 Results of the intrinsic functional connectivity analysis ... 19
2.5 Discussion ... 21
3 The relationship between repetition suppression and face perception ... 25
3.1 Introduction ... 25
3.2 Materials and methods ... 26
3.2.1 Subjects ... 26
3.2.2 Psychophysics experiment ... 27
3.2.3 fMRI experiment ...28
3.2.4 fMRI scanning ...30
3.2.5 fMRI data analysis ...30
3.2.6 Statistical analysis ...32
3.3 Results ...33
3.3.1 Behavioral results ...33
3.3.2 fMRI adaptation ...33
3.3.3 Correlation of face discrimination accuracy and fMRIa ...35
3.3.4 Correlation of fMRIa among the FFA, OFA, and EBA ...36
3.4 Discussion ...37
4 Conclusions and possible applications ...43
5 Summary ...47
5.1 New scientific results ...47
6 References ...53
Summary of abbreviations
Abbreviation Concept
3AFC three-alternative forced-choice
AAL automated anatomical labeling
ALOI amsterdam library of objects images
AltB alternation block
AltT alternation trial
ANOVA analysis of variance
aSTS-FA anterior superior temporal sulcus face area ATL-FA anterior temporal lobe face area
BOLD blood oxygenation level-dependent
CI confidence interval
CRT cathode ray tube
D distance
DCM dynamic causal modelling
DCT discrete cosine transform
DLP digital light processing
EBA extrastriate body area
EEG electroencephalography
EPI echo planar imaging
FC functional connectivity
FDR false discovery rate
FFA fusiform face area
FG fusiform gyrus
FIE face inversion effect
fMRI functional magnetic resonance imaging
fMRIa functional magnetic resonance imaging adaptation
FWHM full width at half maximum
Abbreviation Concept
FOV field of view
GLM general linear model
GRE-EPI gradient-echo echo-planar imaging
HRF hemodynamic response function
ICBM international consortium for brain mapping
IF intact faces or inverted faces
IFG-FA inferior frontal gyrus face area
IIR infinite impulse response
IPS in-plane switching
IT inferior temporal cortex
LCD liquid-crystal display
LFP local field potential
LO or LOC lateral occipital cortex
MNI montreal neurological institute
MOG middle occipital gyrus
MPRAGE magnetization-prepared rapid gradient-echo
MT+ visual motion area
NF noisy faces
NO number of outliers
O objects
OFA occipital face area
PC predictive coding
PCA principal component analysis
PPI psychophysiological interaction
pSTS-FA posterior superior temporal sulcus face area
RepB repetition block
RepT repetition trial
ROI region of interest
Summary of abbreviations xi
Abbreviation Concept
RS repetition suppression
rsFC resting-state functional connectivity
rsfMRI resting-state functional magnetic resonance imaging
SD standard deviation
SEM standard error of the mean
SENSE sensitivity encoding
SPM statistical parametric mapping
STS superior temporal sulcus
TE echo time
TFE turbo field echo
TR repetition time
UF upright faces
1 Introduction
1.1 Motivations
Face perception is one of the most important functions of the human visual system. Faces convey the majority of socially relevant information, therefore the ability to process faces is essential for normal social functioning. Extensive experimental and modelling research has made significant progress in identifying the neural basis of the remarkably efficient and seemingly effortless face perception in humans. However, the majority of these results might have limited interpretability since they are based on research involving faces that were clear and isolated. On the contrary, in the natural environment, faces occur often under low visibility conditions and/or in rapid succession, thus well-functioning, optimized processing system is needed to enable successful face perception. Uncovering the neural mechanisms underlying face perception in a more realistic context is not only invaluable for a better insight into how visual system works but also could facilitate the development of more efficient training programs on face perception. Furthermore, it could form the basis of more reliable machine-based face recognition algorithms which is a key issue in computer vision.
1.2 How faces are special
The very rich information that is crucial for intact social interaction such as a person’s identity, age, gender, expression is conveyed by the face rendering it as a stimulus of exquisite importance. Converging behavioral, neuropsychological, and neuroimaging evidence suggests that faces constitute a special class of visual stimuli with dedicated processing mechanisms that differ from that of other non-face objects (for reviews, see [16, 17]). The most reliable cognitive marker of face-specific processing is the behavioral face inversion effect (FIE, [18]), i.e. the larger drop in performance for faces than for non-face objects due to stimulus inversion (turning the stimulus upside down). Also, accuracy at discriminating individual face parts is higher when they are presented in the context of a face than when presented in isolation, whereas the same holistic advantage is not found for parts of other kinds of stimuli [19]. The double dissociation between face and object processing is known from the neuropsychological literature: patients with prosopagnosia are unable to recognize previously familiar faces, despite a largely preserved ability to recognize objects [20], whereas patients with object- agnosia are seriously impaired in recognizing non-face objects with the spared ability to recognize faces [21]. These results suggest that face perception depends on different neural
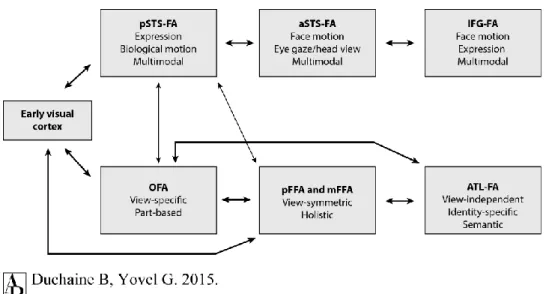
processes than those underlying other types of object stimuli. Face-selective areas that were found in the human extrastriate cortex (for reviews, see [16, 22]) might provide the neural substrate for such processes (Fig. 1.1).
Figure 1.1. Revised framework for the roles and connections between face-selective areas. The ventral face-processing pathway consists of the occipital face area (OFA), the fusiform face area (FFA), and the anterior temporal lobe face area (ATL-FA), whereas the dorsal face-processing pathway comprises the posterior superior temporal sulcus face area (pSTS-FA), the anterior superior temporal sulcus face area (aSTS-FA), and the inferior frontal gyrus face area (IFG-FA). (Taken from [16].)
1.3 The fusiform face area (FFA) and its role in face perception
Neuroimaging studies demonstrated that faces elicit robust and selective responses in regions of the human occipital and temporal cortex [23–30] with considerably high reproducibility and reliability in the fusiform gyrus [31]. The region in the mid-fusiform gyrus that consistently shows significantly greater response to faces than to non-face objects has become known as fusiform face area (FFA) [24]. As a central part of the ventral face-processing pathway it has been shown to represent structural, especially temporally invariant properties of faces largely contributing to identity computations [22, 32–36]. The FFA is thought to subserve face perception, since its activity measured with BOLD fMRI was found to be strongly correlated with detection and identification of face images [37–39], and also with the behavioral face inversion effect [40]. However, in these studies face perception was investigated using intact face images, presented without any contextual information. On the contrary, faces that we encounter in real life are often poorly visible due to suboptimal viewing conditions such as insufficient illumination, odd poses etc., and thus their recognition becomes more effortful. In addition, in the majority of social interactions more than two people are engaged and thus it
Re-entrant mechanisms in the visual system 3
can dynamically change whose face is in the focus of our attention. To provide efficient communication flow through reacting rapidly and accurately, the visual system must optimize its processing mechanisms under these challenging conditions. An unresolved question is whether FFA maintains its pivotal role in face perception even when face images are noisy or embedded in a temporal context where faces occur in rapid succession.
1.4 Re-entrant mechanisms in the visual system
From a brief glance at a face, we are able to effortlessly assess a person’s identity, gender, age, emotional state, and several other characteristics despite the tremendous variation in viewing parameters. This impressive ability of the visual system is mediated by the coordinated computational function of cortical areas involved in face perception [41–44]. Experimental and modeling results suggest that face perception entails an initial, fast categorization of the visual stimulus as a face via rapid feedforward computations along the ventral visual processing stream [45–53] that culminate in a powerful neural face representation in the FFA [30, 54–57]. This early global and coarse face representation is subsequently refined through a re-entrant neural processing loop between the FFA and lower-level visual cortical areas of the inferior and lateral occipital cortex depending on stimulus and task properties [54, 55, 58–61].
It has been suggested [62, 63] that under low visibility conditions the visual system must recruit additional resources to handle the noisy and deteriorated visual image via re-entrant processing mechanisms involving the shape-sensitive lateral occipital cortex (LOC, [64]).
Furthermore, when the visual system is put into a continuously changing environment where faces occur in a temporal context, based on short-term prior experience, iterative recurrent mechanisms might help re-estimate and update predictions about sensory input (the same or a different face will be seen), maximizing the efficiency of neural processing, which is supported by the predictive coding model of perception [65–68] (Fig. 1.2). Such processes were suggested to be involved within the core face-processing network composed of the FFA and the occipital face area (OFA, [69]) of the inferior occipital cortex in a DCM study by Ewbank et al. [70]. In sum, the visual system is able to adapt to the challenging conditions of the current environment and provide an accurate perception by optimizing its function, presumably engaging a re-entrant processing loop between higher- and lower-level visual cortical areas. However, the exact neural mechanisms and their relationship to behavior are not yet understood.
Figure 1.2. One specific example of a recurrent neural network model is the predictive coding model developed by Friston [67]. According to this theory, the brain entails a hierarchical generative model that is used to predict sensory or lower level input. The predictions of the generative model are adjusted at each hierarchical level until the prediction errors between sensory inputs and predictions are minimized. This prediction error minimization process is mediated by forward driving connections, delivering prediction errors (light arrows) from an earlier area to a higher area, and (modulatory) backward connections (dark arrows) that build context-sensitive predictions. (Taken from [71].)
1.5 Predictive coding model of sensory information processing
Predictive coding (PC) theories [65–68] (see [72] for a recent review) consider the brain as an inference engine that actively generates and optimizes probabilistic representations of what caused its sensory input, which results in efficient neuronal information processing. In this framework, one can understand the process of perception as the resolution of sensory prediction errors, by changing top-down predictions about the causes of sensory input (Fig.
1.2). Intuitively, the predictions descending along the cortical processing hierarchy via strong feedback connections are compared against sampled sensory inputs in each hierarchical level of the sensory cortex. The ensuing prediction errors are then passed up the hierarchy to optimize expectations and subsequent predictions identifying the most likely causes of sensory inputs. When the incoming sensory input is noisy, the ascending prediction error will be very imprecise leading to an inaccurate representation and uncertain perceptual decisions [73, 74].
In this case the sensory system must engage additional prediction error minimization processes involving lower-level sensory regions implicated in the processing of low-level high- resolution stimulus features to “explain away” sensory evidence in higher-level regions.
However, the direct empirical evidence for such processes is still scarce.
Goals of the dissertation 5
Based on the fact that in real life, the perceptual context tends to be highly stable across short time-scales, prediction is considered to be a fundamental feature of sensory processing in the sense that the initial presentation of the stimulus induces an expectation of that same stimulus reappearing in the near future (for experimental evidence see [75]), maximizing the efficacy of neuronal coding. As a consequence, when a sensory stimulus is repeated, the prediction error is reduced more rapidly as the whole hierarchy settles into a representation of that stimulus, leading to the repetition suppression (RS) of the evoked neural activity [67]. Thus, RS reflects the flexibility of the sensory system and its ability to adjust to continuously changing requirements, optimizing the performance of the individual. Despite the intense effort that has been made to investigate the behavioral advantage of this phenomenon [76–82], the direct link between RS and perceptual ability is not known as of today.
1.6 Goals of the dissertation
The dissertation focuses on how visual cortical processing of faces is affected by the deterioration of image quality and prior perceptual experience. In particular, the research was aimed at:
uncovering the re-entrant neural processes that enable the extraction of identity information under challenging conditions when face images are deteriorated and noisy.
revealing the contribution of short-term face adaptation processes mediating the effect of prior experience to face perception.
1.7 Methods
To investigate the above questions, we used traditional task-based and resting-state functional connectivity functional magnetic resonance imaging (fMRI) methods combined with psychophysics. The fMRI is based on the blood oxygenation level-dependent (BOLD) method [83] reflecting signal intensity variations due to blood oxygenation, blood flow, and blood volume changes concomitant with an increase in brain activation. The BOLD fMRI signal, therefore, is a relative and indirect measure of neural activity, which has been shown to strongly correlate with the local field potential (LFP), i.e. a mass neural signal reflecting a multitude of neural processes, including synaptic potentials, afterpotentials of somatodendritic spikes and voltage-gated membrane oscillations [84]. Thus, the BOLD signal in a given brain region is affected by the input of a given cortical area, its local intracortical processing,
including the activity of excitatory and inhibitory interneurons as well as by the activity of neuromodulatory pathways. Over the past decades, fMRI has emerged as the most popular neuroimaging technique used in cognitive neuroscience to study human brain functions. The major advantages of fMRI as compared to other neuroimaging techniques are: non- invasiveness, relatively high spatiotemporal resolution (spatial resolution: 2-3 mm; temporal resolution: 1-3 s) and its capacity to investigate the entire network of brain areas essentially at once either during a particular task or during rest.
1.7.1 Task-based fMRI method
In a standard task-related fMRI analysis experimental factors are manipulated and a general linear model (GLM) is used to identify areas where the activation level associated with one task condition is significantly different from the activation level associated with the other. The contrast between task conditions is carried out separately on the time series for each voxel, which yields a map of contiguous clusters of activated voxels (i.e. statistical parametric maps) forming a set of regions of interest (ROIs) that are assumed to play an important role in generating behavior. A clear dissociation in the foci of activation observed under different task conditions provides strong support for dissociable neural and cognitive mechanisms. In addition, this analysis helps to identify regions that can be used as seeds for more sophisticated subsequent analyses such as for a task-related ROI analysis or an ROI-based intrinsic functional connectivity analysis.
ROI analysis is commonly used to examine activity within a set of functionally coherent voxels, in order to investigate their sensitivity to some other manipulation [85]. This approach is most prevalent in fMRI studies of visual processing, where separate localizers are used to identify functionally specific regions (e.g. voxels in the fusiform gyrus that are more responsive to faces than other objects) for each individual given the large interindividual variability observed in their location in the ventral occipitotemporal cortex [30]. The ROI- based analysis is restricted to voxels of prior interest and, in most cases it involves a univariate amplitude estimation procedure using the GLM approach to examine their response to different task conditions.
1.7.2 Intrinsic functional connectivity fMRI method
The intrinsic functional connectivity fMRI technique has emerged as a powerful non-invasive tool for studying large-scale, spatially distributed networks of the human brain. This method relies on the observation that in the absence of any task, spatially distant regions of cortex exhibit highly correlated spontaneous low-frequency (< 0.1 Hz) fluctuations in their BOLD
Methods 7
signal [86] (see [87] for a review). Resting-state networks are posited to reflect intrinsic representations of functional systems commonly implicated in cognitive function: it has been demonstrated that functional connectivity patterns observed at rest closely correspond to those elicited by more traditional task-based paradigms or derived directly from task data [86, 88–
92]. Moreover, growing evidence shows that intrinsic functional connectivity is highly related to task-induced activity [93, 94] and also cognitive ability [95–103] providing support that measuring resting-state connectivity (rsFC) is a useful tool for investigating functionally relevant interactions between cortical areas. One of the most widely adopted method for computing statistical interdependence between brain regions is the univariate seed- or ROI- based functional connectivity analysis where rsFC is represented as a single linear correlation coefficient calculated between 5-15 min time series of a priori ROIs.
1.7.3 Combined fMRI and psychophysics methods
Results of the fMRI experiments demonstrate that a multitude of regions and networks are active during a particular task or rest and show modulation in their activation in a task- or state-dependent manner. Combining fMRI methods with psychophysics, i.e. investigating the relationship between the different fMRI measures (such as task-dependent activity or rsFC) and task performance e.g. by using correlation methods, might provide a more direct and sensitive approach to elucidate the neural mechanisms underlying specific cognitive functions.
Furthermore, using this method we can understand how brain function varies across subjects and how these differences relate to the subjects’ differences in (separately measured) behavioral performance.
2 Neural basis of identity information extraction from noisy face images
2.1 Introduction
Experimental and modeling results suggest that face perception involves an initial, fast categorization of the visual stimulus as a face (e.g. [45–51, 53]) and it is based primarily on the neural processes in a face-sensitive region in the fusiform gyrus, the fusiform face area (FFA, [24]) [30, 54–57]. This coarse face representation subsequently evolves through re- entrant interactions between the FFA and lower-level visual cortical areas of the inferior and lateral occipital cortex [54, 55, 58–61]. Specifically, in the case of phase-randomized face images, it has been suggested [62, 63] that the increased processing demand due to the distorted spatial localization of the facial features might lead to the engagement of a re-entrant processing loop involving the FFA and a region of the lateral occipital cortex (LOC), which represents shape information within a spatial coordinate system [64, 104] and shows increased fMRI responses to noisy face images [62]. However, an important question that remains to be explored is whether it is the FFA or the LOC on whose neural representations the perception of deteriorated and noisy face images is based. Even though combined behavioral and neuroimaging results provided strong evidence for a close link between face perception and the neural processes in the FFA in the case of intact face images [37–40], it has not been investigated whether this holds true also for faces that are noisy and poorly visible.
To address this question, we measured face identity discrimination performance as well as fMRI responses in the FFA and LOC in the cases of both intact and phase-randomized face stimuli. To examine whether the individual differences in the discrimination of the identity of noisy face stimuli are associated with the noise-induced modulation of fMRI responses in the FFA or in the LOC, we computed correlations between these behavioral and neural measures.
Furthermore, based on the suggested role of the re-entrant neural mechanisms in the processing of noisy faces, we predicted that the individual ability to handle stimulus noise might depend on the strength of functional interactions between FFA and LOC. To test this prediction, we estimated the strength of intrinsic functional connectivity between bilateral FFA and LOC using resting-state fMRI [86, 105] (for review, see [87]) and computed correlations between these measures and the face identity discrimination performance for noisy faces.
2.2 Materials and Methods
2.2.1 Subjects
Altogether 26 Caucasian subjects (15 male, 1 left-handed, mean ± SD age: 27 ± 6 years) participated in the experiment and gave informed written consent in accordance with the protocols approved by the ethics committee of Semmelweis University, Budapest, Hungary.
None of them had any history of neurological or psychiatric diseases, and all had normal or corrected-to-normal visual acuity.
2.2.2 Psychophysics experiment
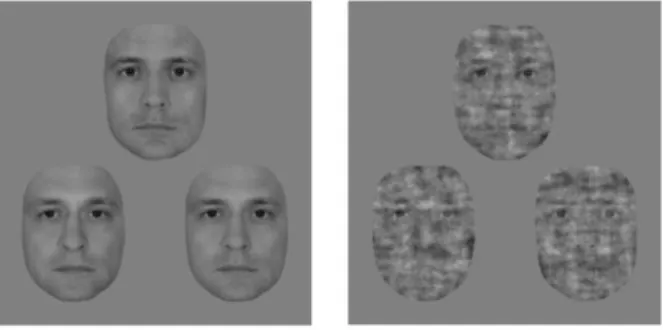
Stimuli. In the psychophysics experiment, trials consisted of triplets of morphed male face images. Front-view grayscale images of male faces with neutral expression were cropped to eliminate external features (hair, etc.) and were equated for luminance and contrast. Triplets were obtained by first pairing two individuals and creating a linear morph continuum using a warping algorithm (JPsychoMorph, [106]). Altogether 78 continua were created from 13 individuals. Triplet members were selected from these continua as follows: face A and C were chosen to be the 20/80% and 80/20% points, respectively, while face B was taken from in between, such that the morph distance between the oddball image (e.g. A) and its neighbor (B) was larger than the distance between the other two images (e.g. B and C). These distances were based on pilot measurements to keep performance within the 65-75% range and they differed between face conditions. The following 2 × 2 conditions were used. Faces with 100%
phase coherence were presented in the intact face condition, and for the noisy face condition the phase coherence was decreased to 45% (55% noise) (see Fig. 2.1). Phase coherence was manipulated using custom-made scripts based on the weighted mean phase technique [107].
Both intact and noisy faces were presented upright and upside-down.
Figure 2.1. Stimuli of the psychophysics experiment. Exemplar face triplet for the intact (left) and the 55% phase noise (right) stimulus condition presented in the 3AFC identity-discrimination task.
fMRI experiment 11
Triplets were displayed at the center of the screen on a uniform gray background in a regular triangular arrangement with 4° eccentricity. Triplets measured ~11° × 12°, faces subtending 4.5° × 6.0° each, and were presented on a 26” LG IPS LCD monitor at a refresh rate of 60 Hz viewed from 50 cm. Stimulus presentation was controlled by MATLAB R2010a (The MathWorks Inc., Natick, MA, USA) using the Psychophysics Toolbox Version 3 (PTB-3) [108, 109] (http://psychtoolbox.org/).
Experimental procedure. In the psychophysics experiment, participants performed a three- alternative forced-choice (3AFC) identity fine-discrimination task. Subjects were required to select the face that differed the most from the other two (i.e. oddball face, either A or C).
Before the experiment, each subject was given a practice session to get familiar with the task.
Each trial began with a cue (1°) appearing just above fixation for 100 ms, indicating the orientation of the upcoming stimuli (upright or inverted). Triplets were presented without a fixation dot under free-viewing conditions until subjects responded, but they were terminated at 5000 ms if no response was made. Trials were separated by an inter-trial interval, which varied randomly between 900 and 1100 ms, with only the fixation dot present. Oddball faces appeared with equal probability in each of the three possible spatial positions. Each unique face triplet was presented only once per condition, randomly assigned to one of the five runs for each participant. Within a single run, the 2 × 2 conditions (intact/noise and upright/inverted) were intermixed and presented in random order. Each participant completed five runs, yielding 65 trials altogether for each condition.
2.3 fMRI experiment
Stimuli. During the block-design fMRI scanning session, images of human faces and common objects were presented. Face stimuli consisted of front-view grayscale photographs of four male faces with neutral, happy, and fearful expressions preprocessed similarly to the images used in the psychophysics experiment. They were presented either with 100% phase coherence (intact face condition) or manipulated by decreasing their phase coherence to 45% (55% noise;
noisy face condition) using the weighted mean phase technique [107]. Object stimuli consisted of grayscale images of three different objects from four categories (cars, mugs, jugs, and fruits) chosen from the Amsterdam Library of Objects Images (ALOI) database [110]. All images were equated for luminance and contrast and presented centrally, subtending 4.5° × 6.0°, on a uniform gray background. Stimuli were projected onto a translucent screen located at the back of the scanner bore using a Panasonic PT-D3500E DLP projector (Matsushita Electric Industrial Co., Ltd., Kadoma, Japan) at a refresh rate of 60 Hz, and they were viewed through a mirror attached to the head coil at a viewing distance of 57 cm. Head motion was
minimized using foam padding. Stimulus presentation was controlled by MATLAB R2010a (The MathWorks Inc., Natick, MA, USA) using the Psychophysics Toolbox Version 3 (PTB- 3) [108, 109] (http://psychtoolbox.org/).
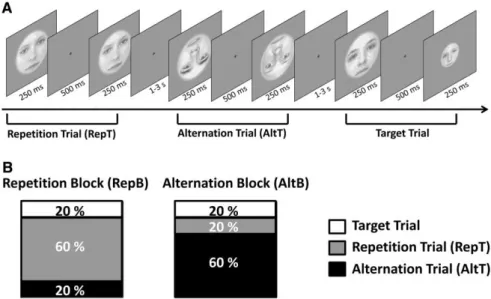
Experimental procedure. The fMRI session included two block-design runs. In each run, 16 s long blocks of intact faces (IF), noisy faces (NF), and objects (O) were interleaved with baseline blocks which contained only a fixation dot. Stimuli were presented for 500 ms with 0.5 Hz frequency. A run consisted of 6 blocks of each stimulus type (IF, NF, and O) and 19 baseline blocks, making a total number of 37 blocks per run, lasting 10 min each. Subjects performed a one-back memory task and reported the total number of one-back repetitions at the end of the run. In addition to the block-design scans, participants performed an 8 min long resting-state run before the experimental runs. They were instructed to lie still, with their eyes closed.
2.3.1 fMRI scanning
Data were collected at the MR Research Center of Szentágothai Knowledge Center (Semmelweis University, Budapest, Hungary) on a 3 Tesla Philips Achieva scanner (Philips Healthcare, Best, the Netherlands) equipped with an 8-channel SENSE head coil. High- resolution anatomical images were acquired for each subject using a T1-weighted 3D TFE sequence (TR = 9.77 ms, TE = 4.6 ms, FOV = 256 mm) yielding images with 1 × 1 × 1 mm resolution. Functional images were collected with a non-interleaved acquisition order covering the whole brain with a BOLD-sensitive T2*-weighted GRE-EPI sequence. For the experimental fMRI, a total of 301 volumes were acquired using 31 transversal slices (4 mm slice thickness with 3.4 mm × 3.4 mm in-plane resolution, TR = 2 s, TE = 30 ms, FOV = 220 mm, acceleration factor = 2), while for the resting-state fMRI, a total of 240 volumes were recorded using 36 transversal slices (4 mm slice thickness with 3 mm × 3 mm in-plane resolution, TR = 2 s, TE = 30 ms, FOV = 240 mm, acceleration factor = 2).
2.3.2 fMRI data analysis
Preprocessing and analysis of the imaging data were performed using the SPM8 toolbox (Wellcome Trust Centre for Neuroimaging, London, UK) and custom MATLAB codes. The functional images were realigned to the first image within a session for motion correction and then spatially smoothed using an 8 mm full width at half maximum (FWHM) Gaussian filter.
The anatomical images were coregistered to the mean functional T2*-weighted images followed by segmentation and normalization to the MNI-152 space using SPM's segmentation
fMRI experiment 13
toolbox. The gray matter mask was used to restrict statistical analysis on the functional files.
To define the regressors for the general linear model analysis of the data, a canonical hemodynamic response function (HRF) was convolved with boxcar functions, representing the onsets of the experimental conditions. Movement-related variance was accounted for by the spatial parameters resulting from the motion correction procedure. A high-pass filter with a cycle-cutoff of 128 s was also implemented in the design to remove low-frequency signals.
The prepared regressors were then fitted to the observed functional time series within the cortical areas defined by the gray matter mask. The resulting individual statistical maps were then transformed to the MNI-152 space using the transformation matrices generated during the normalization of the anatomical images. The estimated beta weights of each regressor served as input for the second-level whole-brain random-effects analysis, treating subjects as random factors. For visualization purposes, the IF > NF and NF > IF contrasts were projected with pFDR < 0.05 threshold onto the smoothed ICBM152 brain [111–113] using BrainNet Viewer [114] (http://www.nitrc.org/projects/bnv/). Stereotaxic coordinates are reported in Montreal Neurological Institute (MNI) space and regional labels were derived using the AAL atlas [115] provided with XjView 8 (http://www.alivelearn.net/xjview8/).
For the resting-state analysis, several other preprocessing steps were applied in addition to the aforementioned standard preprocessing to reduce spurious variance that is unlikely to reflect neural activity in resting-state data. These steps included voxelwise regression of the time course obtained from rigid-body head motion correction, voxelwise regression of the mean time course of whole-brain, ventricle, and white matter blood oxygen level-dependent (BOLD) fluctuations [116]. To retain low-frequency signals only (0.009–0.08 Hz) [117], we used a combination of temporal high-pass (based on the regression of 9th-order discrete cosine transform (DCT) basis set) and low-pass (bi-directional 12th-order Butterworth IIR) filters.
ROI selection for correlation analysis. We conducted correlation analyses for which we determined the individual locations of three regions of interest (ROIs) (FFA, occipital face area (OFA), and LOC) to take the interindividual variability in their locations into account, which is crucial for intersubject correlations. To define them in each hemisphere and in each participant, we located the peak voxel within a region exhibiting a selective response to face (FFA and OFA) and object images (LOC). The locations of FFA and OFA were determined as the areas in the middle fusiform gyrus and inferior occipital gyrus, respectively, responding more strongly to intact faces than to objects. LOC was identified as the area on the lateral surface of the middle occipital cortex showing significantly stronger activation to objects than to intact faces. Peak voxel activity of all ROIs was required to meet a minimum threshold of puncorrected = 0.005. With each ROI, we took the contiguous cluster of significantly activated
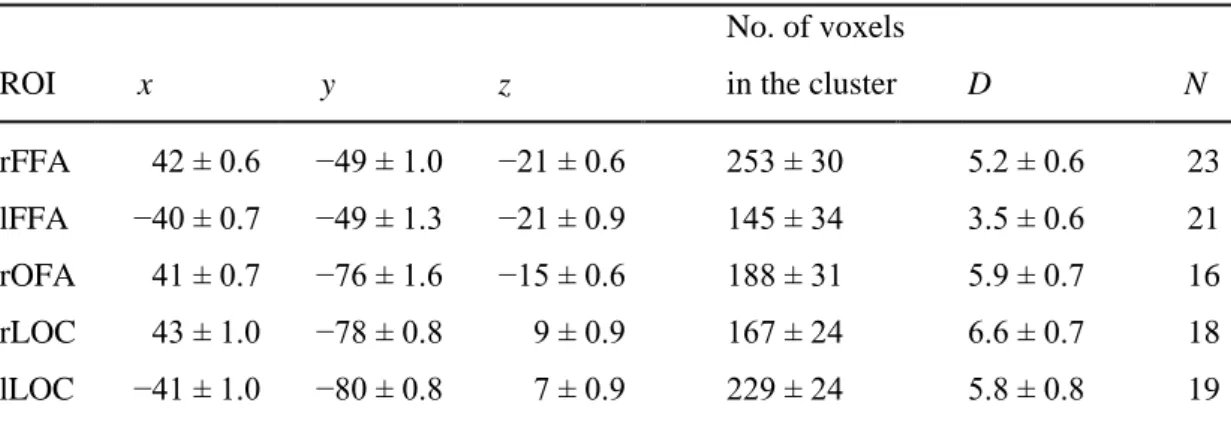
voxels (t(560) > 2) within a 10 mm radius sphere centered at the peak voxel and selected a single voxel showing the highest absolute beta difference in the intact versus noisy faces contrast. We used the beta difference (signed to reflect the direction of the contrast) obtained from this voxel to characterize the magnitude of the noise effect in each region for our correlation analysis. The defined voxel coordinates were then transformed to each subject’s native space. We only included subjects in the analysis for whom we could individually define these ROIs (for details, see Table 2.1).
ROI x y z
No. of voxels
in the cluster D N
rFFA 42 ± 0.6 −49 ± 1.0 −21 ± 0.6 253 ± 30 5.2 ± 0.6 23
lFFA −40 ± 0.7 −49 ± 1.3 −21 ± 0.9 145 ± 34 3.5 ± 0.6 21
rOFA 41 ± 0.7 −76 ± 1.6 −15 ± 0.6 188 ± 31 5.9 ± 0.7 16
rLOC 43 ± 1.0 −78 ± 0.8 9 ± 0.9 167 ± 24 6.6 ± 0.7 18
lLOC −41 ± 1.0 −80 ± 0.8 7 ± 0.9 229 ± 24 5.8 ± 0.8 19
Table 2.1. Peak voxel coordinates for the regions of interest (ROIs). The MNI coordinates (x, y, z in millimeters) of the peak voxels from the IF > O and O < IF contrasts in the case of FFA, OFA, and LOC, respectively. ROIs were defined as the contiguous cluster of significantly activated voxels (t(560) >
2) within a 10 mm radius sphere centered at the given peaks. Please note, that for the correlation analysis the activity of a single voxel showing the largest beta difference in the IF versus NF contrast was chosen. The distance (D) of this voxel from the peak coordinate of each ROI is also shown in millimeters. Provided data are mean ± SEM across participants (N) for whom these regions were individually identifiable. Note that the OFA was reliably definable only in the right hemisphere in the majority of subjects.
For visualization purposes, we generated a probability density map illustrating the spatial distribution of the highest noise effect voxels across participants in the FFA and in the LOC.
The individual normalized binary masks for each ROI were first averaged across subjects to create a voxelwise probability map and then convolved it with a 9 mm Gaussian kernel. The kernel size was chosen based on the average distance between the selected voxels of the participants. The resulting voxel density map was superimposed onto the smoothed ICBM152 brain [111–113] using BrainNet Viewer [114] (http://www.nitrc.org/projects/bnv/).
Functional connectivity analysis. To examine functional connectivity at rest, pairwise linear correlations were calculated using the extracted BOLD time course of the predefined ROIs (i.e. the voxel showing the highest noise-related modulation within the ROI) for each
Results 15
participant. One-sample t tests were performed to determine which regions show reliable resting-state connectivity.
2.3.3 Correlation analysis
To test the behavioral relevance of the noise effect on the fMRI responses, we correlated the individual beta differences in the FFA, OFA, and LOC regions with subjects’ discrimination performance on noisy faces. We conducted a semipartial correlation analysis to partial out the influence of the intact face performance on the noisy face accuracy in order to minimize the confounding effect of individual differences in the efficacy of overall face perception of the participants. Skipped Pearson’s correlation coefficients were calculated with the Robust Correlation Toolbox [118] in MATLAB. Bivariate outliers were detected using an adjusted box-plot rule and removed in the computation of skipped correlations. For correlation coefficients (r), 95% confidence intervals (CI) were calculated based on 10,000 samples with the percentile bootstrap method implemented in the toolbox.
The relationship between individual resting-state functional connectivity coefficients (rsFC strength) and behavioral performance on noisy faces was studied by computing between- subject partial correlations using skipped Pearson’s correlation, eliminating the variance related to efficacy of overall face perception both from the rsFC strength and from the noisy face perception performance. This again served to control for the individual differences in face identity discrimination.
2.4 Results
2.4.1 Behavioral results
The behavioral measures were compared using a two-way repeated-measures ANOVA with within-subject factors of noise (intact vs. noisy face) and inversion (upright vs. inverted face).
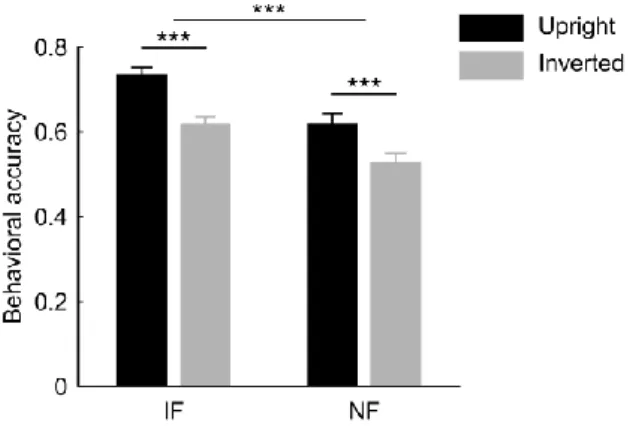
Face identity discrimination performance was significantly better for intact as compared with noisy faces (main effect of noise: F(1,25) = 40.95, p < 0.001). Importantly, however, we found robust face inversion effects (i.e. decreased accuracy for inverted faces) for both the intact and noisy face conditions, which did not differ significantly in magnitude (Fig. 2.2; main effect of inversion: F(1,25) = 72.67, p < 0.001, noise x inversion: F(1,25) = 0.93, p = 0.344). Thus, noisy face discrimination was based on face-specific processes as opposed to discrimination based
on low-level stimulus features. These behavioral findings suggest that the neural mechanisms involved in the processing of noisy faces might be similar to those of faces without noise.
Figure 2.2. Behavioral results. Identity discrimination performance was significantly higher for intact as compared to noisy faces, however face inversion equally impaired accuracy in both cases. Provided data are mean correct response ratio ± SEM across participants (N = 26). Black bars represent data for upright faces; gray bars represent data for inverted faces. IF, intact faces; NF, noisy faces (***p <
0.001).
2.4.2 Results of the whole-brain analysis
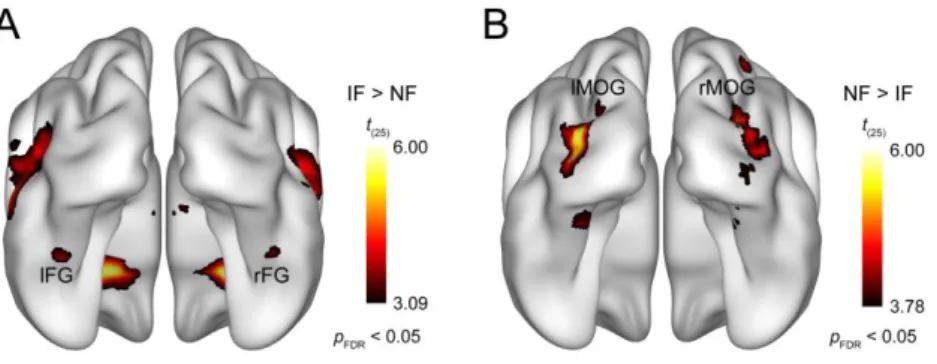
The whole-brain random-effects analysis of fMRI data using a pFDR < 0.05 threshold revealed that the presence of phase noise strongly affected bilateral occipitotemporal cortical processing of face images (Fig. 2.3). To specifically address the questions that we aimed to investigate in the current study, our analysis will be focused on two visual cortical areas: the fusiform gyrus (i.e. FFA) and the middle occipital gyrus (i.e. LOC). Noisy faces relative to intact faces led to decreased activation in the fusiform gyrus bilaterally (Fig. 2.3A; t(25) = 3.83;
x, y, z = 42, −44, −22 and t(25) = 4.14; x, y, z = −40, −42, −20 for the right and left hemisphere, respectively), which is in agreement with studies observing noise-induced attenuation in the FFA responses [119–121]. The MNI coordinates of this noise-induced modulation closely corresponds to the mid-fusiform face-selective region referred to as mFus-faces, also known as FFA-2 [29, 122] (for review, see [123]). In contrast, the results also revealed that there was an increased bilateral activation in the middle occipital gyrus in the noisy compared with the intact face condition (Fig. 2.3B; t(25) = 5.18; x, y, z = 36, −82, 8 and t(25) = 5.71; x, y, z = −34,
−86, 4 for the right and left hemisphere, respectively), which is in accordance with our previous findings [62]. Based on its coordinates, this region appears to be in close correspondence with the shape-selective, retinotopically organized LO2 area introduced by Larsson and Heeger [64], which is part of the LOC.
Results 17
Figure 2.3. Results of the whole-brain random-effects analysis. Bilateral areas of the fusiform gyrus showed significantly lower activation for noisy relative to intact faces (A), while larger responses to noisy than intact faces were found bilaterally in the middle occipital gyrus (B). Statistical maps are displayed with pFDR < 0.05 on the smoothed ICBM152 brain [111–113]. IF, intact faces; NF, noisy faces; lFG, left fusiform gyrus; rFG, right fusiform gyrus; lMOG, left middle occipital gyrus; rMOG, right middle occipital gyrus.
2.4.3 Relationship between behavior and fMRI responses to noisy faces
Participants’ performance in the three-alternative forced-choice identity discrimination task was 73.8 ± 1.7% and 61.9 ± 1.7% (mean ± SEM) in the case of intact and phase-randomized face stimuli, respectively. To investigate the relationship between the noise-induced modulation found in the fMRI responses and individual performance to noisy faces, we conducted a semipartial correlation analysis using the intact face performance as a covariate for the noisy face performance to control for the confounding effect of the overall face perception ability of the participants. Within the individually defined face-selective FFA, OFA, and object-selective LOC we selected a single voxel with the largest absolute beta difference in the intact versus noisy faces contrasts and used the signed difference to characterize the magnitude of the noise effect in these regions for each participant (for ROI definition, see Materials and Methods, Fig. 2.4A, and Table 2.1). This ROI-based semipartial correlation analysis revealed that the magnitude of noise effect measured in the right FFA—as expressed by fMRI response reduction in the noisy relative to the control condition—
negatively correlated with the behavioral accuracy in the case of noisy faces (Fig. 2.4B): the larger the effect of noise in the right FFA, the lower the identity discrimination performance for noisy faces (r(20) = −0.57, p = 0.005, CI = [−0.83 −0.14], number of outliers (NO) = 0). On the other hand, we found no such correlations in the left FFA and bilateral LOC (Fig. 2.4B;
r(18) = −0.30, p = 0.183, CI = [−0.67 0.23], NO = 0; r(15) = 0.39, p = 0.106, CI = [−0.03 0.71], NO = 0; and r(12) = 0.04, p = 0.897, CI = [−0.49 0.42], NO = 4 for left FFA, right and left LOC, respectively).
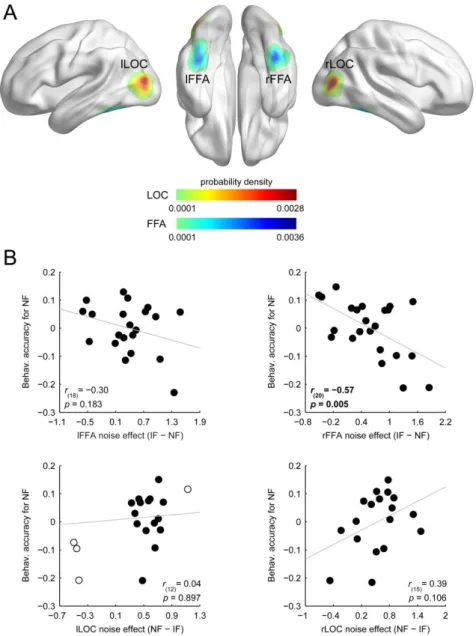
Figure 2.4. Results of the ROI-based correlation analysis. A, Probability density map illustrating the spatial distribution of the highest noise-effect voxels across participants in bilateral FFA and LOC.
Color scales reflect probability density estimates (cool colors, FFA; warm colors, LOC). B, Relationship between the noise-induced modulation of the fMRI responses and the behavioral accuracy in discriminating noisy faces: smaller decrease of the fMRI responses in the right FFA indicated better identity discrimination. Due to the semipartial correlation procedure (see Materials and Methods, Correlation analysis), correlation scatter plots depict residual values on the y-axis. The y-axis values denote behavioral accuracy for noisy faces indexed by the residual correct response ratio. The x-axis values denote noise effect on the fMRI responses indexed by the beta difference in the IF versus NF contrast. Circles represent individual participants and bivariate outliers are marked with open circles.
Diagonal line indicates linear least-squares fit. IF, intact faces; NF, noisy faces.
Note, we also failed to find significant correlation between the identity discrimination performance for noisy faces and the noise-induced fMRI response modulation in the OFA
Results 19
(r(13) = −0.36, p = 0.176, CI = [−0.77 0.23], NO = 0), a region in the inferior occipital gyrus, that was shown to be involved in an earlier feature-level processing stage of facial identity computations (for reviews, see [22, 124]). This appears to be in agreement with the results of our whole-brain random-effects analysis showing that fMRI responses in this region are not significantly different from each other for intact and noisy face stimuli. These results indicate that identity discrimination in the case of noisy faces could be associated primarily with right FFA processes.
2.4.4 Results of the intrinsic functional connectivity analysis
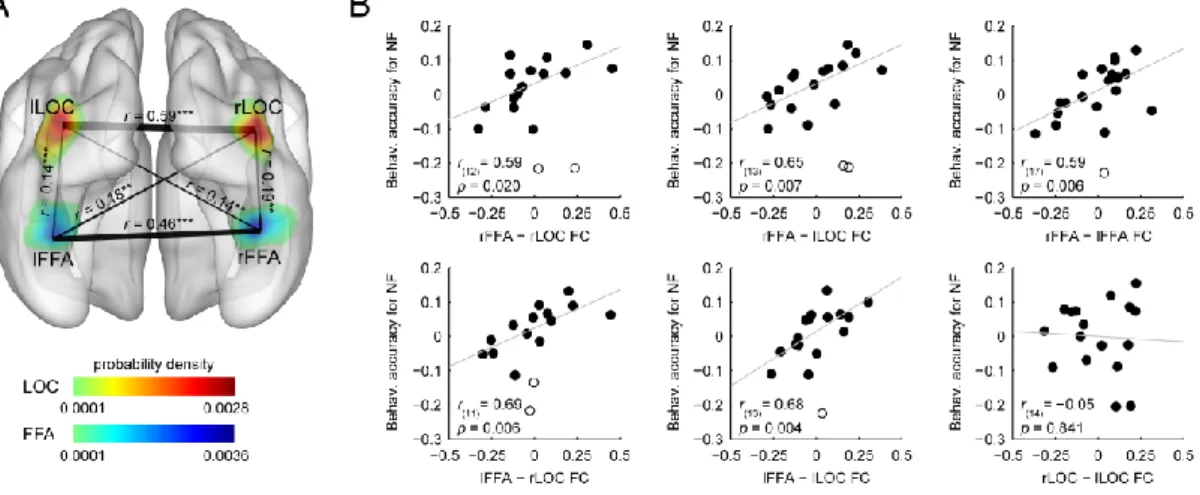
We investigated the behavioral relevance of the functional interactions between the voxels of the FFA and LOC exhibiting the highest noise effect by examining interindividual differences in resting-state functional connectivity in relation to the observed differences in identity discrimination accuracy for noisy faces. We first tested the extent to which BOLD responses in these regions were functionally correlated at rest. Reliable connectivity strengths were found between all ROI pairs using one-sample t tests (t > 2.86, p < 0.01 for all possible ROI pairs) (see Fig. 2.5A). The partial correlation analysis, used to control for the influence of the overall face perception ability of the participants on rsFC strength and noisy face performance, revealed that the functional connectivity strength between bilateral FFA and bilateral LOC correlated positively with the behavioral accuracy for noisy faces (Fig. 2.5B): the stronger the functional connectivity between these regions during rest, the better the face identity discrimination performance in the noisy condition (rFFA–rLOC: r(12) = 0.59, p = 0.020, CI = [0.21 0.88], NO = 2; rFFA–lLOC: r(13) = 0.65, p = 0.007, CI = [0.35 0.86], NO = 2; lFFA–
rLOC: r(11) = 0.69, p = 0.006, CI = [0.51 0.91], NO = 2; and lFFA–lLOC: r(13) = 0.68, p = 0.004, CI = [0.42 0.87], NO = 1). Performance for noisy faces also correlated positively with the connectivity strength between the right and left FFA (r(17) = 0.59, p = 0.006, CI = [0.17 0.92], NO = 1). On the other hand, similar relationship was not detectable in the case of the right and left LOC (r(14) = −0.05, p = 0.841, CI = [−0.53 0.48], NO = 0).
Figure 2.5. Results of the intrinsic functional connectivity analysis. A, Connections between the pairs of ROIs displayed as edges and overlaid on the probability density map from Figure 2.4A. The thickness of an edge represents the strength of the connection (correlation coefficients (r) averaged across subjects); significant correlations were found between all ROI pairs investigated. B, Scatter plots indicating the relationship between the intrinsic functional connectivity and the behavioral accuracy for noisy faces. The strength of the functional connectivity between bilateral FFA and LOC, as well as between the right and left FFA, correlated positively with the identity discrimination performance in the case of noisy faces. Due to the partial correlation procedure (see Materials and Methods, Correlation analysis), correlation scatter plots depict residual values on both axes. The y-axis values denote the behavioral accuracy for noisy faces indexed by the residual correct response ratio. The x-axis values denote the connection strength between a ROI pair indexed by the residual correlation coefficient.
Circles represent individual participants and bivariate outliers are marked with open circles. Diagonal line indicates linear least-squares fit. NF, noisy faces; FC, functional connectivity (**p < 0.01, ***p <
0.001).
Since previous research has shown that resting-state functional connectivity between the FFA and OFA is associated with identity perception in the case of intact faces [99], we also tested the relation between the strength of the FFA–OFA intrinsic functional connectivity and identity discrimination performance for noisy faces. Although in accordance with previous results [42, 99, 103] we found a pronounced resting-state connectivity between the FFA and OFA (t(15) = 6.27, p < 0.001 and t(13) = 4.57, p < 0.001 for rFFA–rOFA and lFFA–rOFA, respectively), its strength was not correlated with the noisy face identification performance (r(13) = −0.16, p = 0.566, CI = [−0.63 0.59], NO = 0 and r(10) = 0.28, p = 0.350, CI = [−0.24 0.70], NO = 1 for rFFA–rOFA and lFFA–rOFA, respectively). In sum, these results suggest that face identity perception in the case of noisy faces is based on functional interactions between bilateral FFA and LOC.
Discussion 21
2.5 Discussion
We have found that adding phase noise to face images leads to reduced and increased fMRI responses to faces in bilateral mid-fusiform gyrus and bilateral lateral occipital cortex, respectively, which is in agreement with previous results [62, 120]. Importantly, our results provide the first evidence that only in the right face-selective FFA did noise-induced modulation of the fMRI responses show a close association with the individual differences in face identity discrimination performance of noisy faces: smaller decrease of the fMRI responses was associated with better identity discrimination. This implies that the perception of noisy face images is based on the neural representations extracted from the right FFA. The robust behavioral face inversion effect also in the case of noisy images provides further support for the role of FFA in noisy face perception. Furthermore, our results also revealed that the strength of intrinsic functional connectivity within the visual cortical network composed of bilateral FFA and bilateral object-selective LOC predicts the participants’ ability to discriminate the identity of noisy face images.
Right FFA subserves noisy face perception. Our results are in agreement with previous findings showing that representations extracted by the FFA embody the primary neural substrate of facial identity perception in the case of intact faces. It was found that fMRI responses in the FFA are closely associated with successful identification of faces but not non- face objects [37], as well as with the well-known marker of face-specific processing, the behavioral face inversion effect [40]. Based on its coordinates, the FFA subregion whose fMRI responses were associated with noisy face identity discrimination in our study appears to be in close correspondence with the face-selective region related to intact face perception in the mid-fusiform gyrus [37, 39, 40]. This anterior part of the FFA, referred to as mFus-faces [29] (for review, see [123]), shows greater fMRI adaptation to repeated face images than the more posterior pFus-faces [125], suggesting its pivotal role in identity perception. Given the suggested role of FFA in the behavioral inversion effect for intact faces (FIE, [18]) [40] we reasoned that if FFA also subserves noisy face perception, face inversion will impair behavioral responses in the case of noisy face stimuli as well. The robust FIE also in the case of noisy images indicates that similarly to intact faces, noisy ones are discriminated based on face-specific processes linked to FFA.
It is important to note that previous results concerning the role of FFA in identity perception in the case of faces with deteriorated facial information were ambiguous. On the one hand, it has been shown that scrambling or adding noise to face images leads to reduced fMRI responses in the FFA [119–121, 126], which is in accord with a large body of neuroimaging results
showing that the presence of noise in images strongly attenuates feature/object-selective visual cortical responses in the downstream, higher-level object-processing areas [126–130]. Based on these findings, facial feature processing in the FFA was expected to be impaired in the presence of noise. On the other hand, involvement of the FFA in the processing of noisy faces is implicated by the results of a recent study, in which no response reduction was found in the FFA as a result of adding phase noise to the face images [62]. Furthermore, it has also been shown that face-sensitive responses emerge first in the FFA when participants perform a face detection task in a paradigm where scenes containing faces are revealed gradually from visual noise [57]. Considering the difference in task conditions between these studies might help to reconcile the apparent discrepancies in the obtained results. In studies where fMRI responses in the FFA were found to decrease as a result of noise, data were acquired during either passive viewing or under task conditions where fine facial information was irrelevant [119–
121]. Whereas, in the Bankó et al. study [62], where noise effects were absent in the FFA, participants performed a highly demanding face gender categorization task. As visual attention and task demands strongly affect fMRI responses in the FFA [121, 131–134], it is reasonable to assume that the enhancing effects of top-down attention in the Bankó et al. study [62] could have masked the noise-induced reduction of the FFA responses. This interpretation is in accordance with the results of a previous study [135] showing that decreasing motion coherence (i.e. making the stimulus noisier) leads to decreased MT+ responses only when the motion stimulus is task-irrelevant/unattended. In contrast, when motion is attended the effect of decreasing motion coherence disappeared or even reversed, leading to larger MT+
responses. Our present results are also in line with this account as using noisy face stimuli we obtained noise-induced reduction of the fMRI responses in the FFA under moderately demanding task conditions.
Occipitotemporal network underlies noisy face perception. Our findings also shed light on the visual cortical network that enables the extraction of identity information when stimuli are noisy, i.e. with deteriorated facial information. Previous research has shown that adding phase noise to the stimuli leads to increased fMRI responses in a region of bilateral LOC [62], whose coordinates closely correspond to the shape-selective, retinotopically organized LO2 area, which represents shape information within a spatial coordinate system [64, 104]. Based on these findings, we hypothesized that increased processing demands due to the distorted spatial localization of the facial features in the case of phase-randomized face images might trigger re-entrant processing mechanisms involving the LOC. Our intrinsic functional connectivity analysis provides the first direct evidence that this might indeed be the case, showing that the strength of the functional connectivity between bilateral LOC and FFA predicts the participants’ ability to discriminate the identity of noisy face images. Although LOC is
Discussion 23
considered primarily as an object-selective area [136–138], it shows elevated activation for faces as well, especially for inverted ones [40, 79, 139]. There is also evidence showing that the LOC is essentially involved in the feature-based processing of face images [126, 140–143]
and its activation might contribute to better behavioral performance in face perception [143].
These findings provide support for our results showing that LOC processes are engaged in the extraction of face identity information for stimuli with deteriorated facial information.
Our resting-state connectivity analysis also revealed that functional connectivity between the left and right FFA was also closely associated with the identity discrimination performance for faces embedded in noise. This is in agreement with the results of numerous previous studies showing that despite the right hemisphere dominance for face perception [24, 30, 144, 145], interhemispheric interactions appear to be necessary for successful face recognition. The strong task-related [44, 146], background [43], and resting-state [42] functional connectivity between corresponding face regions in the two hemispheres (including the right and left FFA) suggests that face processing involves a bilateral network. Furthermore, it was also shown that bilateral presentation of face stimuli leads to improved performance compared with unilateral presentation [147–150]. Thus, there is converging evidence that left FFA mechanisms, mainly associated with featural processing [151–154], could facilitate face recognition in the right FFA through reciprocal connections especially when faces are disrupted in their structural content, as was the case in our study.
More generally, the results of our functional connectivity analysis provide further support that measuring resting-state connectivity is a useful tool for investigating behaviorally relevant functional interaction between visual cortical areas [99, 102, 103]. It has recently been shown that the strength of the intrinsic functional connectivity within the occipitotemporal face network predicts perceptual ability to process faces depending on stimulus/task properties. For example, it was demonstrated that the connectivity of the FFA with the OFA [99] and with the perirhinal cortex [103] is closely related to the behavioral face inversion effect. Together with the present results, these findings suggest that processing of facial features takes place via coordinated interaction within the visual cortical face network, relying on synchronized spontaneous neural activity between face-processing regions.
To conclude, these results imply that perception of facial identity in the case of noisy face images is subserved by neural computations within the right FFA as well as a re-entrant processing loop involving bilateral FFA and LOC.
A question that remains to be explored concerns whether the neural mechanisms implicated in processing of face images degraded by phase noise are those that also deal with other types of visual noise. Reducing phase coherence using the weighted mean phase technique [107]
disrupts the spatial locations of features, while it leaves lower-level statistics of the images such as global spatial frequency amplitude spectrum, luminance, and contrast unaffected.
Thereby, phase noise primarily affects higher-level object-processing mechanisms for coding and integrating the structural information of the images, which is supported by our results. On the contrary, previous research suggests that white noise [155] or scrambling [129] affects the processing of visual stimuli already in the early visual cortical areas, including the primary visual cortex. Thus, to clarify the validity of our results for other types of visual noise, further studies using different types of noise within one experimental framework are needed.
![Figure 1.2. One specific example of a recurrent neural network model is the predictive coding model developed by Friston [67]](https://thumb-eu.123doks.com/thumbv2/9dokorg/1303821.104894/16.892.117.774.133.445/figure-specific-example-recurrent-network-predictive-developed-friston.webp)