https://doi.org/10.1007/s11219-020-09515-0
A public unified bug dataset for java and its assessment regarding metrics and bug prediction
Rudolf Ferenc1·Zolt ´an T ´oth1·Gergely Lad ´anyi1·Istv ´an Siket1·Tibor Gyim ´othy2
©The Author(s) 2020
Abstract
Bug datasets have been created and used by many researchers to build and validate novel bug prediction models. In this work, our aim is to collect existing public source code metric- based bug datasets and unify their contents. Furthermore, we wish to assess the plethora of collected metrics and the capabilities of the unified bug dataset in bug prediction. We con- sidered 5 public datasets and we downloaded the corresponding source code for each system in the datasets and performed source code analysis to obtain a common set of source code metrics. This way, we produced a unified bug dataset at class and file level as well. We inves- tigated the diversion of metric definitions and values of the different bug datasets. Finally, we used a decision tree algorithm to show the capabilities of the dataset in bug predic- tion. We found that there are statistically significant differences in the values of the original and the newly calculated metrics; furthermore, notations and definitions can severely dif- fer. We compared the bug prediction capabilities of the original and the extended metric suites (within-project learning). Afterwards, we merged all classes (and files) into one large dataset which consists of 47,618 elements (43,744 for files) and we evaluated the bug pre- diction model build on this large dataset as well. Finally, we also investigated cross-project capabilities of the bug prediction models and datasets. We made the unified dataset publicly available for everyone. By using a public unified dataset as an input for different bug pre- diction related investigations, researchers can make their studies reproducible, thus able to be validated and verified.
Keywords Bug dataset·Code metrics·Static code analysis·Bug prediction
1 Introduction
Finding and eliminating bugs in software systems has always been one of the most important issues in software engineering. Bug or defect prediction is a process by which we try to learn
Rudolf Ferenc ferenc@inf.u-szeged.hu
Extended author information available on the last page of the article.
Published online:3June 2020
from mistakes committed in the past and build a prediction model to leverage the location and amount of future bugs. Many research papers were published on bug prediction, which introduced new approaches that aimed to achieve better precision values (Zimmermann et al.
2009; Xu et al.2000; Hall et al.2012; Weyuker et al.2010). Unfortunately, a reported bug is rarely associated with the source code lines that caused it or with the corresponding source code elements (e.g., classes, methods). Therefore, to carry out such experiments, bugs have to be associated with source code which in and of itself is a difficult task. It is necessary to use a version control system and a bug tracking system properly during the development process, and even in this case, it is still challenging to associate bugs with the problematic source code locations.
Although several algorithms were published on how to associate a reported bug with the relevant, corresponding defective source code (Dallmeier and Zimmermann2007; Wong et al.2012; Cellier et al.2011), only few such bug association experiments were carried out.
Furthermore, not all of these studies published the bug dataset or even if they did, closed source systems were used which limits the verifiability and reusability of the bug dataset.
In spite of these facts, several bug datasets (containing information about open-source soft- ware systems) were published and made publicly available for further investigations or to replicate previous approaches (Weyuker et al.2011; Robles2010). These datasets are very popular; for instance, the NASA and the Eclipse Bug Dataset (Zimmermann et al.
2007) were used in numerous experiments (Gray et al.2012; Jureczko and Madeyski2010;
Shepperd et al.2013).
The main advantage of these bug datasets is that if someone wants to create a new bug prediction model or validate an existing one, it is enough to use a previously created bug dataset instead of building a new one, which would be very resource consuming. It is common in these bug datasets that all of them store some specific information about the bugs, such as the containing source code element(s) with their source code metrics or any additional bug-related information. Since different bug prediction approaches use various sources of information as predictors (independent variables), different bug datasets were constructed. Defect prediction approaches and hereby bug datasets can be categorized into larger groups based on the captured characteristics (D’Ambros et al.2012):
– Datasets using process metrics (Moser et al.2008; Nagappan and Ball2005).
– Datasets using source code metrics (Basili et al.1996; Briand et al.1999; Subramanyam and Krishnan2003).
– Datasets using previous defects (Kim et al.2007; Ostrand et al.2005).
Different bug prediction approaches use various public or private bug datasets. Although these datasets seem very similar, they are often very different in some aspects that is also true within the categories mentioned above. In this study, we gather datasets that can be found, but we will focus on datasets that use static source code metrics. Since this category itself has grown so immense, it is worth studying it as a separate unit. This category has also many dissimilarities between the existing datasets including the granularity of the data (source code elements can be files, classes, or methods, depending on the purpose of the given research or on the capabilities of the tool used to extract data) and the representation of element names (different tools may use different notations). For the same reason, the set of metrics can be different as well. Even if the names or the abbreviations of a metric calculated by different tools are the same, it can have different meanings because it can be
defined or calculated in a slightly different way. The bug-related information given for a source code element can also be contrasting. An element can be labeled whether it contains a bug, sometimes it shows how many bugs are related to that given source code element.
From the information content perspective, it is less important, but not negligible that the format of the files containing the data can be CSV (Comma Separated Values), XML, or ARFF (which is the input format of Weka (Hall et al. 2009)), and these datasets can be found on different places on the Internet.
In this paper, we collected 5 publicly available datasets and we downloaded the corre- sponding source code for each system in the datasets and performed source code analysis to obtain a common set of source code metrics. This way, we produced a unified bug dataset at class and file level as well.Appendixexplains the structure of the unified bug dataset which is available online.
To make it easier to imagine how a dataset looks like, Table1shows an excerpt of an example table where each row contains a Java class with its basic properties like Name or Path, which are followed by the source code metrics (e.g., WMC, CBO), and the most important property, the number of bugs.
After constructing the unified bug dataset, we examined the diversity of the metric suites.
We calculated Pearson correlation and Cohen’s d effect size, and applied the Wilcoxon signed-rank test to reveal these possible differences. Finally, we used a decision tree algorithm to show the usefulness of the dataset in bug prediction.
We found that there are statistically significant differences in the values of the original and the newly calculated metrics; furthermore, notations and definitions can severely dif- fer. We compared the bug prediction capabilities of the original and the extended metric suites (within-project learning). Afterwards, we merged all classes (and files) into one large dataset which consists of 47,618 elements (43,744 for files) and we evaluated the bug pre- diction model build on this large dataset as well. Finally, we also investigated cross-project capabilities of the bug prediction models and datasets. We made the unified dataset pub- licly available for everyone. By using a public unified dataset as an input for different bug prediction-related investigations, researchers can make their studies reproducible, thus able to be validated and verified.
Our contributions can be listed as follows:
– Collection of the public bug datasets and source code.
– Unification of the contents of the collected bug datasets.
– Calculation of a common set of source code metrics.
– Comparison of the metrics suites.
– Assessment of the meta data of the datasets.
– Assessment of bug prediction capabilities of the datasets.
– Making the results publicly available.
The first version of this work was published in our earlier conference paper (Ferenc et al.
2018). In this extended version, we collected recent systematic literature review papers in the field and considered their references as well. Moreover, some further related work was used in the paper. As another major extension, we investigated whether the differences in metric values are statistically significant. Finally, we built and evaluated within-project, merged, and cross-project bug prediction models on the unified dataset.
Table1Exampledatasettable(excerpt) TypeNamePathLineCol....WMCCBO...LOC...bug ClassASTParser...831...9655...1077...1 ClassASTRecoveryPropagator...281...13157...422...0 ClassASTRequestor...341...64...85...0 ClassASTSyntaxErrorPropagator...201...4413...129...0 ClassASTVisitor...1041...17084...2470...0 ClassAbstractTypeDeclaration...271...2011...230...0 ClassAnnotation...251...1612...157...0 ClassAnnotationBinding...271...6331...217...2 ClassAnnotationTypeDeclaration...461...2614...226...0 ClassAnonymousClassDeclaration...321...148...159...0 ClassArrayAccess...281...277...243...0 ClassArrayCreation...491...2711...271...0 ClassArrayInitializer...281...137...133...0 ClassArrayType...301...237...211...0 ClassAssertStatement...281...248...234...0 ClassAssignment...301...339...312...0 ClassBindingComparator...331...9115...275...0 ClassBindingResolver...311...5345...971...0 ....................................
The paper is organized as follows. First, in Section 2, we give a brief overview about how we collected the datasets. We also introduce the collected public datasets and present the characteristics they have. Next, Section3presents the steps needed to be done for the sake of unification. We show the original metrics for each dataset and propose the extended metrics suite in Section4, where we also compare the original and extended metric suites with a statistical method. In Section 5, we summarize the metadata of the datasets and we empirically assess the constructed unified bug dataset by showing its bug prediction capabilities. Afterwards, we list the threats to validity in Section6. We conclude the paper and discuss future work in Section7. Finally,Appendixdescribes the structure of the unified bug dataset and shows its download location.
2 Data collection
In this section, we give a detailed overview about how we collected and analyzed the datasets. We applied a snowballing-like technique (Wohlin 2014) as our data collection process. In the following, we will describe how our start set was defined, what were the inclusion criteria, and how we iterated over the relevant papers.
2.1 Start set
Starting from the early 70’s (Randell1975; Horning et al.1974), a large number of studies was introduced in connection with software faults. According to Yu et al. (2016), 729 studies were published until 2005 and 1564 until 2015 on bug prediction (the number of studies has doubled in 10 years). From time to time, the enormous number of new publications in the topic of software faults made it unavoidable to collect the most important advances in literature review papers (Hosseini et al.2019; Herbold et al.2017; Wahono2015).
Since these survey or literature review papers could serve as strong start set can- didates, we used Scopus and Google Scholar to look for these papers. We used these two search sites to fulfill the diversity rule and cover as many different publishers, years, and authors as possible. We considered only peer-reviewed papers. Our search string was the following: ‘(defect OR fault OR bug) AND prediction AND (literature OR review OR survey)’. Based on the title and the abstract, we ended up with 32 candidates. We examined these papers and based on their content, we narrowed the start set to 12 (Catal and Diri2009; Hall et al.2012; Radjenovi´c et al.2013;
Herbold et al.2017; Strate and Laplante2013; Catal2011; Malhotra and Jain2011; Jureczko and Madeyski2011b; Malhotra2015; Wahono2015; Adewumi et al.2016; Li et al.2018).
Other papers were excluded since they were out of scope, lacked peer review, or were not literature reviews. The included literature papers cover a time interval from 1990 to 2017.
2.2 Collecting bug datasets
Now we have the starting set of literature review papers, next, we applied backward snow- balling to gather all the possible candidates which refer to a bug dataset. In other words, we considered all the references of the review papers to form the final set of candidates.
Only one iteration of backward snowballing was used, since the survey papers have already included the most relevant studies in the field and sometimes they have also included reviews about the used datasets.
After having the final set of candidates (687), we filtered out irrelevant papers based on keywords, title, and abstract and we also searched for the string ‘dataset’ or ‘data set’
or ‘used projects’. Investigating the remained set of papers, we took into consideration the following properties:
– Basic information (authors, title, date, publisher).
– Accessibility of the bug dataset (public, non public, partially public).
– Availability of the source code.
The latter two are extremely important when investigating the datasets, since we cannot construct a unified dataset without obtaining the appropriate underlying data.
From the final set of papers, we extracted all relevant datasets. We considered the following list to check whether a dataset meets our requirements:
– the dataset is publicly available,
– source code is accessible for the included systems, – bug information is provided,
– bugs are associated with the relevant source code elements, – included projects were written in Java,
– the dataset provides bug information at file/class level, and
– the source code element names are provided and unambiguous (the referenced source code is clearly identifiable).
If any condition is missing, then we had to exclude the subject system or the whole dataset from the study, because they cannot be included in the unified bug dataset.
Initially, we did not insist on examining Java systems; however, relevant research papers mostly focus on Java language projects (Sayyad Shirabad and Menzies2005; Catal2011;
Radjenovi´c et al.2013). Consequently, we narrowed our research topic to datasets capturing information about systems written in Java. This way, we could use one static analysis tool to extract the characteristics from all the systems; furthermore, including heterogeneous sys- tems would have added a bias to the unified dataset, since the interpretation of the metrics, even more the interpretable set of metrics themselves, can differ from language to language.
The list of found public datasets we could use for our purposes is the following (references are pointing to the original studies in which the datasets were first presented):
– PROMISE – Jureczko and Madeyski (2010) – Eclipse Bug Dataset (Zimmermann et al.2007) – Bug Prediction Dataset (D’Ambros et al.2010) – Bugcatchers Bug Dataset (Hall et al.2014) – GitHub Bug Dataset (T´oth et al.2016)
It is important to note that we will refer the Jureczko dataset as the PROMISE dataset throughout the study; however, the PROMISE repository itself contains more datasets such as the NASA MDP (Sayyad Shirabad and Menzies2005) dataset (had to be excluded, since the source code is not accessible).
2.3 Public Datasets
In the following subsections, we will describe the chosen datasets in more details and inves- tigate each dataset’s peculiarities and we will also look for common characteristics. Before introducing each dataset, we show some basic size statistics about the chosen datasets,
which is presented in Table2. We used the cloc (https://www.npmjs.com/package/cloc) pro- gram to measure the Lines of Code. We only took Java source files into consideration and we neglected blank lines.
2.3.1 PROMISE
PROMISE (Sayyad Shirabad and Menzies2005) is one of the largest research data repos- itories in software engineering. It is a collection of many different datasets, including the NASA MDP (Metric Data Program) dataset, which was used by numerous studies in the past. However, one should always mistrust the data that comes from an external source (Petri´c et al.2016; Gray et al.2011,2012; Shepperd et al.2013). The repository is created to encourage repeatable, verifiable, refutable, and improvable predictive models of software engineering. This is essential for maturation of any research discipline. One main goal is to extend the repository to other research areas as well. The repository is commu- nity based; thus, anybody can donate a new dataset or public tools, which can help other researchers in building state-of-the-art predictive models. PROMISE provides the datasets under categories like code analysis, testing, software maintenance, and it also has a category for defects.
One main dataset in the repository is the one from Jureczko and Madeyski (2010) which we use in our study. The dataset uses the classic Chidamber and Kemerer (C&K) metrics (Chidamber and Kemerer1994) to characterize the bugs in the systems.
2.3.2 Eclipse Bug Dataset
Zimmermann et al. (2007) mapped defects from the bug database of Eclipse 2.0, 2.1, and 3.0. The resulting dataset lists the number of pre- and post-release defects on the granularity of files and packages that were collected from the BUGZILLA bug tracking system. They collected static code features using the built-in Java parser of Eclipse. They calculated some features at a finer granularity; these were aggregated by taking the average, total, and max- imum values of the metrics. Data is publicly available and was used in many studies since then. Last modification on the dataset was submitted on March 25, 2010.
2.3.3 Bug Prediction Dataset
The Bug prediction dataset(D’Ambros et al. 2010) contains data extracted from 5 Java projects by using inFusion and Moose to calculate the classic C&K metrics for class level.
The source of information was mainly CVS, SVN, Bugzilla and Jira from which the number of pre- and post-release defects were calculated. D’Ambros et al. also extended the source
Table 2 Basic properties of the public bug datasets
Dataset Systems Versions Lines of code
PROMISE 14 45 2,805,253
Eclipse Bug Dataset 1 3 3,087,826
Bug Prediction Dataset 5 5 1,171,220
Bugcatchers Bug Dataset 3 3 1,833,876
GitHub Bug Dataset 15 105 1,707,446
code metrics with change metrics, which, according to their findings, could improve the performance of the fault prediction methods.
2.3.4 Bugcatchers Bug Dataset
Hall et al. presented theBugcatchers(Hall et al.2014) Bug Dataset, which solely operates with bad smells, and found that coding rule violations have a small but significant effect on the occurrence of faults at file level. The Bugcatchers Bug Dataset contains bad smell information about Eclipse, ArgoUML, and some Apache software systems for which the authors used Bugzilla and Jira as the sources of the data.
2.3.5 GitHub Bug Dataset
T´oth et al. selected 15 Java systems from GitHub and constructed a bug dataset at class and file level (T´oth et al.2016). This dataset was employed as an input for 13 different machine learning algorithms to investigate which algorithm family performs the best in bug prediction. They included many static source code metrics in the dataset and used these measurements as independent variables in the machine learning process.
2.4 Additional Bug Datasets
In this section, we show additional datasets which could not be included in the chosen set of datasets. Since this study focuses on datasets that fulfilled our selection criteria and could be used in the unification, we only briefly describe the most important but excluded datasets here.
2.4.1 Defects4J
Defects4J is a bug dataset which was first presented at the ISSTA conference in 2014 (Just et al. 2014). It focuses on bugs from software testing perspective. Defects4J encapsu- lates reproducible real world software bugs. Its repository1 includes software bugs with their manually cleaned patch files (irrelevant code parts were removed manually) and most importantly it includes a test suite from which at least one test case fails before the patch was applied and none fails after the patch was applied. Initially, the repository contained 357 software bugs from 5 software systems, but it reached 436 bugs from 6 systems owing to active maintenance.
2.4.2 IntroClassJava
IntroClassJava (Durieux and Monperrus2016) dataset is a collection of software programs each with several revisions2. The revisions were submitted by students and each revision is a maven project. This benchmark is interesting since it contains C programs transformed into Java. Test cases are also transformed into standard JUnit test cases. The benchmark consists of 297 Java programs each having at least one failing test case. The IntroClassJava dataset is very similar to Defects4J; however, it does not provide the manually cleaned fixing patches.
1https://github.com/rjust/defects4j
2https://github.com/Spirals-Team/IntroClassJava
2.4.3 QuixBugs
QuixBugs is a benchmark for supporting automatic program repair research studies (Lin et al.2017). QuixBugs consists of 40 programs written in both Python and Java3. It also contains the failing test cases for the one-line bugs located in each program. Defects are categorized and each defect falls in exactly one category. The benchmark also includes the corrected versions of the programs.
2.4.4 Bugs.jar
Bugs.jar (Saha et al. 2018) is a large scale, diverse dataset for automatic bug repair4. Bugs.jar falls into the same dataset category as the previously mentioned ones. It consists of 1,158 bugs with their fixing patches from 8 large open-source software systems. This dataset also includes the bug reports and the test suite in order to support reproducibility.
2.4.5 Bears
Bears dataset (Madeiral et al. 2019) is also present to support automatic program repair studies5. This dataset makes use of the continuous integration tool named Travis to generate new entries in the dataset. It includes the buggy state of the source code, the test suite, and the fixing patch as well.
2.4.6 Summary
All the above described datasets are focusing on bugs from the software testing perspective and also support future automatic program repair studies. These datasets can be good candi- dates to be used in fault localization research studies as well. These datasets capture buggy states of programs and provide the test suite and the patch. Our dataset is fundamentally dif- ferent from these datasets. The datasets we collected gather information from a wider time interval and provide information for each source code element by characterizing them with static source code metrics.
3 Data Processing
Although the found public datasets have similarities (e.g., containing source code metrics and bug information), they are very inhomogeneous. For example, they contain different metrics, which were calculated with different tools and for different kinds of code elements.
The file formats are different as well; therefore, it is very difficult to use these datasets together. Consequently, our aim was to transform them into a unified format and to extend them with source code metrics that are calculated with the same tool for each system. In this section, we will describe the steps we performed to produce the unified bug dataset.
First, we transformed the existing datasets to a common format. This means that if a bug dataset for a system consists of separate files, we conflated them into one file. Next, we changed theCSV separator in each file tocomma (,)and renamed the number of bug
3https://github.com/jkoppel/QuixBugs
4https://github.com/bugs-dot-jar/bugs-dot-jar
5https://github.com/bears-bugs/bears-benchmark
column in each dataset to ‘bug’ and the source code element column name to ‘filepath’ or
‘classname’ depending on the granularity of the dataset. Finally, we transformed the source code element identifier into the standard form (e.g.org.apache.tools.ant.AntClassLoader).
3.1 Metrics calculation
The bug datasets contain different kinds of metric sets, which were calculated with different tools; therefore, even if the same metric name appears in two or more different datasets, we cannot be sure they mean exactly the same metric. To eliminate this deficiency, we analyzed all the systems with the same tool. For this purpose, we used the free and open- sourceOpenStaticAnalyzer1.0 (OSA)6 tool that is able to analyze Java systems (among other languages). It calculates more than 50 different kinds (size, complexity, coupling, cohesion, inheritance, and documentation) of source code metrics for packages and class- level elements, about 30 metrics for methods, and a few ones for files. OSA can detect code duplications (Type-1 and Type-2 clones) as well, and calculates code duplication metrics for packages, classes, and methods. OpenStaticAnalyzer has two different kinds of textual outputs: the first one is an XML file that contains, among others, the whole structure of the source code (files, packages, classes, methods), their relationships, and the metric values for each element (e.g. file, class, method). The other output format is CSV. Since different elements have different metrics, there is one CSV file for each kind of element (one for packages, one for classes, and so on).
The metrics in the bug datasets were calculated with 5 different tools (inFusion Moose, ckjm, Visitors written for Java parser of Eclipse, Bad Smell Detector, SourceMeter – which is a commercial product based on OSA; see Table16). From these 5 tools, only ckjm and SourceMeter/OSA are still available on the internet, but the last version of ckjm is from 2012 and the Java language evolved a lot since then. Additionally, ckjm works on the bytecode representation of the code, which makes it necessary to compile the source code before analysis. Consequently, we selected OSA because it is a state-of-the-art analyzer, which works on the source code that besides being easier to use, enables also more precise analysis.
Of course, further tools are also available, but it was not the aim of this work to find the best available tool.
For calculating the new metric values, we needed the source code itself. Since all datasets belonged to a release version of a given software, therefore, if the software was open-source and the given release version was still available, we could manage to download and analyze it. This way, we obtained two results for each system: one from the downloaded bug datasets and one from the OSA analysis.
3.2 Dataset unification
We merged the original datasets with the results of OSA by using the “unique identifiers”
of the elements (Java standard names at class level and paths at file level). More precisely, the basis of the unified dataset was our source code analysis result and it was extended with the data of the given bug dataset. This means that we went through all elements of the bug dataset and if the “unique identifier” of an element was found in our analysis result, then these two elements were conjugated (paired the original dataset entry with the one found in the result ofOSA); otherwise, it was left out from the unified dataset. Tables3and4show
6https://github.com/sed-inf-u-szeged/OpenStaticAnalyzer
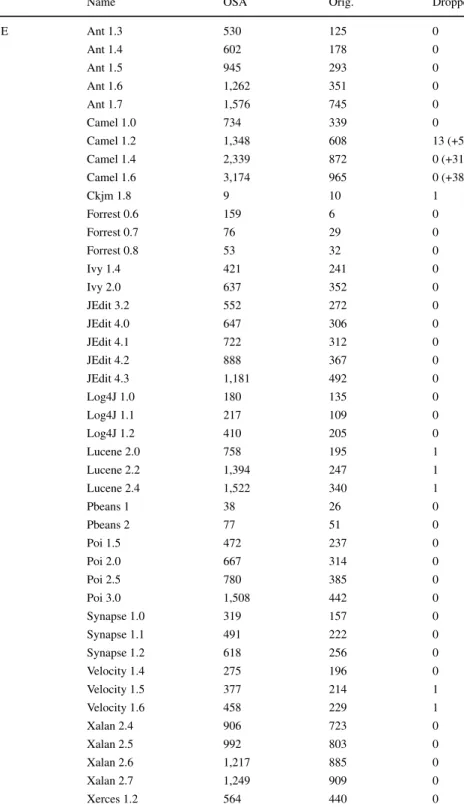
Table 3 Merging results (number of elements) – Class level datasets
Dataset Name OSA Orig. Dropped
PROMISE Ant 1.3 530 125 0
Ant 1.4 602 178 0
Ant 1.5 945 293 0
Ant 1.6 1,262 351 0
Ant 1.7 1,576 745 0
Camel 1.0 734 339 0
Camel 1.2 1,348 608 13 (+5)
Camel 1.4 2,339 872 0 (+31)
Camel 1.6 3,174 965 0 (+38)
Ckjm 1.8 9 10 1
Forrest 0.6 159 6 0
Forrest 0.7 76 29 0
Forrest 0.8 53 32 0
Ivy 1.4 421 241 0
Ivy 2.0 637 352 0
JEdit 3.2 552 272 0
JEdit 4.0 647 306 0
JEdit 4.1 722 312 0
JEdit 4.2 888 367 0
JEdit 4.3 1,181 492 0
Log4J 1.0 180 135 0
Log4J 1.1 217 109 0
Log4J 1.2 410 205 0
Lucene 2.0 758 195 1
Lucene 2.2 1,394 247 1
Lucene 2.4 1,522 340 1
Pbeans 1 38 26 0
Pbeans 2 77 51 0
Poi 1.5 472 237 0
Poi 2.0 667 314 0
Poi 2.5 780 385 0
Poi 3.0 1,508 442 0
Synapse 1.0 319 157 0
Synapse 1.1 491 222 0
Synapse 1.2 618 256 0
Velocity 1.4 275 196 0
Velocity 1.5 377 214 1
Velocity 1.6 458 229 1
Xalan 2.4 906 723 0
Xalan 2.5 992 803 0
Xalan 2.6 1,217 885 0
Xalan 2.7 1,249 909 0
Xerces 1.2 564 440 0
Table 3 (continued)
Dataset Name OSA Orig. Dropped
Xerces 1.3 596 453 0
Xerces 1.4 782 588 42
Bug Prediction Dataset Eclipse JDT Core 3.4 2,486 997 0
Eclipse PDE UI 3.4.1 3,382 1,497 6
Equinox 3.4 742 324 5
Lucene 2.4 1,522 691 21
Mylyn 3.1 3,238 1,862 457
GitHub Bug Dataset Android U. I. L. 1.7.0 84 73 0
ANTLR v4 4.2 525 479 0
Elasticsearch 0.90.11 6,480 5,908 0
jUnit 4.9 770 731 0
MapDB 0.9.6 348 331 0
mcMMO 1.4.06 329 301 0
MCT 1.7b1 2,050 1,887 0
Neo4j 1.9.7 6,705 5,899 0
Netty 3.6.3 1,300 1,143 0
OrientDB 1.6.2 2,098 1,847 0
Oryx 562 533 0
Titan 0.5.1 1,770 1,468 0
Eclipse p. for Ceylon 1.1.0 1,651 1,610 0
Hazelcast 3.3 3,765 3,412 0
Broadleaf C. 3.0.10 2,094 1,593 0
Sum All 76,623 48,242 624
the results of this merging process at class and file level, respectively: columnOSAshows how many elements OSA found in the analyzed systems, columnOrig.presents the number of elements originally in the datasets, and columnDroppedtells us how many elements of the bug datasets could not be paired, and so they were left out from the unified dataset. The numbers in parentheses show the amount of dropped elements where the drop was caused because of the original sources were not real Java sources, such aspackage-info.javaand Scala files(which are also compiled to byte code and hence included in the original dataset).
Although these numbers are very promising, we had to “modify” a few systems to achieve this, but there were cases where we simply could not solve the inconsistencies. The details of the source code modifications and main reasons for the dropped elements were the following:
Camel 1.2: In theorg.apache.commons.logging, there were 13 classes in the original dataset that we did not find in the source code. There were 5package-info.java7files in the system, but these files never contain any Java classes, since they are used for package level Javadoc purposes; therefore, OSA did not find such classes.
7Scala (see Camel 1.4) andpackage-info.javafiles are “not real” Java source files therefore they should not be included in the original results so their quantities are presented in parenthesis in Table3.
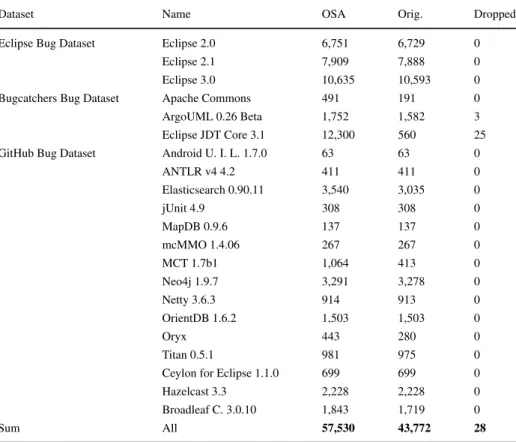
Table 4 Merging results (number of elements) – File level datasets
Dataset Name OSA Orig. Dropped
Eclipse Bug Dataset Eclipse 2.0 6,751 6,729 0
Eclipse 2.1 7,909 7,888 0
Eclipse 3.0 10,635 10,593 0
Bugcatchers Bug Dataset Apache Commons 491 191 0
ArgoUML 0.26 Beta 1,752 1,582 3
Eclipse JDT Core 3.1 12,300 560 25
GitHub Bug Dataset Android U. I. L. 1.7.0 63 63 0
ANTLR v4 4.2 411 411 0
Elasticsearch 0.90.11 3,540 3,035 0
jUnit 4.9 308 308 0
MapDB 0.9.6 137 137 0
mcMMO 1.4.06 267 267 0
MCT 1.7b1 1,064 413 0
Neo4j 1.9.7 3,291 3,278 0
Netty 3.6.3 914 913 0
OrientDB 1.6.2 1,503 1,503 0
Oryx 443 280 0
Titan 0.5.1 981 975 0
Ceylon for Eclipse 1.1.0 699 699 0
Hazelcast 3.3 2,228 2,228 0
Broadleaf C. 3.0.10 1,843 1,719 0
Sum All 57,530 43,772 28
Camel 1.4: Besides the 7package-info.javafiles, the original dataset contained information about 24 Scala files (they are also compiled to byte code); therefore, OSA did not analyze them.
Camel 1.6: There were 8package-info.javaand 30 Scala files.
Ckjm 1.8: There was a class in the original dataset that did not exist in version 1.8.
Forrest-0.8: There were two different classes that appeared twice in the source code;
therefore, we deleted the 2 copies from theetc/test-whitespacesubdirectory.
Log4j: There was acontribsdirectory which contained the source code of different contrib- utors. These files were put into the appropriate sub-directories as well (where they belonged according to their packages), which means that they occurred twice in the analysis and this prevented their merging. Therefore, in these cases, we analyzed only those files that were in their appropriate subdirectories and excluded the files found in thecontribsdirectory.
Lucene: In all three versions, there was an org.apache.lucene.search.Remote- Searchable Stub class in the original dataset that did not exist in the source code.
Velocity: In versions 1.5 and 1.6 there were two org.apache.velocity.app.event. imple- ment.EscapeReferenceclasses in the source code; therefore, it was impossible to conjugate them by using their “unique identifiers” only.
Xerces 1.4.4: Although the name of the original dataset and the corresponding publication state that this is the result of Xerces 1.4.4 analysis, we found that 256 out of the 588 elements did not exist in that version. We examined a few previous and following versions as well, and it turned out that the dataset is much closer to 2.0.0 than to 1.4.4, because only 42 elements could not be conjugated with the analysis result of 2.0.0. Although version 2.0.0 was still not matched perfectly, we did not find a “closer version”; therefore, we used Xerces 2.0.0 in this case.
Eclipse JDT Core 3.4: There were a lot of classes which appeared twice in the source code:
once in the “code” and once in the “test” directory; therefore, we deleted the test directory.
Eclipse PDE UI 3.4.1: The missing 6 classes were not found in its source code.
Equinox 3.4: Three classes could not be conjugated, because they did not have a unique name (there are more classes with the same name in the system) while two classes were not found in the system.
Lucene 2.4 (BPD): 21 classes from the original dataset were not present in the source code of the analyzed system.
Mylyn 3.1: 457 classes were missing from our analysis that were in the original dataset;
therefore, we downloaded different versions of Mylyn, but still could not find the matching source code. We could not achieve better result without knowing the proper version.
ArgoUML 0.26 Beta: There were 3 classes in the original dataset that did not exist in the source code.
Eclipse JDT Core 3.1: There were 25 classes that did not exist in the analyzed system.
GitHub Bug Dataset Since OSA is the open-source version of SourceMeter, the tool used to construct the GitHub Bug Dataset, we could easily merge the results. However, the class level bug datasets contained elements having the same “unique identifier” (since class names are not the standard Java names in that case), so this information was not enough to conjugate them. Luckily, the paths of the elements were also available and we used them as well; therefore, all elements could be conjugated. Since they performed a machine learning step on the versions that contain the most bugs, we decided to select these release versions and present the characteristics of these release versions. We also used these versions of the systems to include in the unified bug dataset.
As a result of this process, we obtained a unified bug dataset which contains all of the public datasets in a unified format; furthermore, they were extended with the same set of metrics provided by the OSA tool. The last lines of Tables3and4show that only 1.29%
(624 out of 48,242) of the classes and 0.06% (28 out of 43,772) of the files could not be conjugated, which means that only 0.71% (652 out of 92,014) of the elements were left out from the unified dataset in total.
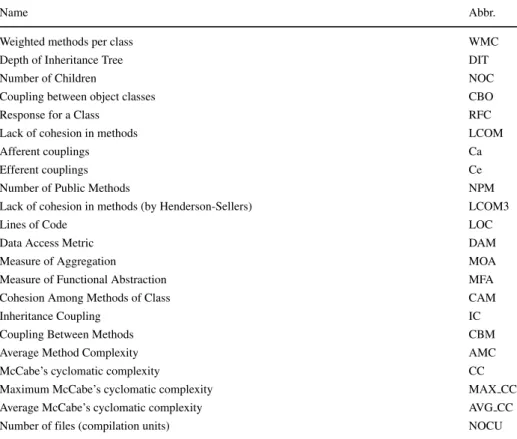
Table 5 Metrics used in the PROMISE dataset
Name Abbr.
Weighted methods per class WMC
Depth of Inheritance Tree DIT
Number of Children NOC
Coupling between object classes CBO
Response for a Class RFC
Lack of cohesion in methods LCOM
Afferent couplings Ca
Efferent couplings Ce
Number of Public Methods NPM
Lack of cohesion in methods (by Henderson-Sellers) LCOM3
Lines of Code LOC
Data Access Metric DAM
Measure of Aggregation MOA
Measure of Functional Abstraction MFA
Cohesion Among Methods of Class CAM
Inheritance Coupling IC
Coupling Between Methods CBM
Average Method Complexity AMC
McCabe’s cyclomatic complexity CC
Maximum McCabe’s cyclomatic complexity MAX CC
Average McCabe’s cyclomatic complexity AVG CC
Number of files (compilation units) NOCU
In many cases, the analysis results of OSA contained more elements than the original datasets. Since we did not know how the bug datasets were produced, we could not give an exact explanation for the differences, but we list the two main possible causes:
– In some cases, we could not find the proper source code for the given system (e.g., Xerces 1.4.4 or Mylyn), so two different but close versions of the same system might be conjugated.
– OSA takes into account nested, local, and anonymous classes while some datasets simply associated Java classes with files.
4 Original and extended metrics suites
In this section, we present the metrics proposed by each dataset. Additionally, we will show a metrics suite that is used by the newly constructed unified dataset.
4.1 PROMISE
The authors Promiserepo (2018) calculated the metrics of the PROMISE dataset with the tool calledckjm. All metrics, except McCabe’s Cyclomatic Complexity (CC), areclasslevel
Table 6 Metrics used in the Eclipse Bug Dataset
Name Abbr.
Number of method calls FOUT
Method lines of code MLOC
Nested block depth NBD
Number of parameters PAR
McCabe cyclomatic complexity VG
Number of field NOF
Number of method NOM
Number of static fields NSF
Number of static methods NSM
Number of anonymous type declarations ACD
Number of interfaces NOI
Number of classes NOT
Total lines of code TLOC
Number of files (compilation units) NOCU
metrics. Besides the C&K metrics, they also calculated some additional metrics shown in Table5.
4.2 Eclipse Bug Dataset
In the Eclipse Bug Dataset, there are two types of predictors. By parsing the structure of the obtained abstract syntax tree, they Zimmermann et al. (2007) calculated the number of nodes for each type in a package and in afile(e.g., the number of return statements in a file). By implementing visitors to the Java parser of Eclipse, they also calculated various complexity metrics at method, class, file, and package level. Then they used avg, max, total avg, and total max aggregation techniques to accumulate to file and package level. The complexity metrics used in the Eclipse dataset are listed in Table6.
4.3 Bug Prediction Dataset
The Bug Prediction Dataset collects product and change (process) metrics. The authors (D’Ambros et al. 2010) produced the corresponding product and process met- rics at class level. Besides the classic C&K metrics, they calculated some additional object-oriented metrics that are listed in Table7.
4.4 Bugcatchers Bug Dataset
The Bugcatchers Bug Dataset is a bit different from the previous datasets, since it does not contain traditional software metrics, but the number of bad smells for files. They used five bad smells which are presented in Table8. Besides, in the CSV file, there are four source code metrics (blank, comment, code, codeLines), which are not explained in the corresponding publication (Hall et al.2014).
Table 7 Metrics used in the Bug Prediction Dataset
Name Abbr.
Number of other classes that reference the class FanIn
Number of other classes referenced by the class FanOut
Number of attributes NOA
Number of public attributes NOPA
Number of private attributes NOPRA
Number of attributes inherited NOAI
Number of lines of code LOC
Number of methods NOM
Number of public methods NOPM
Number of private methods NOPRM
Number of methods inherited NOMI
4.5 GitHub Bug Dataset
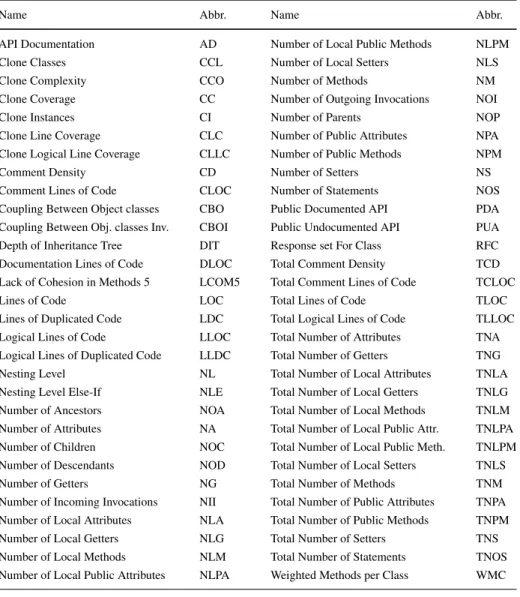
The GitHub Bug Dataset (T´oth et al.2016) used the free version of SourceMeter (2019) static analysis tool to calculate the static source code metrics including software product metrics, code clone metrics, and rule violation metrics. The rule violation metrics were not used in our research; therefore, Table9shows only the list of the software product and code clone metrics at class level. At file level, only a narrowed set of metrics is calculated, but there are 4 additional process metrics included as Table10shows.
4.6 Unified Bug Dataset
The unified dataset contains all the datasets with their original metrics and with further metrics that we calculated with OSA. The set of metrics calculated by OSA concurs with the metric set of the GitHub Bug Dataset, because SourceMeter is a product based on the free and open-source OSA tool. Therefore, all datasets in the Unified Bug Dataset are extended with the metrics listed in Table9except the GitHub Bug Dataset, because it contains the same metrics originally.
In spite of the fact that several of the original metrics can be matched with the metrics calculated by OSA, we decided to keep all the original metrics for every system included in the unified dataset, because they can differ in their definitions or in the ways of their calcu- lation. One can simply use the unified dataset and discard the metrics that were calculated by OSA if s/he wants to work only with the original metrics. Furthermore, this provides an opportunity to confront the original and the OSA metrics.
Table 8 Bad smells used in the Bugcatchers Bug Dataset Name
Data Clumps Message Chains Middle Man Speculative Generality Switch Statements
Table 9 Class Level Metrics used in the GitHub Bug Dataset
Name Abbr. Name Abbr.
API Documentation AD Number of Local Public Methods NLPM
Clone Classes CCL Number of Local Setters NLS
Clone Complexity CCO Number of Methods NM
Clone Coverage CC Number of Outgoing Invocations NOI
Clone Instances CI Number of Parents NOP
Clone Line Coverage CLC Number of Public Attributes NPA
Clone Logical Line Coverage CLLC Number of Public Methods NPM
Comment Density CD Number of Setters NS
Comment Lines of Code CLOC Number of Statements NOS
Coupling Between Object classes CBO Public Documented API PDA
Coupling Between Obj. classes Inv. CBOI Public Undocumented API PUA
Depth of Inheritance Tree DIT Response set For Class RFC
Documentation Lines of Code DLOC Total Comment Density TCD
Lack of Cohesion in Methods 5 LCOM5 Total Comment Lines of Code TCLOC
Lines of Code LOC Total Lines of Code TLOC
Lines of Duplicated Code LDC Total Logical Lines of Code TLLOC
Logical Lines of Code LLOC Total Number of Attributes TNA
Logical Lines of Duplicated Code LLDC Total Number of Getters TNG
Nesting Level NL Total Number of Local Attributes TNLA
Nesting Level Else-If NLE Total Number of Local Getters TNLG
Number of Ancestors NOA Total Number of Local Methods TNLM
Number of Attributes NA Total Number of Local Public Attr. TNLPA
Number of Children NOC Total Number of Local Public Meth. TNLPM
Number of Descendants NOD Total Number of Local Setters TNLS
Number of Getters NG Total Number of Methods TNM
Number of Incoming Invocations NII Total Number of Public Attributes TNPA Number of Local Attributes NLA Total Number of Public Methods TNPM
Number of Local Getters NLG Total Number of Setters TNS
Number of Local Methods NLM Total Number of Statements TNOS
Number of Local Public Attributes NLPA Weighted Methods per Class WMC
Table 10 File Level Metrics used in the GitHub Bug Dataset
Name Abbr.
McCabe’s Cyclomatic Complexity McCC
Comment Lines of Code CLOC
Logical Lines of Code LLOC
Number of Committers −
Number of developer commits −
Number of previous modifications −
Number of previous fixes −
Instead of presenting all the definitions of metrics here, we give an external resource to show metric definitions because of the lack of space. All the metrics and their definitions can be found in the Unified Bug Dataset file reachable as an online appendix (seeAppendix).
4.7 Comparison of the Metrics
In the unified dataset, each element has numerous metrics, but these values were calculated by different tools; therefore, we assessed them in more detail to get answers to questions like the following ones:
– Do two metrics with the same name have the same meaning?
– Do metrics with different names have the same definition?
– Can two metrics with the same definition be different?
– What are the root causes of the differences if the metrics share the definition?
Three out of the five datasets contain class level elements, but unfortunately, for each dataset, a different analyzer tool was used to calculate the metrics (see Table16). To be able to compare class level metrics calculated by all the tools used, we needed at least one dataset for which all metrics of all three tools are available. We were already familiar with the usage of the ckjm tool, so we chose to calculate the ckjm metrics for the Bug Prediction dataset.
This way, we could assess all metrics of all tools, because the Bug Prediction dataset was originally created with Moose, so we have extended it with the OSA metrics, and also – for the sake of this comparison – with ckjm metrics.
In the case of the three file level datasets, the used analyzer tools were unavailable;
therefore, we could only compare the file level metrics of OpenStaticAnalyzer with the results of the other two tools separately on Eclipse and Bugcatchers Bug datasets.
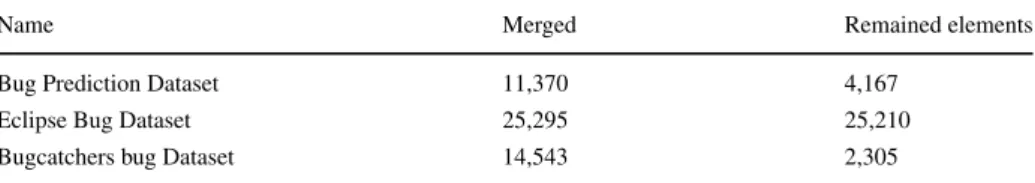
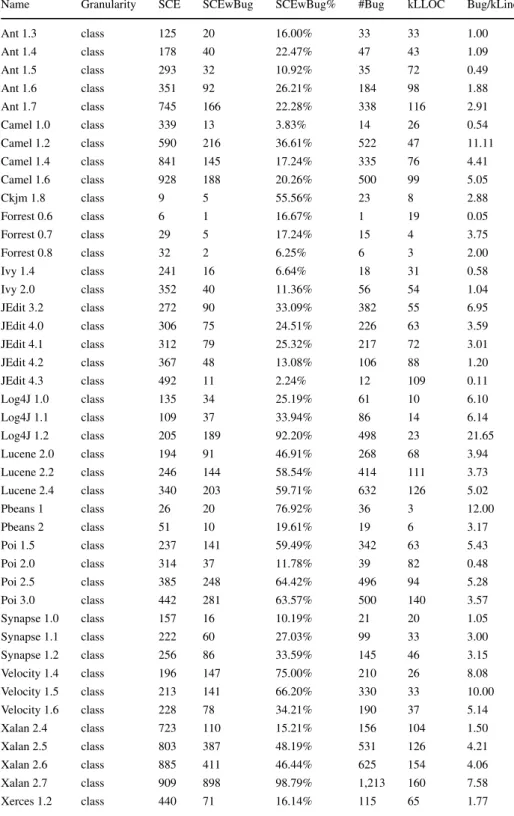
In each comparison, we merged the different result files of each dataset into one, which contained the results of all systems in the given dataset and deleted those elements that did not contain all metric values. For example, in case of the Bug Prediction Dataset, we calculated the OSA and ckjm metrics, then we removed the entries which were not identified by all three tools. Because we could not find the analyzers used in the file level datasets, we used the merging results seen in Section3.2. For instance, in case of the Bugcatchers Bug Dataset, the new merged (unified) dataset has 14,543 entries (491 + 1,752 + 12,300) out of which 2,305 were in the original dataset and not dropped (191 + 1,582 + 560 - 28).
The resulting spreadsheet files can be found in theAppendix. Table11shows how many classes or files were in the given dataset and how many of them remained. We calculated the basic statistics (minimum, maximum, average, median, and standard deviation) of the examined metrics and compared them (see Table12). Besides, we calculated the pairwise differences of the metrics for each element and examined its basic statistics as well. In addition, theEqualcolumn shows the percentage of the classes for which the two examined tools gave the same result (for example, at class level OSA and Moose calculated the same WMC value for 2,635 out of the 4,167 elements, which is 63.2%, see Table12).
Since the basic statistic values give only some impression about the similarity of the metric sets, we performed a Wilcoxon signed-rank test (Myles et al.2014), which deter- mines whether two dependent samples were selected from populations having the same distribution. In our test, theH0 hypothesis is that the difference between the pairs follows a symmetric distribution around zero, while the alternativeH1hypothesis is that the differ- ence between the pairs does not follow a symmetric distribution around zero. We used 95%
confidence level in the tests to calculate thep-values. This means that if ap-valueis higher
Table 11 Number of elements in the merged systems
Name Merged Remained elements
Bug Prediction Dataset 11,370 4,167
Eclipse Bug Dataset 25,295 25,210
Bugcatchers bug Dataset 14,543 2,305
than0.05, we accept theH0 hypothesis; otherwise, we reject it and accept theH1alterna- tive hypothesis instead. In all cases, the p-values were less than 0.001; therefore, we had to reject theH0and accept that the difference between the pairs does not follow a symmetric distribution around zero.
Although from statistical point of view the metric sets are different, we see that in many cases, there are lot of equal metric values. For example, in case of the file level dataset of Eclipse (see Table14), only 11 out of 25,199 metrics are different, but 10 out of these 11 are larger only by 1 than their pairs so the test recognizes well that it is not symmetric. On the other hand, in this case, we can say that the two groups can be considered identical because less than 0.1% of the elements differ, and the difference is really neglectable. Therefore, we calculatedCohen’s das well which indicates the standardized difference between two means (Cohen1988). If this difference, namely Cohen’s d value, is less than 0.2, we say that the effect size is small and more than 90% of the two groups overlap. If the Cohen’s d value is between 0.2 and 0.5, the effect size is medium and if the value is larger than 0.8, the effect size is large. Besides, to see how strong or weak the correlations between the metric values are, we calculated thePearson correlation coefficient. The correlation coefficient ranges from -1 to 1, where 1 (or -1) means that there is linear equation between the two sets, while 0 means that there is no linear correlation at all. In general, the larger the absolute correlation coefficient is, the stronger the relationship is. In the literature, there are different recommendations for the threshold above the correlation is considered strong (Gyimothy et al.2005a; Jureczko2011a), in this research, we used 0.8.
4.7.1 Class Level Metrics
The unified bug dataset contains the class level metrics of OSA and Moose on the Bug Pre- diction dataset. We downloaded the Java binaries of the systems in this dataset and used ckjm version 2.2 to calculate the metrics. The first difference is that while OSA and Moose calculate metrics on source code, ckjm uses Java bytecode and takes “external dependen- cies” into account; therefore, we expected differences, for instance, in the coupling metric values.
We compared the metric sets of the three tools and found that, for example, CBO and WMC have different definitions. On the other hand, efferent coupling metric is a good example for a metric which is calculated by all three tools, but with different names (see Table12, CBO row). In the following paragraphs, we only examine those metrics whose definitions coincide in all three tools even if their names differ. Table12shows these metrics where theMetriccolumn contains the abbreviation of the most widely used name of the metric. TheToolcolumn presents the analyzer tools, in theMetric namecolumn, the metric names are given using the notations of the different datasets. The “tool1−tool2” means the pairwise difference where, for each element, we extracted the value of tool2from the value of tool1and the name of this “new metric” is diff. The following columns present the basic statistics of the metrics. The Equal column denotes the percentage of the elements having
Table12ComparisonofthecommonclasslevelmetricsintheBugPredictiondataset MetricToolMetricn.MinMaxAvgMedDevEqualCohenPearson WMCOSANLM042611.04718.12−−− MooseMethods04039.96614.38−−− ckjmWMC142611.96718.49−−− OSA−Moosediff−44201.0809.4063.2%0.0660.857 OSA−ckjmdiff−480−0.9101.9451.9%0.0500.995 Moose−ckjmdiff−4214−1.99−19.5741.1%0.1200.859 CBOOSACBO02148.86512.25−−− MoosefanOut0936.2247.79−−− ckjmCe021313.78816.88−−− OSA−Moosediff−321612.6527.6116.0%0.2580.801 OSA−ckjmdiff−12083−4.91−19.7226.2%0.3330.823 Moose−ckjmdiff−16032−7.56−411.847.4%0.5750.780 CBOIOSACBOI06079.38326.14−−− MoosefanIn03554.69114.30-−− ckjmCa06117.64222.13−−− OSA−Moosediff−186074.69116.5543.4%0.2220.821 OSA−ckjmdiff−1001891.74011.0259.6%0.0720.909 Moose−ckjmdiff−611146−2.95−115.3039.6%0.1580.727