Contents lists available atScienceDirect
The Journal of Systems & Software
journal homepage:www.elsevier.com/locate/jss
An automatically created novel bug dataset and its validation in bug prediction
Rudolf Ferenc
a,∗, Péter Gyimesi
a, Gábor Gyimesi
a, Zoltán Tóth
a, Tibor Gyimóthy
a,baDepartment of Software Engineering, University of Szeged, Hungary
bMTA-SZTE Research Group on Artificial Intelligence, Szeged, Hungary
a r t i c l e i n f o
Article history:
Received 26 July 2019
Received in revised form 30 April 2020 Accepted 4 June 2020
Available online 7 June 2020 Keywords:
Bug dataset Bug prediction Static code analysis Code metrics Machine learning GitHub
a b s t r a c t
Bugs are inescapable during software development due to frequent code changes, tight deadlines, etc.;
therefore, it is important to have tools to find these errors. One way of performing bug identification is to analyze the characteristics of buggy source code elements from the past and predict the present ones based on the same characteristics, using e.g. machine learning models. To support model building tasks, code elements and their characteristics are collected in so-called bug datasets which serve as the input for learning.
We present theBugHunter Dataset: a novel kind of automatically constructed and freely available bug dataset containing code elements (files, classes, methods) with a wide set of code metrics and bug information. Other available bug datasets follow the traditional approach of gathering the characteristics of all source code elements (buggy and non-buggy) at only one or more pre-selected release versions of the code. Our approach, on the other hand, captures the buggy and the fixed states of the same source code elements from the narrowest timeframe we can identify for a bug’s presence, regardless of release versions. To show the usefulness of the new dataset, we built and evaluated bug prediction models and achieved F-measure values over 0.74.
©2020 The Authors. Published by Elsevier Inc. This is an open access article under the CC BY-NC-ND license (http://creativecommons.org/licenses/by-nc-nd/4.0/).
1. Introduction
The characterization of buggy source code elements is a popu- lar research area these days. Programmers tend to make mistakes despite the assistance provided by different integrated develop- ment environments, and errors may also occur due to frequent changes in the code and inappropriate specifications; therefore, it is important to get more and/or better tools to help the au- tomatic detection of errors (Johnson et al.,2013). For automatic recognition of unknown faulty code elements, it is a prerequisite to characterize the already known ones.
During software development, programmers use a wide va- riety of tools, including bug tracking, task management, and version control systems. There are numerous commercial and open-source software systems available for these purposes. Fur- thermore, different web services are built to meet these needs.
The most popular ones like SourceForge, Bitbucket, and GitHub fulfill the above mentioned functionalities. They usually provide several services, such as source code hosting and user manage- ment. Their APIs make it possible to retrieve various kinds of data,
∗ Correspondence to: H-6720 Szeged, Dugonics tér 13, Hungary.
E-mail addresses: ferenc@inf.u-szeged.hu(R. Ferenc),
pgyimesi@inf.u-szeged.hu(P. Gyimesi),ggyimesi@inf.u-szeged.hu(G. Gyimesi), zizo@inf.u-szeged.hu(Z. Tóth),gyimothy@inf.u-szeged.hu(T. Gyimóthy).
e.g., they provide support for the examination of the behavior or the co-operation of users or even for analyzing the source code itself. Since most of these services include bug tracking, it raises the idea to use this information in the characterization of buggy source code parts (Zhou et al., 2012). To do so, the bug reports managed by these source code hosting providers must be connected to the appropriate source code parts (Wu et al., 2011). A common practice in version control systems is to describe the changes in a comment belonging to a commit (log message) and often provide the identifier of the associated bug report which the commit is supposed to fix (Kalliamvakou et al.,2014). This can be used to identify the faulty versions of the source code (Dallmeier and Zimmermann,2007a,b). Processing diff files can help us obtain the code sections affected by the bug (Toth et al.,2013). We can use source code metrics (Couto et al.,2012), for which we only need a tool that is able to produce them.
To build a dataset containing useful buggy code element char- acterization information, we chose GitHub, since it hosts several regularly maintained projects and also a well defined API that makes it possible to implement an automatic data retrieval tool.
We selected 15 Java projects as our subject systems, which differ in many ways from each other (size, domain, number of bugs reported) to cover a wide and general set of systems.
https://doi.org/10.1016/j.jss.2020.110691
0164-1212/©2020 The Authors. Published by Elsevier Inc. This is an open access article under the CC BY-NC-ND license (http://creativecommons.org/licenses/by- nc-nd/4.0/).
Previously published datasets follow a traditional concept to create a dataset that serves as a benchmark for testing bug pre- diction techniques (D’Ambros et al.,2010;Jureczko and Madeyski, 2010). These datasets include all code elements – both buggy and non-buggy – from one or more versions of the analyzed system. In this work, we created a new approach that collects before-fix and after-fix snapshots of source code elements (and their characteristics) that were affected by bugs and does not consider those code elements that were not touched by bugs. This kind of dataset helps to capture the changes in software product metrics when a bug is being fixed. Thus, we can learn from the differences in source code metrics between faulty and non-faulty code elements. As far as we know, there exists no other bug dataset yet that tries to capture this before-fix and after-fix state.
Our new dataset is called BugHunter Dataset and it is freely available (see Section5.8). It can serve as a new kind of bench- mark for testing different bug prediction methods since we in- cluded a wide range of source code metrics to describe the previously detected bugs in the chosen systems. We took all re- ported bugs stored in the bug tracking system into consideration.
We used the usual methodology of connecting commits to bugs by analyzing the log messages and by looking for clues that would unambiguously identify the bug that was the intended target of the corresponding fixing commit(s). Commit diffs helped us detect which source code elements were modified by a given change set, thus the code elements which had to be modified in order to fix the bug.
The first version of this work was published in our earlier conference paper (Gyimesi et al., 2015). Since then, we have extended the list of subject projects (one project was replaced because it contained template files with.java extension which undermined the source code analysis) and we have also expanded the time interval of the analysis of the projects’ history to cover three additional years (from 2014 to 2017). Furthermore, we have refined our technique and we have incorporated method level bug information into our dataset as well. The dataset we present in this paper has not been published before.
Here we also performed experiments to check whether our novel dataset is suitable for bug prediction purposes. During this investigation, we collected bug characterization metrics at three source code levels (file, class, method). After the dataset was constructed, we used different machine learning algorithms to analyze the usefulness of the dataset.
We also performed a novel kind of experiment in which we assessed whether the method level metrics are better predic- tors when projected to class level than the class level metrics themselves.
An important aspect to investigate is how the bug prediction models built from the novel dataset compare to the ones which used the traditional datasets as corpus. However, this comparison is hard in its nature due to the variability in multiple factors.
One major problem is the difference in the corpus itself. The list of the included projects vary from dataset to dataset. In our previous work, we constructed a traditional dataset, theGitHub Bug Dataset (Tóth et al.,2016), which consists of the same 15 projects we also included in our novel bug dataset. This gives an opportunity to assess if there is any difference in the bug prediction capabilities of these two datasets.
To emphasize the research artifact contribution and the re- search questions, we highlighted them in the following box.
Research artifact:A freely available novel dataset containing source code metrics of buggy Java source code elements (file, class, method) before and after bug fixes were applied to them.
RQ1:Is the constructed dataset usable for bug prediction purposes?
RQ2: Are the method level metrics projected to class level better predictors than the class level metrics themselves?
RQ3:Is the BugHunter Dataset more powerful and expressive than the GitHub Bug Dataset, which is constructed with the traditional approach?
The rest of the paper is structured as follows. In Section2we discuss related work. We present some statistics about GitHub and the projects that we have chosen for this work in Section3.
Next, we introduce the metrics used for bug characterization in Section4. We describe our approach for generating and validating the dataset in detail in Section5. Then, we evaluate it by applying different machine learning algorithms in Section 6, where we also address our research questions. In Section7, we present the threats to validity. Finally, we conclude and describe some future work directions in Section8.
2. Related work
2.1. Bug localization and source code management
Many approaches have been presented dealing with bug char- acterization and localization (Saha et al., 2013; Wang and Lo, 2014;Davies et al.,2012). Zhou et al. published a study describing BugLocator (Zhou et al., 2012), a tool that detects the relevant source code files that need to be changed in order to fix a bug.
BugLocator uses textual similarities (between initial bug report and the source code) to rank potentially fault-prone files. Prior information about former bug reports is stored in a bug database.
Ranking is based on the assumption that descriptions with high similarities imply that the related files are highly similar too. A similar ranking is done by Rebug-Detector (Wang et al.,2010), a tool made by Wang et al. for detecting related bugs from source code using bug information. The tool focuses on overridden and overloaded method similarities. In our study, we constructed a dataset that stores information about formerly buggy code ele- ments that are now fixed, thus the same method could be applied by using source code metrics for detecting similar source code elements that are possibly fault-prone.
ReLink (Wu et al., 2011) was developed to explore missing links between code changes committed in version control sys- tems and the fixed bugs. This tool could be helpful for software engineering research based on linkage data, such as software defect prediction. ReLink mines and analyzes information like bug reporter, description, comments, and date from a bug tracking database and then tries to pair the bug with the appropriate source code files based on the set of source code information ex- tracted from a version control system. Most of the studies dealing with this kind of linkage data use the SZZ algorithm, which has been improved over the years (Kim et al., 2006; Williams and Spacco,2008). This approach uses file level textual features to ex- tract extra information between bugs and the source code itself.
We characterized the set of bugs in a given system at file, class, and method levels by assigning different source code metrics to the source code elements (methods, classes, and files) affected by bugs. Other approaches try to link information retrieved from only version control and bug tracking systems (Fischer et al., 2003;Mockus and Votta,2000).
Kalliamvakou et al. mined GitHub repositories to investi- gate their characteristics and their qualities (Kalliamvakou et al., 2014). They presented a detailed study discussing different project characteristics, such as (in)activity, while also involving
further research questions – e.g., whether a project is standalone or part of a more massive system. Results showed that the ex- tracted data can serve as a good input for various investigations, however one must use them with caution and always verify the usefulness and reliability of the data. It is a good practice to choose projects with many developers and commits, but it should always be kept in mind that the most important point is to choose projects that fit well for one’s own purpose. In our case, we have tried to create a dataset that is large, reliable (through some manual validation) and general enough for testing different bug prediction techniques (Catal and Diri,2009; Porter et al.,1990;
Ostrand et al.,2005;Ma et al.,2006;Zhou and Leung,2006), while still being created in an automatic way.
Mining software repositories can be a harsh task when an automatic mechanism is used to construct a large set of data based on the information gathered from a distributed software repository. As we used GitHub to address our research questions, we paid extra attention to prevent and avoid pitfalls.Bird et al.
(2009) presented a study on distributed version control systems – focusing mainly on Git – that examined their usage and the available set of data (such as whether the commits are removable, modifiable, movable). The main purpose of the paper was to draw attention to pitfalls and help researchers to avoid them during the processing and analysis of a mined information set.
Many research papers showed that using a bug tracking sys- tem improves the quality of the software system under devel- opment. Bangcharoensap et al. introduced a method to locate the buggy files in a software system very quickly using the bug reports managed by the bug tracking system (Bangcharoensap et al.,2012). The presented method contains three different ap- proaches to rank the fault-prone files, namely: (a) Text mining, which ranks files based on the textual similarity between a bug report and the source code itself, (b) Code mining, which ranks files based on prediction of the potential buggy module using source code product metrics, and (c) Change history, which ranks files based on prediction of the fault-prone module using change process metrics. They used the gathered project data collected on the Eclipse platform to investigate the efficiency of the proposed approaches and showed that they are indeed suitable to locate buggy files. Furthermore, bug reports with a short description and many specific words greatly increase the effectiveness of finding the ‘‘weak points’’ of the system.
Similarly to our study, Ostrand et al. investigated fault predic- tion by using source code metrics. However, only file level was considered as the finest granularity unit (Ostrand et al.,2007), while we have built a toolchain to also support class and method levels.
In addition to the above presented methods, a significant change in source code metrics can also indicate that the rele- vant source code files contain potential bugs (Gyimothy et al., 2005). Couto et al. presented a paper that shows the possible relationship between changed source code metrics (used as pre- dictors) and bugs as well (Couto et al.,2012). They described an experiment to discover more robust evidences towards causality between software metrics and the occurrence of bugs. Although our method does not include this specific information, we still aim to show that considering methods as basic elements and including them in a dataset is also a way for building a working corpus for bug prediction techniques.
2.2. Public datasets
The previously mentioned approaches use self-made datasets for their own purposes, as illustrated in the work of Kalliamvakou et al. too (Kalliamvakou et al.,2014). Bug prediction techniques and approaches can be presented and compared in different
ways; however, there are some basic points that can serve as common components (Li et al.,2018). One common element can be a dataset used for the evaluation of the various approaches.
PROMISE(Shirabad and Menzies,2005) is a repository of datasets out of which several ones contain bugs gathered from open- source and also from closed-source industrial software systems.
Amongst others it includes the NASA MDP dataset, which was used in many research studies and also criticized for contain- ing erroneous data (Shepperd et al., 2013; Petrić et al., 2016).
The PROMISE repository also contains an extensively referenced dataset created byJureczko and Madeyski(2010), which provides object-oriented metrics as well as bug information for the source code elements (classes). This latter one includes open-source projects such as Apache Ant, Apache Camel, JEdit, Apache Lucene, forming a dataset containing 48 releases of 15 projects. The main purpose of these datasets is to support prediction methods and summarize bugs and their characterizations extracted from various projects. Many research papers used datasets from the PROMISE repository as an input for their investigations.
A similar dataset for bug prediction came to be commonly known as theBug prediction dataset1(D’Ambros et al.,2010). The reason for creating this dataset was mainly inspired by the idea of measuring the performance of the different prediction models and also comparing them to each other. This dataset handles the bugs and the relevant source code parts at class level, i.e., the bugs are assigned to classes. As we have already mentioned, we do not only focus on file and class levels, but on method-level elements as well.
Zimmermann et al.(2007) used Eclipse as the input for a study dealing with defect prediction. They investigated whether the complexity metrics have the power to detect fault prone points in the system at package and file level. During the study, they constructed a public dataset2 that is still available. It contains different source code metrics and a subset of the files/packages is marked as ‘‘buggy’’ if it contained any bugs in the interval between two releases.
A recent study showed that code smells also play a significant role in bug prediction (Hall et al., 2014) but the constructed dataset is not public. In our dataset, we also include code smell metrics to enhance its usefulness.
iBUGS(Dallmeier and Zimmermann,2007b) provides a com- plex environment for testing different automatic defect localiza- tion methods. Information describing the bugs comes from both version control systems and from bug tracking systems. iBUGS used the following three open-source projects to extract the bugs from (the numbers of extracted bugs are in parentheses):
AspectJ — an extension for the Java programming language to support aspect oriented programming (223); Rhino — a JavaSript interpreter written in Java (32); and Joda-Time — a quality re- placement (extension) for the Java date and time classes (8). The authors attempted to generate the iBUGS dataset in an automatic way and they compared the generated set to the manually val- idated set of bugs (Dallmeier and Zimmermann,2007a). iBUGS is a framework aimed more towards bug localization and not a standalone dataset containing source code elements and their characterizations (i.e., metrics).
TheBugcatchers (Hall et al.,2014) dataset is created by Hall et al. which is not only a bug dataset, but also contains bad smells detected in the subject systems. The selected three systems are Eclipse JDT Core, ArgoUML, and Apache Commons. The dataset is built and evaluated at file level.
1 http://bug.inf.usi.ch/.
2 https://www.st.cs.uni-saarland.de/softevo/bug-data/eclipse/.
Table 1
Comparison of the two types of datasets.
Feature Traditional Novel
Included time interval
Usually 6 months Entire project history
Included source code elements
All the elements from a single version
Only the modified elements right before and after bug-fixes Assumptions Source code elements that
are not included in any bug-fix are non-faulty
No assumptions needed
Uncertainty The source code elements are faulty in the latest release version before the bug-fix and non-faulty after the fix
The source code elements are faulty right before the bug-fix and fixed afterwards
The ELFF dataset (Shippey et al., 2016) is a recent dataset proposed by Shippey et al. They experienced that only a few method level datasets exist, thus they created a dataset whose entries are methods. Additionally, they also made class level datasets publicly available. They used Boa (Dyer et al.,2013) to mine SourceForge repositories and collect as many candidates as they can, selecting 23 projects out of 50,000 that fulfilled their criteria (number of closed bugs, bugs are referenced from commits, etc.). They only kept projects with SVN version control systems which narrows down their candidate set. They used the classic and well-defined SZZ algorithm (Śliwerski et al.,2005) to find linkage between bugs and the corresponding source code elements.
The Had-oops! dataset (Harman et al., 2014) is constructed by a new approach presented by Harman et al. They analyzed 8 consecutive Hadoop versions and investigated the impact of chronology on fault prediction performance. They used Support Vector Machines (SVMs) with the Genetic Algorithm (for con- figuration) to build prediction models at class level. For a given version, they constructed a prediction model from all the previous versions and a model from only the current version and compared which one performed better. Results are not straightforward since they found early versions preferable in many cases as opposed to models built on recent versions. Moreover, using all versions is not always better than using only the current version to build a model from.
The Mutation-aware fault prediction dataset is a result of an experiment carried out by Bowes et al. on using mutation metrics as independent variables for fault prediction (Bowes et al.,2016).
They used 3 software systems from which 2 projects (Eclipse and Apache) were open-source and one was closed. They used the popular PITest (or simply, PIT (Coles, 2018)) to obtain the set of mutation metrics that were included in the final dataset.
Besides the mutation metrics, some static source code metrics (calculated byJHawk (2018)) were also included in the dataset for comparison purposes. This dataset is also built at class level.
TheGitHub Bug Datasetis a recent dataset that includes class and file level static source code metrics (Tóth et al.,2016) for 15 Java systems gathered from GitHub. Besides size, documentation, object-oriented, and complexity metrics, the dataset also contains code duplication and coding rule violation metrics. This dataset is our previous work that was still constructed in the ‘‘traditional’’
way. In Table 2, we compare the main characteristics of the mentioned datasets.
Our goal was to pick the strong aspects of all the previ- ous datasets and put them together, as its positive effects are described by Li et al. (2019). Although the discussed works successfully made use of their datasets, an extended dataset can serve as a good basis for further investigations. Our dataset in- cludes various projects from GitHub and includes numerous static source code metrics and stores a large number of entries in fine granularity (file, class, and method level as well). Furthermore, we also experimented with chronology, although in a different way compared toHarman et al.(2014). The differences between the traditional datasets and the proposed novel dataset are summa- rized inTable 1. See Section5.2 for details about the process of selecting the bug related data for the novel dataset. The detailed comparison can be found in Section6.3.
3. Data source
To address our research objectives, this section briefly intro- duces the version control system used (Git), its corresponding source code hosting service (GitHub), and their main function- alities that are closely related to the creation of linkage data between bugs and source code elements. Afterwards, we enu- merate the chosen projects and give some further insight on the reasons why we chose them as our subject systems.
3.1. GitHub
GitHub is one of today’s most popular source code hosting services. It is used by several major open-source teams for man- aging their projects like Node.js, Ruby on Rails, Spring Framework, Zend Framework, and Jenkins, among others. GitHub offers public and private Git repositories for its users, with some collaborative services, e.g., built-in bug and issue tracking systems.
Bug reporting is supported by the fact that any GitHub user can add an issue, and collaborators can even label these issues for further categorization. The system provides some basic labels, such as ‘‘bug’’, ‘‘duplicate’’, and ‘‘enhancement’’, but these tags can be customized if required. In an optimal case, the collaborators review these reports and label them with the proper labels, for instance, the bug reports with the ‘‘bug’’ label. The most impor- tant feature of bug tracking is that we can refer to an issue from the log message of a commit by using the unique identifier of the issue, thereby identifying a connection between the source code
Table 2
Comparison of the datasets.
Project Level of bugs Bug characteristics # of projects
NASA MDP Dataset Class Static source code metrics 11
Jureczko Dataset Class Static source code metrics 15
Bug prediction dataset Class Static source code metrics, process metrics 5
Eclipse dataset File, package Complexity metrics 1
iBUGS N/A Bug-fix size properties, AST fingerprints 3
Bugcatchers File Code smells 3
ELFF Class, method Static source code metrics 23
Had-oops! Class Static source code metrics 1
Mutation-aware fault prediction dataset Class Static source code metrics, mutation metrics 3
GitHub Bug Dataset File, class Static source code metrics, code duplication metrics, code smell metrics 15 Novel dataset File, class, method Static source code metrics, code duplication metrics, code smell metrics 15
Table 3
The number of repositories created between 01-01-2013 and 07-09-2017 for the top 10 languages.
Language Number of repositories
JavaScript 2,019,215
Java 1,465,168
Ruby 1,379,225
Python 1,014,760
PHP 983,479
C 737,314
C++ 619,914
CSS 568,493
C# 282,092
Shell 263,350
and the reported bug. GitHub has an API3 that can be used for managing repositories from other systems, or query information about them. This information includes events, feeds, notifications, gists, issues, commits, statistics, and user data.
With the GitHub Archive4 project that also uses this API, we can get up-to-date statistics about the public repositories. For instance, Table 3 presents the number of repositories created between 1 January 2013 and 7 September 2017, grouped by the main programming languages they use (only the top 10 languages are shown). Our approach uses Java repositories (the second most used platform on GitHub) to gather a proper information base for constructing a bug dataset.
Although extracting basic information from GitHub is easy, some version control features are hard to deal with, especially during the linking process when we try to match source code elements to bugs. For example, Git provides a powerful branching mechanism by supporting the creation, deletion, and selection of branches. In our case, we have to handle different branches because a fixing commit most often occurs on other – so called
‘‘topic’’ – branches and not on the master branch. Fortunately, the projects we analyzed often solved this problem by merging.
During the merge, isomorphic commits are generated and placed on the master branch, thus all the desired analysis can be done by taking only the master branch with a given version as input.
Another example is forking a repository, which is used world- wide. In our experiment, we do not handle forks, since it would have encumbered the above mentioned linking process and we would not gain significant additional information since bugs are often corrected in the original repository. These details can be viewed as our underlying assumptions regarding the usage of GitHub.
3.2. The chosen projects
We considered several criteria when searching for appropriate projects on GitHub. First of all, we searched for projects written in Java, especially larger ones, because those are more suitable for this kind of analysis. It was also important to have an adequate number of issues labeled as bugs, and the number of references from the log messages to certain commits is also a crucial factor (this is how we can link source code elements to bugs). Addi- tionally, we preferred projects that are still actively maintained.
Logged-in users can give a star for any repository and bookmark selected ones to follow. The number of stars and watches applied to repositories forms a ranking between them, which we will refer to as ‘‘popularity’’ in the following. We performed our search for candidate projects mainly based on popularity and activity.
We also found many projects during the search that would have 3 https://developer.github.com/v3/.
4 https://www.gharchive.org/.
fulfilled most aspects, had the developers not used an external bug tracker system — something we could not support yet.
In the end, we selected the 15 projects listed inTable 4based on the previously mentioned criteria. As the descriptions show, these projects cover different domains; a good practice when the goal is creating a general dataset. The table contains the following additional data about the projects:
Stars the number of stars a project received on GitHub Forks the number of forks of a project on GitHub
kLOC the thousand lines of code a project had at September, 2017
Recently, the repository of the Ceylon project was moved to a new location and the old repository is not available anymore. Due to this reason we could not obtain the total number of stars and the total number of forks of this repository, resulting the low values in the table.
Besides knowing each project’s domain, further descriptors can help us get a more precise understanding. Table 5provides a more accurate picture of the projects by showing different characteristics (related to the repositories) for each project. This table sums up the occurrences of various bug reports and com- mits of the projects present at September, 2017. Considering the total number of commits (TNC) is a good starting point to show the scale and activity of the projects. The number of commits referencing a (closed) bug (NCRB) shows how many commits out of TNC referenced a bug by using the pattern ‘#x’ in their commit log messages, wherexis a number that uniquely identifies the proper issue that is labeled as a bug (Mockus and Votta,2000).
NCBR (Number of Closed Bug Reports) is also important, since we only consider closed bug reports and the corresponding commits in this context. The abbreviations we used stand for the following:
TNC Total Number of Commits
NCRB Number of Commits Referencing a Bug NBR Number of Bug Reports
NOBR Number of Open Bug Reports NCBR Number of Closed Bug Reports
ANCBR Average Number of Commits per closed Bug Reports (NCRB/NCBR)
It is apparent that the projects are quite different according to the number of bug reports and the lines of code they have. NCRB is always lower than NCBR except in three cases (ANTLR v4, Oryx, Broadleaf Commerce) which means that not all bug reports have at least one referencing commit to fix the bug. This is possible since closing a bug is viable not only from a commit but directly from GitHub’s Web user interface without committing anything.
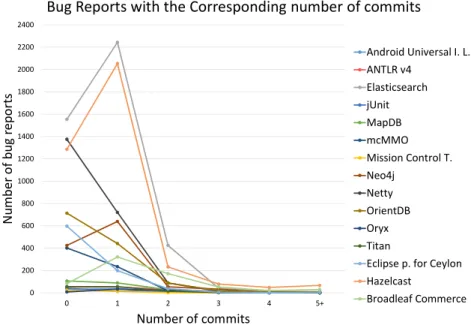
Fig. 1 depicts the number of commits for each closed bug report. One insight here is that the rate of closed bug reports is high where not even a single commit is present to fix the bug.
There are several possible causes for this, for example, the bug report is not referred from the commit’s log message, or the error has already been fixed.
Fig. 2shows the ratio of the number of commits per projects, illustrating the activity and the size of the projects. Neo4j is dom- inant if we consider only the number of commits, however bug report related activities are slight. The presented figures show the variability of the selected software systems, which ensures the construction of a heterogeneous dataset.
Table 4
The selected projects and their descriptions.
Project name Description
Stars Forks kLOC
Android Universal Image Loadera
An Android library that assists the loading of images.
16,521 6357 13
ANTLR v4b A popular software in the field of language processing.
It is a powerful parser generator for reading, processing, executing, or translating structured text or binary files.
6030 1559 68
Elasticsearchc
A popular RESTful search engine.
42,685 14,303 995
jUnitd
A Java framework for writing unit tests.
7536 2826 43
MapDBe
A versatile, fast and easy to use database engine in Java.
3700 745 68
mcMMOf
An RPG game based on Minecraft.
511 448 42
Mission Control Technologiesg Originally developed by NASA for the space flight operations. It is a real-time monitoring and visualization platform that can be used for monitoring any other data as well.
818 280 204
Neo4jh
The world’s leading graph database with high performance.
6643 1636 1027
Nettyi
An asynchronous event-driven networking framework.
20,006 9128 380
OrientDBj A popular document-based NoSQL graph database.
Mainly famous for its speed and scalability.
3919 792 621
Oryx 2k An open-source software with machine learning
algorithms that allows the processing of huge datasets.
1633 388 34
Titanl
A high-performance, highly scalable graph database.
4931 1015 108
Eclipse plugin for Ceylonm
An Eclipse plugin which provides a Ceylon IDE.
56 30 181
Hazelcastn
A platform for distributed data processing.
3211 1169 949
Broadleaf Commerceo
A framework for building e-commerce websites.
1266 1020 322
ahttps://github.com/nostra13/Android-Universal-Image-Loader.
bhttps://github.com/antlr/antlr4.
chttps://github.com/elastic/elasticsearch.
dhttps://github.com/junit-team/junit4.
ehttps://github.com/jankotek/MapDB.
fhttps://github.com/mcMMO-Dev/mcMMO.
ghttps://github.com/nasa/mct.
hhttps://github.com/neo4j/neo4j.
ihttps://github.com/netty/netty.
jhttps://github.com/orientechnologies/orientdb.
khttps://github.com/OryxProject/oryx.
lhttps://github.com/thinkaurelius/titan.
mhttps://github.com/eclipse/ceylon-ide-eclipse.
nhttps://github.com/hazelcast/hazelcast.
ohttps://github.com/BroadleafCommerce/BroadleafCommerce.
4. Metrics
A software metric is a quantified measure of a property of a software project. By using a set of different metrics, we can measure the properties of a project objectively from various points of view. Metrics can be obtained from the source code, from the project management system, or even from the execution traces of the source code. We can deduce higher-level software characteristics from lower level ones (Bakota et al.,2011), such as the maintainability of the source code or the distribution of defects, but they can be also used to build a cost estimation model, apply performance optimization, or to improve activities supporting software quality (Boehm et al.,2000;Bán et al.,2018;
Bán and Ferenc,2014). In this work, we used static source code metrics (also known as software product metrics).
The area of object-oriented source code metrics has been researched for many years (Chidamber and Kemerer,1994;Basili et al., 1996; Bruntink and Van Deursen, 2004), thus no won- der that several tools exist for measuring them. These tools are suitable for detailed examination of systems written in vari- ous programming languages. The source code metrics provide information about the size, inheritance, coupling, cohesion, or complexity of the code. We used theOpenStaticAnalyzer5tool to obtain various software product metrics for the selected systems.
5 https://github.com/sed-inf-u-szeged/OpenStaticAnalyzer.
Fig. 1. The number of bug reports with the corresponding number of commits.
Fig. 2. The number of commits per projects.
Table 5
Statistics about the selected projects.
TNC NCRB NBR NOBR NCBR ANCBR
Android Universal I. L. 1,025 52 90 15 75 0.69
ANTLR v4 6,526 162 179 23 156 1.04
Elasticsearch 28,815 2,807 4,494 207 4,287 0.65
jUnit 2,192 72 90 6 84 0.86
MapDB 2,062 167 244 16 228 0.73
mcMMO 4,765 268 664 8 656 0.41
Mission Control T. 977 15 46 9 37 0.40
Neo4j 49,979 781 1,268 116 1,152 0.68
Netty 8,443 956 2,240 33 2,207 0.43
OrientDB 15,969 722 1,522 250 1,272 0.57
Oryx 1,054 69 67 2 65 1.06
Titan 4,434 93 135 8 127 0.73
Eclipse p. for Ceylon 7,984 316 923 82 841 0.38
Hazelcast 24,380 3,030 3,882 120 3,762 0.81
Broadleaf Commerce 14,920 1,051 703 28 675 1.56
The full list of the object-oriented metrics we used is shown in Table 6. The last three columns of the table indicate the kind
of elements the given metric is calculated for, namely method, class, and file. The presence of ‘X’ indicates that the metric is calculated for the given source code level. Most of the blanks in the table come from the fact that the metric is defined only for a given level. For instance, Weighted Methods per Classcan- not be interpreted for methods and files. Other blanks come from the limitations of the used static source code analyzer (i.e. OpenStaticAnalyzer).
One special metric category is provided by source code dupli- cation detection (Roy et al.,2009). OpenStaticAnalyzer is able to detect Type-1 (exact copy of code, not considering white spaces and comments) and Type-2 clones (syntactically identical copy of code where variable, function or type identifiers can be different;
also not considering white spaces and comments) in software systems (Bellon et al.,2007) and also supports clone management tasks, such as:
• Clone tracking: clones are tracked during the source code analysis of consecutive revisions of the analyzed software system.
• Calculating clone metrics: a wide set of clone related metrics is calculated to describe the properties of a clone in the system (for example, risk of a clone or the effort needed to eliminate the clone from the system).
Basic clone related metrics that are calculated for methods and classes are presented inTable 7.
OpenStaticAnalyzer also provides a coding rule violation de- tection module. The presence of rule violations in a source code element can cause errors (Boogerd and Moonen,2008) in a later phase (can easily be a ticking bomb); thus the number of different rule violations located in the source code element can serve as good predictors and the dataset encapsulates this information too.
5. Dataset creation
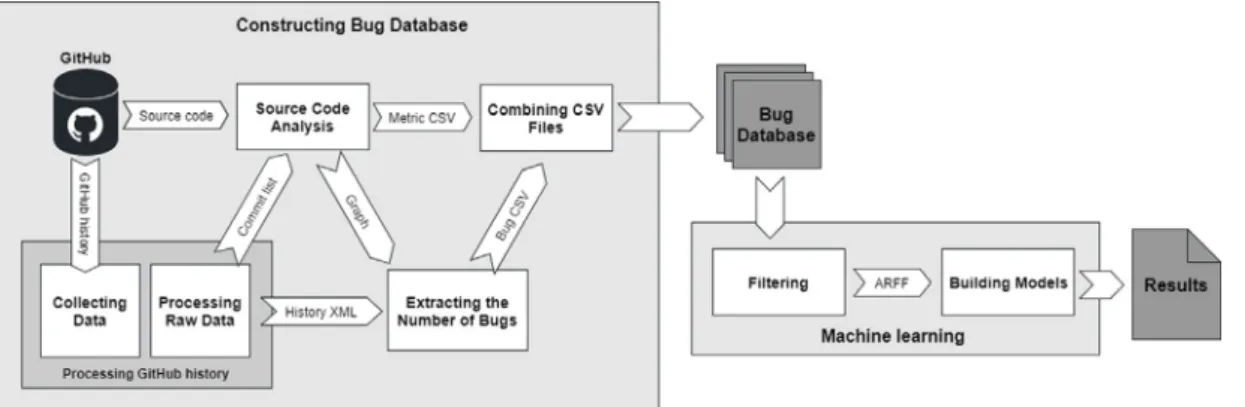
In this section, we introduce the methodology we used to create the dataset. We carried out the data processing in multiple steps using the toolchain shown in Fig. 3. Each of these steps – and their corresponding components – are detailed in their dedicated sections below.
Table 6
Source code metrics used for characterization.
Abbreviation Full name Method Class File
CLOC Comment Lines of Code X X X
LOC Lines of Code X X X
LLOC Logical Lines of Code X X X
NL Nesting Level X X
NLE Nesting Level Else-If X X
NII Number of Incoming Invocations X X
NOI Number of Outgoing Invocations X X
CD Comment Density X X
DLOC Documentation Lines of Code X X
TCD Total Comment Density X X
TCLOC Total Comment Lines of Code X X
NOS Number of Statements X X
TLOC Total Lines of Code X X
TLLOC Total Logical Lines of Code X X
TNOS Total Number of Statements X X
McCC McCabe’s Cyclomatic Complexity X X
PDA Public Documented API X X
PUA Public Undocumented API X X
HCPL Halstead Calculated Program Length X
HDIF Halstead Difficulty X
HEFF Halstead Effort X
HNDB Halstead Number of Delivered Bugs X
HPL Halstead Program Length X
HPV Halstead Program Vocabulary X
HTRP Halstead Time Required to Program X
HVOL Halstead Volume X
MIMS Maintainability Index (Microsoft version) X MI Maintainability Index (Original version) X MISEI Maintainability Index (SEI version) X MISM Maintainability Index (SourceMeter version) X
NUMPAR Number of Parameters X
LCOM5 Lack of Cohesion in Methods 5 X
WMC Weighted Methods per Class X
CBO Coupling Between Object classes X
CBOI Coupling Between Object classes Inverse X
RFC Response set For Class X
AD API Documentation X
DIT Depth of Inheritance Tree X
NOA Number of Ancestors X
NOC Number of Children X
NOD Number of Descendants X
NOP Number of Parents X
NA Number of Attributes X
NG Number of Getters X
NLA Number of Local Attributes X
NLG Number of Local Getters X
NLM Number of Local Methods X
NLPA Number of Local Public Attributes X
NLPM Number of Local Public Methods X
NLS Number of Local Setters X
NM Number of Methods X
NPA Number of Public Attributes X
NPM Number of Public Methods X
NS Number of Setters X
TNA Total Number of Attributes X
TNG Total Number of Getters X
TNLA Total Number of Local Attributes X
TNLG Total Number of Local Getters X
TNLM Total Number of Local Methods X
TNLPA Total Number of Local Public Attributes X TNLPM Total Number of Local Public Methods X
TNLS Total Number of Local Setters X
TNM Total Number of Methods X
TNPA Total Number of Public Attributes X
TNPM Total Number of Public Methods X
TNS Total Number of Setters X
5.1. Collecting data
First, we save data about the selected projects via the GitHub API. This is necessary, because while the data is continuously
Table 7
Clone metrics used for characterization.
Abbreviation Full name
CC Clone Coverage
CCL Clone Classes
CCO Clone Complexity
CI Clone Instances
CLC Clone Line Coverage
CLLC Clone Lines of Code
LDC Lines of Duplicated Code
LLDC Logical Lines of Duplicated Code
changing on GitHub due to the activities in the projects, we need a consistent data source for the analysis. The data we save includes the list of users assigned to the repository (Contributors), the open and closed bug reports (Issues), and all of the commits.
For open issues, we stored only the date of their creation. For closed issues, we stored the creation date, closing date, and the hash of the fixing commits with their commit dates. Additionally, we focused exclusively on bug related issues, so closed bugs that were not referenced from any commit were not stored.
This filtering is based on the issue labels provided by GitHub and the set of labels we manually selected for each project. The data we stored about the commits includes the identifier of the contributor, the parent(s) of the commit, and the affected files with their corresponding changes. All this raw information is stored in an XML format, ready for further processing.
5.2. Processing raw data
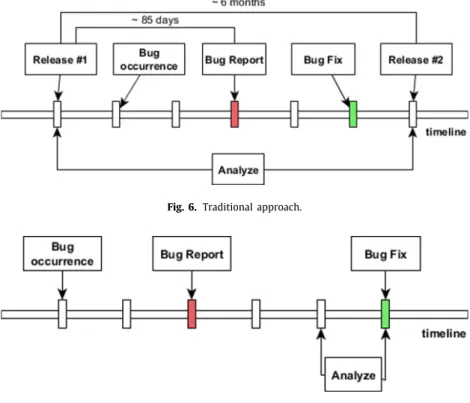
While the data saved from GitHub includes all commits, we only need the ones that relate to the bug reports. These commits are then divided into different subsets, as depicted inFig. 4. Green nodes are directly referencing the bug report (fixing intention).
Gray nodes are commits applied between the first fix and the last fix but not referencing the bug id in their commit log messages.
One extra commit taken into consideration is the one right before the first fix (colored with orange). This commit holds the state when the source code is buggy (not fixed yet), thus a snapshot (source code analysis) will be performed at that point too. Al- though the orange node represents the latest state where the bug is not fixed yet, the blue nodes also contain the bug so we mark the source code elements as buggy in these versions too. These blue markings are important for distinguishing commits that are involved in multiple bugs at the same time.
We have to perform code analysis on the orange and green commits to construct dataset entries. Two entries are created for every source code element they contain: one with the state (metrics) right before the fix was applied, and one with the state when the bug was fixed. At green commits except the last one, we do not need to perform a full code analysis, since at those points we are only interested in extracting the affected source code elements. Amongst the selected commits, some further ones can occur that need to be removed because they are no longer available through Git (deleted, merged). Moreover, we do not only search for links from the direction of commits but also from the direction of issues (bug reports). When considering a bug report, we can find a commit id showing that the bug was closed in that specific commit. At this point, the full list is constructed as a text file, which has all the commit ids (hash) for a selected project to undergo static analysis.
5.3. Source code analysis
After gathering the appropriate versions of the source code for a given project, feature extraction can begin. This component wraps the results of the OpenStaticAnalyzer tool that computes the source code metrics and determines the positions of the
Fig. 3. The components of the process.
Fig. 4. The relationship between the bug reports and commits.
source code elements. Results are generated in a graph format, which contains the files, classes, and methods with the computed data that includes different software product metrics (described in Section 4). At this point we have all the raw data desired, including the source code elements located in the project and all the bug related information.
5.4. Extracting the number of bugs
The next step is to link the two datasets – the results of the code analysis and the data gathered from GitHub – and extract the characteristics of the bugs. Here, we determine the source code elements affected by the commits and the number of bugs in each commit for file, class, and method levels.
To determine the affected source code parts, an approach similar to the SZZ algorithm (Williams and Spacco,2008) is used.
However, we do not want to detect the fix inducing commits, only the mapping between the fixing code snippets and source code elements. For this purpose, we used the diff files – from the GitHub data we saved – that contain the differences between two source code versions in a unified diff format. An example unified diff file snippet is shown below.
--- /path/to/original’’timestamp’’
+++ /path/to/new’’timestamp’’
@@ -1,4 +1,4
@@+Added line -Deleted line
This part of the
document has stayed the
same
Each diff contains a header information specifying the start- ing line number and the number of affected lines. Using this information, we can get the range of the modification (for a given file pair: original and new). To obtain a more accurate result, we subtracted the unmodified code lines from this range.
Although the diff files generated by GitHub contain additional information about which method is affected, it does not carry enough information because the difference can affect multiple source code elements (overlapping cases that are not handled by GitHub). Thus, there is no further task but to examine the source code elements in every modified file and identify which ones of them are affected by the changes. The method uses the source code element positions, i.e., source line mappings from the output of the OpenStaticAnalyzer tool. We identified the source code elements by their fully qualified names that involve the name of the package, the class, the method, the type of the parameters, and the type of the return value.
Next, we take the commits that were selected by the ‘‘Pro- cessing Raw Data’’ step and mark the code sections affected by the bug in these commits. We do this by accumulating the modifications on the issue level and collecting the fully qualified names of the elements. Then, the algorithm marks the source code elements in the appropriate versions that will be entries in the dataset (touched in order to fix a bug). If a source code element in a specific version is marked by multiple issues, then it contains multiple bugs in that version. The dataset for files, classes, and methods are exported into three different files in a simple CSV format. The first row of these files contains the header
information, namely the commit id, the qualified name and the bug cardinality. Further lines store the data of the source code elements according to the header.
5.5. Combining CSV files
Now, the CSV outputs of OpenStaticAnalyzer and the previ- ously described CSV output can be merged. In this phase, we attach the source code elements that are entries in the dataset to the calculated metrics. The output of this step is also a CSV file for each type of source code element, containing the hash code of the version, unique identifiers of the source code elements, identifiers of metrics, rule violation groups, and bug cardinality (the number of bugs located in the source code elements). One entry is equivalent to one source code element at a given time (the same source code element can occur more than once with a different commit id — hash).
5.6. Filtering
This dataset we compiled so far can contain various entries that complicate further investigations. As the dataset should be suitable for studying the connection between different metrics and bug occurrences, it should serve as a practical input for different machine learning algorithms. It is possible, however, to have entries in the dataset that have the same metric values with different number of bugs assigned to them. For example, let us consider a buggy methodf with metric valuesMf1. After the bugfix, the metric values off is changed toMf2. Similarly, let us consider another buggy methodg with metric valuesMg1and Mg2, respectively. These two methods could contain two different bugs that are present in a system for distinct periods of time.
In this case, the dataset would contain 4 entries:Mf1,Mf2,Mg1, Mg2, where Mf1 and Mg1 are buggy and Mf2 and Mg2 are non- buggy entries. If any of these metric values are equal (e.g.Mf1 = Mg2 orMg1 = Mg2), then redundancy occurs that can influence the accuracy of machine learning for bug prediction (overfitting, contradicting records).
To solve this issue, we used different approaches to filter the raw dataset and eliminate the redundant entries. We tried various methods to reduce the noise in the learning set, whose entries are classified into either buggy or not buggy.
• Removal: keep the entries located in the class with the larger cardinality (e.g., for a 10:20 distribution, the result is 0:20)
• Subtract: reduce the number of entries in the class with the larger cardinality by removing as many entries as the cardinality of the smaller class (e.g., for a 10:20 distribution, the result is 0:10)
• Single: remove the entries of the class with the smaller cardinality and hold only one entry from the larger one (e.g., for a 10:20 distribution, the result is 0:1)
• GCF: divide the number of entries of both classes by their greatest common factor (or greatest common divisor) and retain only the resulting amounts of entries from the classes (e.g., for a 10:20 distribution, the result is 1:2)
Each selected approach can seriously modify the result set, thus we investigated all four options and additionally the basic case when no filtering was applied.Tables 8,10, and12present average F-measure values calculated for all of the machine learn- ing algorithms we used for all of the projects. From these tables we can see that the Single and GCF methods performed quite similarly but were less effective than Subtract or Removal.
We employed a statistical significance test, namely the Fried- man test (Friedman,1940) with a threshold ofα=0.05 to assess
Table 8
Filtering results at method level.
Method Precision Recall F-measure
No filter 0.5553 0.5501 0.5317
Removal 0.6070 0.5963 0.5773
Subtract 0.5974 0.5893 0.5717
Single 0.5495 0.5448 0.5250
GCF 0.5445 0.5408 0.5218
Table 9
Significance test results for method level filtering.
No filter Removal Subtract Single
Removal 0.001(16.88)
Subtract 0.001(13.87) 0.210 (3.00)
Single 0.736 (1.67) 0.001(18.54) 0.001(15.54)
GCF 0.020(4.29) 0.001(21.17) 0.001(18.16) 0.343 (2.62)
the significance of the differences between the averages, as it was done similarly in previous bug prediction studies (Herbold et al., 2018;Ghotra et al.,2015). Our data does not follow normal distri- bution, it consists of dependent samples and we have five paired groups, thus the Friedman test is the appropriate choice. The null hypothesis is that the multiple paired samples have the same distribution. The tests resulted in very lowpvalues (pmethod = 5.32e-80,pclass=2.03e-77,pfile=1.83e-40); therefore, we reject the null hypothesis which means the distributions are not equal.
Then, we applied the Nemenyi post-hoc test (Nemenyi, 1963) (α=0.05) that is usually used after a null hypothesis is rejected to gain more insight on the significance of the differences. The critical value for 5 groups and 176 samples (11 machine learning algorithms×16 databases) based on the studentized range table isqcrit =3.9.Tables 9,11, and13list the resultedpvalues with the corresponding rank difference in parentheses.
Let us consider the method level F-measure values inTable 8 where Removal has the highest average F-measure (0.5773) and Subtract is a close second (0.5717). In Table 9, the results of the significance tests for method level show that thepvalue of the test between Subtract and No filter is below the threshold (p= 0.001< α =0.05); therefore, the difference is significant and with Subtract having a higher average F-measure (0.5717) than No filter (0.5317), we can state that it is significantly better.
We can conclude the same when comparing Subtract with Single (p=0.001< α =0.05) or with GCF (p=0.001< α =0.05).
Thepvalue between Subtract and Removal isp=0.210> α= 0.05 which is not significant.
Similar results can be concluded for class level and for file level as well. We can state that the Removal and Subtract methods performed significantly better than the other methods in all three cases. The difference between the Removal and Subtract methods is not significant.
We speculate that a disadvantage to Single is that it drops the multiplicity of the records (i.e., the weight information). The problem with GCF, on the other hand, is that it will only perform filtering when the greatest common factor is not one, and that it does not eliminate the noise completely (i.e., it will keep at least one entry from both classes). Removal removes the noise entirely, but it suffers from the fact that it ignores the minority.
The Subtract method, however, neutralizes the positive and negative entries with identical feature vectors. This means that it removes the noise while also keeping the weight of the records, so this filtering method seems to be the best choice. Presenting all the five different sets would be lengthy, thus we will only present the results achieved by the Subtract method.
5.7. Classification and resampling
As trying to predict the exact number of bugs in a given source code element would be much more difficult – and would