SEMMELWEIS EGYETEM DOKTORI ISKOLA
Ph.D. értekezések
2386.
SYDÓ TIBOR
Szív- és érrendszeri betegségek élettana és klinikuma című program
Program- és témavezető: Dr. Merkely Béla, egyetemi tanár
1
SIGNIFICANCE OF PROGNOSTIC PARAMETERS OF EXERCISE TESTS
Doctoral Dissertation
Tibor Sydó, MD
Doctoral School of Basic and Translational Medicine Semmelweis University
Supervisor: Béla Merkely MD, DSc
Official reviewers: Csaba Sós MD, PhD, DSc István Hritz MD, PhD
Head of the Complex Examination Committee:
Zoltán Benyó MD, DSc
Members of the Complex Examination Committee:
József Pucsok, MD, DSc, Gergely Szabó MD, PhD Budapest
2020
Table of contents
Table of contents 1
Abbreviations 3
1. Introduction 4
1.1.
Exercise testing 61.1.1. Indications for Exercise Testing 7
1.1.2. Exercise Testing Protocols 9
1.1.3. Risk Prediction 9
2. Objectives of the Studies 12
3. Methods 13
3.1. Participants 13
3.2. Clinical Data 13
3.3. Exercise Test Protocol and Variables 14
3.4. Mortality Outcomes 15
3.5. Stastistical Analyses 15
4. Results 17
4.1. Study Population 17
4.2. Exercise Test Results 20
4.3. Factors Affecting Heart Rate Recovery 21 4.4. Heart Rate Recovery in Age Groups 22 4.5. Outcomes by Abnormal Heart Rate Recovery 23 4.6. Exercise Test Results by Diabetes 26 4.7. Effect of Diabetes on Heart Rate Variables 28 4.8. Mortality by Diabetes and Impaired Exercise Heart Rate 29
5. Discussion 31
5.1. Prognostic Performance of Heart Rate Recovery 32 5.1.1. Predictive Value of Heart Rate Recovery 32 5.1.2. Factors Affecting Heart Rate Recovery 33
5.1.3. Strengths and Limitations 34
5.2. Impaired Exercise Heart Rate Responses in Diabetes 35
5.2.1. Clinical Importance 35
5.2.2. Strengths and Limitations 39
6. Conclusions 40
2
7. Summary 41
8. Összefoglaló – Summary in Hungarian 42
9. References 43
10. Publications Related to the Dissertation 50 11. Publications not Related to the Dissertation 51
12. Acknowledgements 54
3
Abbreviations
ACC American College of Cardiology
ACE angiotensin-converting enzyme inhibitor ARB angiotensin receptor blocker
AHA American Heart Association
BMI body mass index
BP blood pressure
BPM beats per minute
CI chronotropic index
CRF cardiorespiratory fitness CAD coronary artery disease
CV cardiovascular
DBP diastolic blood pressure DTS Duke Treadmill Score
ECG electrocardiogram (also electrocardiography, electrocardiographic) FAC functional aerobic capacity
HR heart rate
LBBB left bundle brach block LVH left ventricular hypertrophy RPE rating of perceived exertion SD standard deviation
SBP systolic blood pressure
4
1. Introduction
It is important for both good patient care and health care economics to gain the most information possible from each test performed. This statement is equally valid for the exercise test, which provides both diagnostic and prognostic information (1). This means not only looking at the ST segment response, but also accurately reporting and identifying the significance of functional aerobic capacity (FAC) and exercise heart rate (HR) responses, including the HR recovery.
Ever since the concept of HR recovery on the exercise test in clinical practice was proposed by Lauer and colleagues in 1999 (2), investigations have consistently demonstrated its ability to identify higher risk patients in mixed cohorts – with and without documented coronary artery disease (3), in patients referred for nuclear stress testing and possible coronary angiography (4), and patients with symptomatic coronary artery disease (5). HR recovery is impaired in patients with obstructive sleep apnea (6), silent myocardial ischemia (7), heart failure with preserved ejection fraction (8), and Type 2 diabetes (9), though these studies did not report long-term outcomes.
Diabetes is associated with an excess long-term mortality, primarily due to associated cardiovascular diseases. It is frequently associated with autonomic neuropathy, one manifestation of which is an impaired HR response to exercise. Both impaired HR response to exercise and diabetes have been shown to be strong and independent predictors of mortality (10), but the effect of diabetes on exercise HR and the potential role of impaired HR in mortality in diabetic patients have not been adequately investigated.
The prognostic potential of HR recovery in a primary prevention population without documented coronary artery disease has not been fully examined either. In primary prevention cohort, cardiovascular (CV) deaths may not constitute the majority of all deaths, so it is important to know if non-CV deaths are also related to HR recovery.
Another issue is whether adjusting the HR recovery for different subgroups will improve its performance. Among exercise test prognostic factors, FAC is adjusted for age and sex, while peak exercise HR is adjusted for age and beta blocker use – either ignored in beta-blocked patients or given a different age-adjusted target (11). It is therefore essential to determine if HR recovery varies by age, sex, and beta blocker use,
5
and whether adjustment for any of these factors improves its performance (12). These questions represent the focus of the current investigation while also an attempt of validating the prognostic value of HR recovery in a primary prevention cohort. We extended our examination to diabetic patients, and assessed resting HR, peak HR, HR reserve, HR recovery and calculated the chronotropic index (CI) according to diabetes in a large cohort of patients undergoing exercise testing.
6
1.1. Exercise Testing
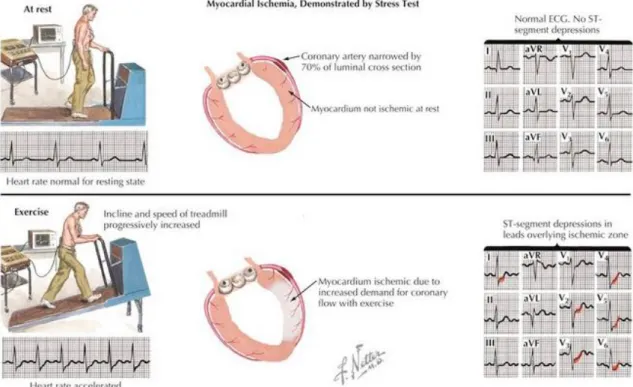
Electrocardiography (ECG) during stress testing is an essential tool for diagnosis and management of patients with various CV diseases. Its significance is based on simplicity, easy availability, short time to perform and interpret, and high informative value in special cases. Exercise testing is a CV stress test that uses treadmill or bicycle exercise with ECG and blood pressure (BP) and HR monitoring (Figure 1).
It is one of the most common non-invasive techniques to diagnose coronary artery disease (CAD), determine its prognosis and follow patients longitudinally. Applying exercise testing, we can assess FAC, exercise related symptoms and hemodynamic changes (HR and BP). We can detect ECG abnormalities not present at rest, including exercise induced arrhythmias, conduction disorders and myocardial ischemia, moreover we can also identify masked hypertension.
Figure 1. Exercise testing to detect myocardial ischemia https://thoracickey.com/stress-testing-and-nuclear-imaging/
Recently, the use of the stress testing has expanded to include testing for FAC, chronotropic incompetence (CI), cardiac rehabilitation, valvular heart disease, hypertrophic cardiomyopathy, arrhythmias, and pacemaker evaluation (13,14).
7
1.1.1. Indications for Exercise Testing
Exercise testing has been used for myocardial ischemia provocation and identification for more than six decades, and during this time additional purposes for testing have evolved. Exercise testing now is used widely for the following:
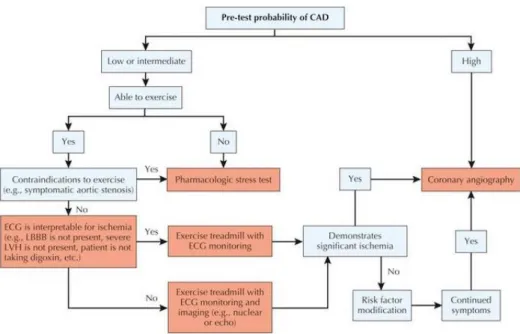
• Detection of CAD in patients with chest pain (chest discomfort) syndromes or potential symptom equivalents (Figure 2)
• Evaluation of the anatomic and functional severity of CAD
• Prediction of CV events and all-cause death
• Evaluation of physical capacity and effort tolerance
• Evaluation of exercise-related symptoms
• Assessment of chronotropic competence, arrhythmias, and response to implanted device therapy
• Assessment of the response to medical interventions.
Understanding the purpose of the individual exercise test allows the test supervisor to determine an appropriate methodology and to select test end points that maximize test safety and obtain needed diagnostic and prognostic information. During the past several decades, exercise testing has been focused increasingly on assessment of CV risk, not simply on the detection of coronary obstruction. Ultimately, improved clinical outcome is a major goal of exercise testing.
8
Figure 2. Evaluation for hemodynamically significant coronary artery disease (CAD) in clinically stable patients. LBBB, left bundle branch block; LVH, left ventricular hypertrophy.
https://www.netterimages.com/evaluation-for-hemodynamically-significant-coronary-artery-disease-cad- in-clinically-stable-patients-unlabeled-assessment-51974.html
Figure 3. Morphology of ST segment changes
9
1.1.2. Exercise Test Protocols
Bruce protocol is the most best known protocol in the world. Because of its universality, reproducibility, and practicality, the protocol remains one of the most widely used methods for diagnosing ischemic heart disease. Patients commonly start exercising on a treadmill set at 1.7 miles per hour and a 10% grade, and increase to a maximum speed of 6.0 miles per hour and a 22% grade.
1.1.3. Risk Prediction
The prognostic predictive value of exercise HR parameters has been studied in a wide range of CV populations and has proved to be an independent powerful predictor of mortality (3,15-22).
Cardiorespiratory Fitness
The strongest predictor of survival found on exercise treadmill testing is functional aerobic capacity, which means how much exercise a patient can sustain, generally indexed to age and sex. Exercise capacity has proved to be a strong and independent predictor for mortality in both patients with and without CV diseases and is more powerful than established CV risk factors. The prognostic power of exercise capacity is the same in healthy individuals and patients with CV diseases (23). Higher level of cardiorespiratory fitness is associated with lower risk of development of prediabetes, metabolic syndrome, type 2 diabetes mellitus and several types of cancer. According to several studies, every 1-MET increase in exercise performance means 10-25%
improvement in survival mainly focusing on CV or total mortality. Moreover, the addition of cardiorespiratory fitness to traditional risk factors significantly improves the reclassification of risk for adverse outcomes (24).
Among exercise test variables, exercise capacity was shown to be the strongest predictor of CV death and all-cause mortality in both genders (25). Mora et al. found that the prognostic value of stress testing derives not from ischemic ECG changes, but from fitness-related variables in asymptomatic women. They combine exercise capacity and HR recovery (with <22/min cut-off) and report CV and all-cause mortality in women (26). A large study including only men also reported that low cardiorespiratory fitness is as important as other CV risk factors and is a predictor of CV and total mortality (27).
10 Heart Rate Recovery
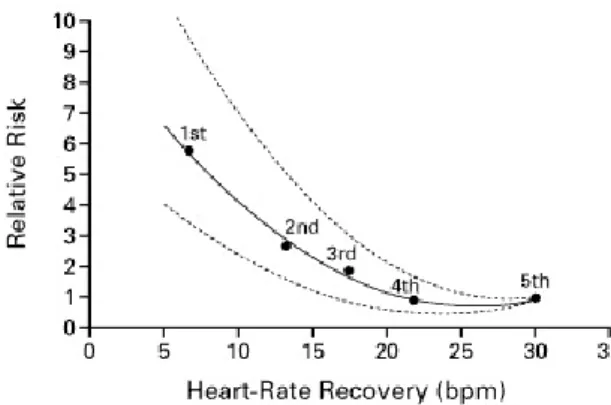
HR recovery is defined as the rate at which heart rate decreases within the following minutes after the peak exercise. It reflects the dynamic balance of autonomuos nervous system, and coordinated interplay between parasympathetic reactivation and sympathetic withdrawal (28). While the increase of HR during exercise is considered to be due to the combination of parasympathetic withdrawal and sympathetic activation, HR decrease immediately after exercise is considered to be a function of the reactivation of the parasympathetic nervous system. As increased vagal activity has been associated with a reduction in the risk of death, the rate of recovery of the HR immediately after exercise has shown to be an important prognostic marker (2).
Moreover, in recent years, there has been a large body of epidemiological evidence that HR recovery is a powerful predictor of overall mortality, independent of workload, the presence or absence of myocardial perfusion defects, and changes in heart rate during exercise (2).
Figure 4. Estimates of the relative risk of death within six years according to heart-rate recovery one minute after cessation of exercise. Circles represent the relative risk of death for each of the quintiles as compared with the quintile with the greatest reduction (5th). Dashed lines represent the 95 percent confidence interval (2).
Chronotropic incompetence
Chronotropic incompetence is another prognostically important variable defined by the failure to reach 85% of the maximum predicted heart rate (20). Heart rate response is important during exertion because it measures how well the patient’s cardiac output matches metabolic demands, and how an impaired response predicts cardiac events and overall mortality.
11 Duke Treadmill Score
Perhaps the most popular prognostic risk score used for the exercise test is the Duke Treadmill Score (DTS). The DTS is calculated by subtracting 5 times the ST depression (measured in mm) and 4 times the angina score (no angina=0, non-limiting angina=1, and test-limiting angina=2) from the total exercise duration (measured in minutes) on the standard Bruce protocol. Subjects are considered low risk if they score 5 or above, intermediate risk if they score between 4 and -10, and high risk if they score -11 and below. Subjects with a high-risk DTS are much more likely to have triple-vessel or left main CAD, and have a reduced 5-year survival rate of 65%.
12
2. Objectives of the Studies
We have had a strong cooperation with Mayo Clinic Cardiovascular Health Clinic, Rochester, USA since 2014. In order to study HR responses to exercise, we assessed the large Mayo Integrated Stress Center Database (MISC). This database contains exercise testing data of almost 140000 patients with more than 200000 exercise tests covering approximately 32 years.
1. Our first aim was to study exercise HR responses in a primary prevention population with a focus of HR recovery
• to determine if HR recovery varies by age, sex, and beta blocker use, and whether adjustment for any of these factors improves its performance
• to validate the prognostic value of HR recovery in a primary prevention cohort and determine its long-term prognostic significance.
2. Our second aim was to extend our research to diabetic patients and investigate HR responses to exercise
• to study the effect of diabetes on exercise HR parameters: resting HR, peak HR, HR reserve, HR recovery and chronotropic index (CI)
• to investigate the role of impaired HR in excess mortality.
13
3. Methods
This was a retrospective study approved by Mayo Clinic Rochester Institutional Review Board. Subjects not consenting to have their data used in research under Minnesota Statute (§144.335) were excluded. (29)
3.1. Participants
Patients who underwent exercise treadmill testing from September 21, 1993 through December 20, 2010 were identified retrospectively using the Mayo Clinic Integrated Stress Center (MISC) database.
Inclusion criteria were as follows: non-imaging stress test, Minnesota resident, symptom-limited treadmill test performed on the Bruce protocol. Minnesota residents were more likely than non-Minnesota residents to have follow-up medical evaluation at Mayo, and their vital status was readily available from the Mayo Clinic records and the Minnesota Death Index. The study cohort was limited to patients aged ≥ 20 years (in an attempt to limit referral bias) and < 90 years, because there were very few extremely elderly patients in the database. For the HR recovery analyses we included only patients between age 30-79 years.
Tests were excluded if the patient (1) had documented history of cardiovascular (CV) disease, including ischemic heart diseases, heart failure, cardiac surgery, structural or valvular heart diseases, major arrhythmias, defibrillator or pacemaker, congenital heart diseases, cerebrovascular diseases, and peripheral vascular diseases; (2) the test was not symptom-limited but stopped because of ST changes, major arrhythmias, or abnormal blood pressure response; (3) active recovery for at least 1 minute was not completed; 4) peak exercise or 1-minute recovery HR were impaired by a paroxysmal arrhythmia. Where multiple qualifying tests were available for a given patient, the first test chronologically was chosen to maximize follow-up.
3.2. Clinical Data
Demographic and clinical information were collected prospectively at the time of the stress study. HR and other exercise data were uploaded into the database electronically from the GE CASE stress testing systems (Milwaukee, WI). Patient characteristics including age, sex, anthropometrics, and comorbidities were extracted
14
from patient medical charts and patient interview at the time of the exercise test. We specifically looked for diabetes mellitus (defined by prior diagnosis or receiving glucose-lowering medication), hypertension (defined by prior diagnosis or receiving anti-hypertension medication), obesity (defined as BMI ≥ 30 kg/m2), past and current smoking. Medication use – beta blockers, calcium channel blockers, aspirin, statins, ACE-inhibitors or angiotensin receptor blockers, and diabetic treatment drugs – oral hypoglycemics and insulin – was available in the database.
3.3. Exercise Test Protocol and Variables
Symptom-limited treadmill exercise testing was performed on usual medications using the standard Bruce protocol according to ACC/AHA guidelines (30,31). Resting HR and blood pressure (BP) measurements were obtained in the standing position.
Symptoms, BP, HR, rating of perceived exertion (RPE) – measured by the Borg scale RPE scale, a frequently used quantitative measure of perceived exertion during execise – and workload were electronically entered into the database during the final minute of each stage of exercise, peak exercise, 1 and 3 minutes of active recovery at 1.7 MPH/0% grade, and 6 minutes post-peak exercise in seated recovery.
Exercise test interpretation data including reason for termination, symptoms, abnormal signs, and exercise electrocardiographic (ECG) analysis were added to the database immediately after the test. FAC was expressed as 100% x actual performance time/predicted performance time based on previous publications from our laboratory (32). Peak HR was also expressed as percent predicted peak HR (33). HR reserve was calculated as the difference between peak and resting HR. CI was defined as HR reserve divided by the predicted HR reserve as previously reported in our laboratory for healthy men and women(33) and defined as abnormal if < 0.8 (16,20,21). HR recovery was calculated as peak exercise HR minus HR at 1 minute of active recovery at 1.7 MPH/0% grade and was considered abnormal if < 13 beats/minute (3). An abnormal exercise ECG was defined as any ST depression or elevation > 1.0 mm irrespective of the resting ECG, while an abnormal exercise ECG was considered positive only if the resting ECG did not present significant ST-T abnormalities, the patient was not taking digitalis, and rate-related left bundle branch block did not occur.
15
3.4. Mortality Outcomes
Outcomes were taken from Mayo Clinic patient records and the Minnesota Death Index, which was reviewed in September 2014 (Research Aim 2) and March 2016 (Research Aim 1). Follow-up was calculated as the time from the stress test to death (identified by the Minnesota Death Index as last date of vital status). This methodology provides 100% complete follow-up data. For the HR recovery analyses, CV and non- CV deaths weredivided. A death was considered to be CV-related if a CV condition was included among the first 3 listed causes in the Minnesota Death Index; otherwise the death was considered non-CV. Mortality data were classified using International Classification of Diseases (ICD) 9 (391, 391.9, 394-398, 402, 404, 410-414, 415-417, 420-429, 430-438, 440-448, 451-454, 456-459) and ICD 10 (I101, I05-I09, I11, I13, I20-I25, I26-I28, I30-I52, I60-69, I70-I79, I80-89) codes.
3.5. Statistical Analysis
Patient characteristics, outcomes, and exercise data were analyzed by decade of age.
Differences among continuous variables by age group were assessed by the analysis of variance under the general linear model with multiple comparisons handled by Tukey’s method, while Pearson’s Chi-Squared Test of continuity was used to test age group differences in discrete variables. Statistics were performed using SAS 9.4 (Raleigh, NC). P < .05 was considered significant for all analyses.
Research Aim 1
Similar to a previous paper on peak HR by age and sex from our laboratory (33), the first step in the analysis was to determine factors that significantly affect HR recovery using stepwise multivariate regression, then to create a “pure cohort” by eliminating patients with those factors. This allowed us to identify the true physiologic change in HR recovery with age and sex. The next step in the analysis was to determine if the standard definition of abnormal HR recovery of < 13 bpm would predict the outcomes of total death, CV death, and non-CV death in this primary prevention dataset using the whole cohort. Cox Proportional Hazards Regression was employed for this analysis.
Further analyses were stratified by age, sex, FAC, presence of hypertension, diabetes, current smoking and use of a HR-lowering drug. Differences in Hazard ratios between different strata were determined by the Z-score method.
16 Research Aim 2
Multivariable linear regression analysis was used to identify the effects of diabetes on HR adjusted for age, sex, and HR-lowering drugs then in a larger model including current smoking, hypertension, abnormal exercise ECG and type of diabetic treatment.
For the simple model we chose factors that have a well-established effect on HR variables (33), while the full model is more exploratory. We determined the effect of exercise HR responses on total mortality in diabetics and non-diabetics using by Cox hazard regression first in the simple adjustment model and then in the extended adjustment model, as described above. We also performed Cox regression to compared mortality according to 0, 1, or 2 of the exercise HR abnormalities (abnormal HR recovery and abnormal CI) in both diabetic and non-diabetic patients.
17
4. Results
4.1. Study Population
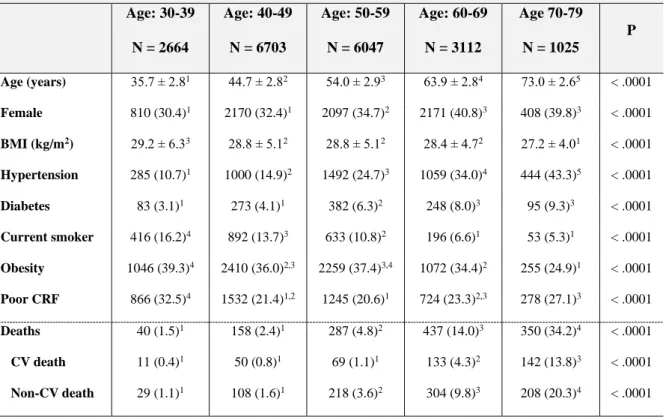
A total of 19551 patients were available for the HR recovery analysis. Their demographic and clinical data, stratified by decade of age, are provided in Table 1, along with the long-term outcome data – shown below in Table 1 for convenience.
Table 1. Baseline characteristics and outcomes in the five age groups for the full clinical cohort.
Age: 30-39 N = 2664
Age: 40-49 N = 6703
Age: 50-59 N = 6047
Age: 60-69 N = 3112
Age 70-79 N = 1025
P
Age (years) 35.7 ± 2.81 44.7 ± 2.82 54.0 ± 2.93 63.9 ± 2.84 73.0 ± 2.65 < .0001 Female 810 (30.4)1 2170 (32.4)1 2097 (34.7)2 2171 (40.8)3 408 (39.8)3 < .0001 BMI (kg/m2) 29.2 ± 6.33 28.8 ± 5.12 28.8 ± 5.12 28.4 ± 4.72 27.2 ± 4.01 < .0001 Hypertension 285 (10.7)1 1000 (14.9)2 1492 (24.7)3 1059 (34.0)4 444 (43.3)5 < .0001 Diabetes 83 (3.1)1 273 (4.1)1 382 (6.3)2 248 (8.0)3 95 (9.3)3 < .0001 Current smoker 416 (16.2)4 892 (13.7)3 633 (10.8)2 196 (6.6)1 53 (5.3)1 < .0001 Obesity 1046 (39.3)4 2410 (36.0)2,3 2259 (37.4)3,4 1072 (34.4)2 255 (24.9)1 < .0001 Poor CRF 866 (32.5)4 1532 (21.4)1,2 1245 (20.6)1 724 (23.3)2,3 278 (27.1)3 < .0001 Deaths 40 (1.5)1 158 (2.4)1 287 (4.8)2 437 (14.0)3 350 (34.2)4 < .0001 CV death 11 (0.4)1 50 (0.8)1 69 (1.1)1 133 (4.3)2 142 (13.8)3 < .0001 Non-CV death 29 (1.1)1 108 (1.6)1 218 (3.6)2 304 (9.8)3 208 (20.3)4 < .0001
Continuous data are presented mean ± SD; categorical data as N (percentage of sample).
BMI = body mass index, CRF = cardiorespiratory fitness, CV = cardiovascular
Poor cardiorespiratory fitness defined as functional aerobic capacity (FAC) < 80% predicted for age and sex on exercise test.
Different superscripts indicate a statistically significant difference between age groups. Superscript = 1 is arbitrarily set at the lowest value for each variable.
18
Diabetes and hypertension rates increased progressively with age, while obesity and current smoking showed an opposite trend. Not surprisingly, there were relatively more women in the older age groups. Poor cardiorespiratory fitness (CRF) – identified by an FAC < 80% – was highest in the youngest age group, likely reflecting referral bias in younger patients.
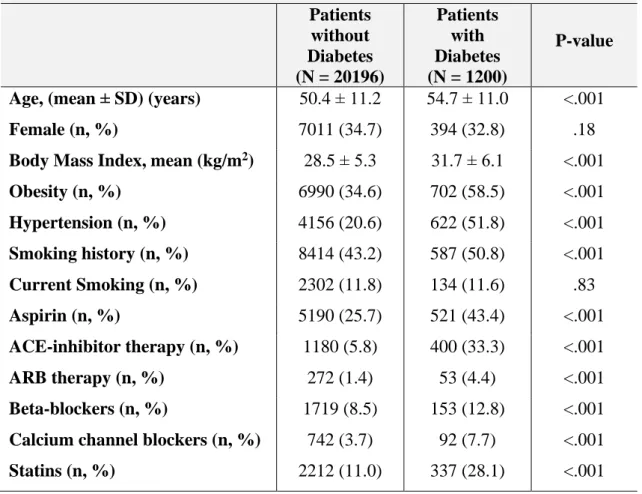
For our diabetes project we initially identified 101544 exercise tests over the study period to identify 21,396 patients meeting study criteria. Reasons for exercise testing included symptoms in 42% (predominantly chest pain, 31%) and referral to preventive cardiology for exercise prescription in the remaining 58%. Of these patients, 1200 had diabetes (5.4%), predominately type 2 diabetes; type 1 diabetics represented a small portion of the diabetic patients (N = 137, 11.4%). Clinical characteristics of the patients are presented according to the presence of diabetes in Table 2.
Table 2. Baseline characteristics of the patients with and without diabetes Patients
without Diabetes (N = 20196)
Patients with Diabetes (N = 1200)
P-value
Age, (mean ± SD) (years) 50.4 ± 11.2 54.7 ± 11.0 <.001
Female (n, %) 7011 (34.7) 394 (32.8) .18
Body Mass Index, mean (kg/m2) 28.5 ± 5.3 31.7 ± 6.1 <.001 Obesity (n, %) 6990 (34.6) 702 (58.5) <.001 Hypertension (n, %) 4156 (20.6) 622 (51.8) <.001 Smoking history (n, %) 8414 (43.2) 587 (50.8) <.001 Current Smoking (n, %) 2302 (11.8) 134 (11.6) .83 Aspirin (n, %) 5190 (25.7) 521 (43.4) <.001 ACE-inhibitor therapy (n, %) 1180 (5.8) 400 (33.3) <.001 ARB therapy (n, %) 272 (1.4) 53 (4.4) <.001 Beta-blockers (n, %) 1719 (8.5) 153 (12.8) <.001 Calcium channel blockers (n, %) 742 (3.7) 92 (7.7) <.001 Statins (n, %) 2212 (11.0) 337 (28.1) <.001
Continuous data are presented mean ± SD, categorical data as percentage of sample.
ACE = angiotensin-converting enzyme inhibitor, ARB = angiotensin receptor blocker
19
Approximately 90% were Caucasian, 3% African American, 7% other race. In general, the cardiovascular risk factor burden was low, consistent with the higher socio- demographic characteristics of the cohort and the exclusion of baseline cardiovascular disease. Among the diabetic patients, 352 (29%) were on insulin therapy, 625 (52%) were on oral hypoglycemic drugs, and 69 (6%) on both.
20
4.2. Exercise Test Results
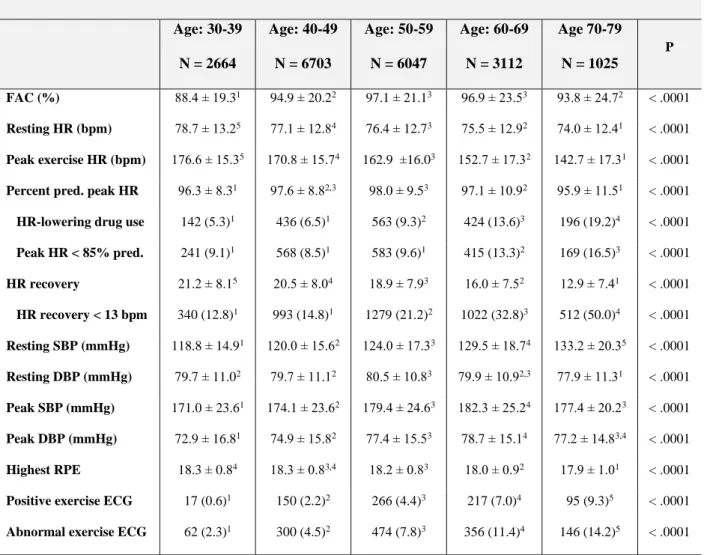
Table 3 provides the exercise test data for the full clinical cohort of 19,551 patients.
Table 3. Exercise test results for the full clinical cohort.
Age: 30-39 N = 2664
Age: 40-49 N = 6703
Age: 50-59 N = 6047
Age: 60-69 N = 3112
Age 70-79 N = 1025
P
FAC (%) 88.4 ± 19.31 94.9 ± 20.22 97.1 ± 21.13 96.9 ± 23.53 93.8 ± 24.72 < .0001 Resting HR (bpm) 78.7 ± 13.25 77.1 ± 12.84 76.4 ± 12.73 75.5 ± 12.92 74.0 ± 12.41 < .0001 Peak exercise HR (bpm) 176.6 ± 15.35 170.8 ± 15.74 162.9 ±16.03 152.7 ± 17.32 142.7 ± 17.31 < .0001 Percent pred. peak HR 96.3 ± 8.31 97.6 ± 8.82,3 98.0 ± 9.53 97.1 ± 10.92 95.9 ± 11.51 < .0001 HR-lowering drug use 142 (5.3)1 436 (6.5)1 563 (9.3)2 424 (13.6)3 196 (19.2)4 < .0001 Peak HR < 85% pred. 241 (9.1)1 568 (8.5)1 583 (9.6)1 415 (13.3)2 169 (16.5)3 < .0001 HR recovery 21.2 ± 8.15 20.5 ± 8.04 18.9 ± 7.93 16.0 ± 7.52 12.9 ± 7.41 < .0001 HR recovery < 13 bpm 340 (12.8)1 993 (14.8)1 1279 (21.2)2 1022 (32.8)3 512 (50.0)4 < .0001 Resting SBP (mmHg) 118.8 ± 14.91 120.0 ± 15.62 124.0 ± 17.33 129.5 ± 18.74 133.2 ± 20.35 < .0001 Resting DBP (mmHg) 79.7 ± 11.02 79.7 ± 11.12 80.5 ± 10.83 79.9 ± 10.92,3 77.9 ± 11.31 < .0001 Peak SBP (mmHg) 171.0 ± 23.61 174.1 ± 23.62 179.4 ± 24.63 182.3 ± 25.24 177.4 ± 20.23 < .0001 Peak DBP (mmHg) 72.9 ± 16.81 74.9 ± 15.82 77.4 ± 15.53 78.7 ± 15.14 77.2 ± 14.83,4 < .0001 Highest RPE 18.3 ± 0.84 18.3 ± 0.83,4 18.2 ± 0.83 18.0 ± 0.92 17.9 ± 1.01 < .0001 Positive exercise ECG 17 (0.6)1 150 (2.2)2 266 (4.4)3 217 (7.0)4 95 (9.3)5 < .0001 Abnormal exercise ECG 62 (2.3)1 300 (4.5)2 474 (7.8)3 356 (11.4)4 146 (14.2)5 < .0001
Continuous data are presented mean ± SD; categorical data as number (percentage of sample).
FAC = functional aerobic capacity, HR = heart rate, SBP = systolic blood pressure, DBP = diastolic blood pressure, RPE = rating of perceived exertion, ECG = electrocardiogram
Functional aerobic capacity defined as 100% x actual time/predicted time on Bruce protocol for age and sex.
Rating of perceived exertion measured on standard Borg Scale (6 – 20).
Positive exercise electrocardiogram defined by standard methods.
Abnormal exercise electrocardiogram defined as positive or abnormal but not diagnostic due to resting ST-T abnormalities.
Different superscripts indicate a statistically significant difference between age groups.
Superscript = 1 is arbitrarily set at the lowest value for each variable.
21
Because of the large sample size, even minor differences, such as in resting HR or highest rating of perceived exertion reached statistical significance, though some age trends were pronounced, such as the well-documented trend towards decreasing peak exercise HR with age (33). HR recovery also declined significantly with age, while the proportion of patients with HR recovery < 13 bpm increased significantly. Not surprisingly, the portion of patients taking HR-lowering drugs increased significantly with age. The frequency of both positive and all abnormal exercise ECGs also increased steadily with age.
4.3. Factors Affecting Heart Rate Recovery
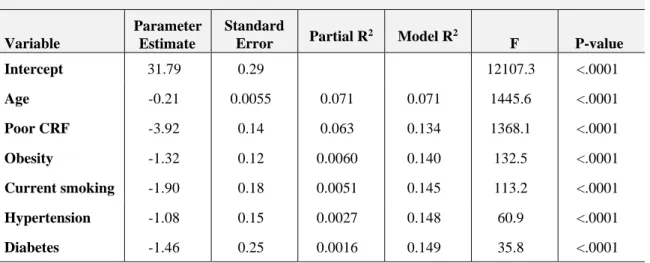
For the next step in the analysis, stepwise multivariate regression to determine factors significantly affecting HR recovery was performed (Table 4.)
Table 4. Multivariate regression analysis to determine factors affecting HR recovery.
Variable
Parameter Estimate
Standard
Error Partial R2 Model R2 F P-value
Intercept 31.79 0.29 12107.3 <.0001
Age -0.21 0.0055 0.071 0.071 1445.6 <.0001
Poor CRF -3.92 0.14 0.063 0.134 1368.1 <.0001
Obesity -1.32 0.12 0.0060 0.140 132.5 <.0001
Current smoking -1.90 0.18 0.0051 0.145 113.2 <.0001
Hypertension -1.08 0.15 0.0027 0.148 60.9 <.0001
Diabetes -1.46 0.25 0.0016 0.149 35.8 <.0001
CRF = cardiorespiratory fitness
The N for Table 4 was 18887, as 664 patients (3.4%) had one missing covariate, principally smoking status. Intercept and age were highly significant in the regression, and 5 other factors – poor CRF, obesity, current smoking, hypertension, and diabetes – all showed significant (negative) effects on HR recovery, whereas sex, taking a HR- lowering drug, and an abnormal exercise ECG did not affect HR recovery significantly.
Only age and poor CRF contributed more than 1% to the model R2. Based on these results, we formed our pure cohort by eliminating patients with the 6 HR recovery- lowering factors, leaving us 7852 patients.
22
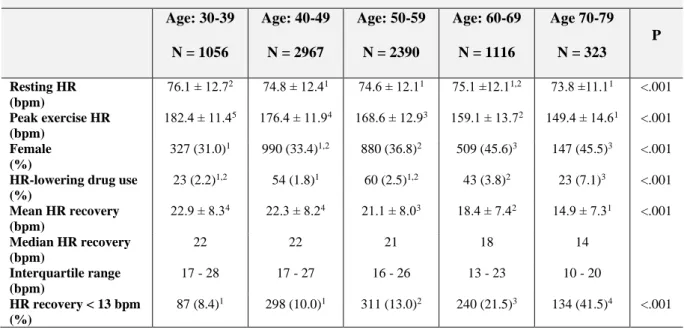
4.4. Heart Rate Recovery in Age Groups
Table 5 shows means, medians, and interquartile range for HR recovery, and percent of patients with HR recovery less than the traditional cut-point of 13 bpm in the first minute of active recovery according to decade of age in the pure cohort.
Table 5. Heart rate recovery distribution in the pure cohort.
Age: 30-39 N = 1056
Age: 40-49 N = 2967
Age: 50-59 N = 2390
Age: 60-69 N = 1116
Age 70-79 N = 323
P
Resting HR (bpm)
76.1 ± 12.72 74.8 ± 12.41 74.6 ± 12.11 75.1 ±12.11,2 73.8 ±11.11 <.001
Peak exercise HR (bpm)
182.4 ± 11.45 176.4 ± 11.94 168.6 ± 12.93 159.1 ± 13.72 149.4 ± 14.61 <.001
Female (%)
327 (31.0)1 990 (33.4)1,2 880 (36.8)2 509 (45.6)3 147 (45.5)3 <.001
HR-lowering drug use (%)
23 (2.2)1,2 54 (1.8)1 60 (2.5)1,2 43 (3.8)2 23 (7.1)3 <.001
Mean HR recovery (bpm)
22.9 ± 8.34 22.3 ± 8.24 21.1 ± 8.03 18.4 ± 7.42 14.9 ± 7.31 <.001
Median HR recovery (bpm)
22 22 21 18 14
Interquartile range (bpm)
17 - 28 17 - 27 16 - 26 13 - 23 10 - 20
HR recovery < 13 bpm (%)
87 (8.4)1 298 (10.0)1 311 (13.0)2 240 (21.5)3 134 (41.5)4 <.001
Continuous data are presented mean ± SD; categorical data as number (percentage of sample).
HR = heart rate
Pure cohort created by excluding patients with hypertension, diabetes, current smoking, obesity (BMI ≥ 30 kg/m2), and poor cardiorespiratory fitness (functional aerobic capacity < 80% age-sex predicted).
Different superscripts indicate a statistically significant difference between groups.
Superscript = 1 is arbitrarily set at the lowest value for each variable.
23
We propose that these data represent the true effect of age on HR recovery. At each age group, HR recovery in the pure cohort was higher than in the full cohort, as expected. Average HR recovery is relatively constant through ages 30 – 39, while through ages 50 – 59 it begins to decrease more rapidly as age increases. The portion of patients with a HR recovery below the traditional cut point of 13 bpm is only 8.4% at age 30 – 39 but has risen to 41.5% by age 70 – 79.
4.5. Outcomes by Abnormal Heart Rate Recovery
There were a total of 1,271 deaths (6.5%) in the full cohort over an average follow- up of 12.4 ± 5.0 years. Consistent with exclusion of baseline CV disease and residence in a state (Minnesota) with overall low CV death rates, there were actually more non- CV deaths (867, 4.4%) than CV deaths (405, 2.1%). Not surprisingly, women were at a lower age-adjusted risk of death (0.70 with 95% confidence interval [0.62 – 0.90]), compared to men.
Using the full clinical cohort, an abnormal HR recovery by the traditional value of <
13 bpm in the first minute post-peak exercise during active recovery was a significant risk factor for death from any cause, CV death, and even non-CV death in this primary prevention cohort. Hazard ratios for an abnormal HR recovery predicting death, CV death and also non-CV death are shown in Figure 5.
24
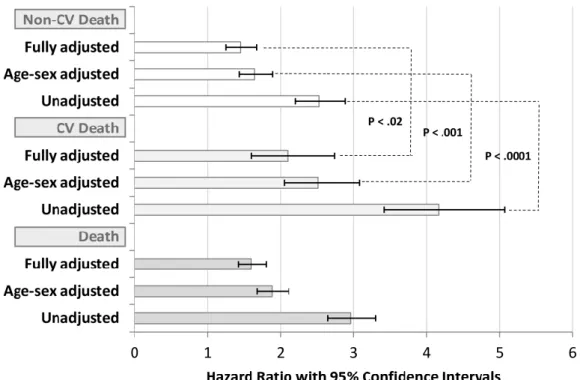
Figure 5. Hazard ratios with 95% confidence intervals for an abnormal heart rate (HR) recovery predicting death, cardiovascular (CV) death, and non-CV death.
Three models are shown for each outcome: unadjusted; adjusted for age and sex; fully adjusted for age, sex, diabetes, hypertension, obesity, current smoking, and poor cardiorespiratory fitness.
Hazard ratios for CV and non-CV death are compared by the Z-score method.
Three models are shown for each outcome: unadjusted; adjusted for age and sex;
and fully adjusted for age, sex, diabetes, hypertension, obesity, current smoking, and poor CRF. The hazard ratios in all models for all outcomes are statistically significant.
The hazard ratio for abnormal HR recovery for CV versus non-CV death was significantly higher in the unadjusted (P<.0001), age-sex adjusted models (P<.001), and fully adjusted (P<.02) models. We have therefore demonstrated that an abnormal HR recovery is a significant predictor of death, CV death, and even non-CV death in our primary prevention cohort.
For further analyses, we focused on CV mortality since its association with abnormal HR recovery was strongest. We divided the full cohort according to 3 age groups, 30 – 59 (based on the minimal change in HR recovery across this age range as mentioned above), then 60 – 69, and 70 – 79, as HR recovery declined significantly over these older age groups. Hazard ratios for CV death according to HR recovery in the 3 age groups are shown in Figure 6. Hazard ratios were statistically significant in all age groups and not significantly different amongst the 3 age groups.
25
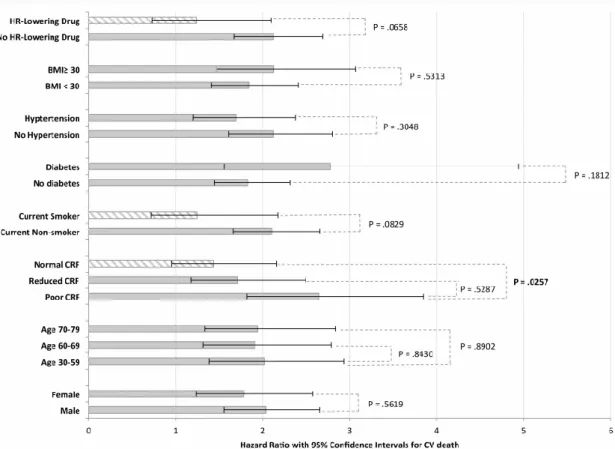
Figure 6. Hazard ratios with 95% confidence intervals for an abnormal heart rate (HR) recovery predicting cardiovascular (CV) death stratified by age, sex, presence of obesity, hypertension, diabetes, current smoking, use of HR-lowering drug, and level of cardiorespiratory fitness (CRF).
Poor CRF refers to functional aerobic capacity (FAC) < 80%, reduced CRF to FAC 80 – 99%, and normal CRF to FAC ≥ 100% predicted. All models are fully adjusted for age, sex, diabetes, hypertension, obesity, current smoking, and poor CRF. Hazard ratios for CV death are compared by the Z-score method.
Hazard ratio bars filled with striped pattern indicate non-significant findings.
Figure 6 also shows the predictive value of abnormal HR recovery according to sex, 3 levels of CRF, smoking status, diabetes, hypertension, obesity, and use of a HR- lowering drug. Abnormal HR recovery significantly predicted outcomes in all sub- groups except current smokers, patients with normal CRF (≥ 100% FAC), and patients taking a HR-lowering drug; in these sub-groups, the confidence intervals in the Hazard Ratios included 1.0. As noted in the displayed P-values, there was a significant difference in the hazard ratios in poor versus normal CRF, while the differences in hazard ratios according to HR-lowering drug and current smoking were of borderline significance. On the other hand, abnormal HR recovery did not perform differently in males versus females, in reduced versus normal CRF, among the three age groups, or in patients with or without diabetes, hypertension, or obesity.
26
4.6. Exercise Test Results by Diabetes
Exercise test results by diabetics are given in Table 6.
Table 6. Exercise test variables by diabetes Patients
without Diabetes (N = 20196)
Patients with Diabetes (N = 1200)
P-value
Exercise time (min) 9.2 ± 2.5 7.5 ± 2.2 <.001
FAC (%) 96 ± 22 82 ± 22 <.001
Resting HR (beats/minute) 77 ± 13 81 ± 14 <.001 Peak HR (beats/minute) 165 ± 19 154 ± 20 <.001 HR reserve (beats/minute) 88 ± 19 73 ± 19 <.001 HR recovery (beats/minute)a 19 ± 9 15 ± 8 <.001 HR recovery < 13 beats/minute (%) 4243 (21.0) 463 (38.6) <.001 Chronotropic Indexb 0.99 ± 0.20 0.86 ± 0.22 <.001 Chronotropic Index < 0.8 (%) 3329 (16.5) 478 (39.8) <.001 Resting systolic BP (mmHg) 123 ± 18 128 ± 19 <.001 Resting diastolic BP (mmHg) 80 ± 11 78 ± 11 <.001 Peak systolic BP (mmHg) 177 ± 26 184 ± 27 <.001 Peak diastolic BP (mmHg) 77 ± 16 78 ± 16 <.001
Peak RPE 18.1 ± 1.0 18.0 ± 1.0 .06
Positive ECG (%) 923 (4.6) 103 (8.6) <.001 Abnormal ECG (%)c 1593 (7.9) 141 (11.8) <.001
Continuous data are presented mean ± SD, categorical data as percentage of sample.
Abbreviations: BP = Blood Pressure; CI = Chronotropic Index, ECG = electrocardiogram;
FAC = Functional Aerobic Capacity; HR = Heart Rate; RPE = Rating of Perceived Exertion
a Heart rate recovery was defined as peak HR minus HR at 1 minute of active recovery (1.7 MPH/0%
grade)
b CI was defined as the ratio of observed HR reserve to predicted HR reserve for a large cohort of healthy subjects previously defined in our laboratory
c Abnormal exercise ECG was defined as any test with ≥ 1.0 mm ST deviation irrespective of whether the resting ST segments were normal, so this included non-diagnostic studies.
27
FAC based on age-sex adjusted performance time was greater for non-diabetics versus diabetics; it was near 100% for the non-diabetic group (32). Reason for termination was symptom-limited in 96% of tests; 2% of tests were terminated at patient request and another 2% according to judgment of the test monitor. The rating of perceived exertion at peak exercise averaged ~ 18 on the 6-20 Borg Scale in both groups (34).
Diabetics had higher resting HR and lower peak HR, HR reserve, CI and HR recovery compared to non-diabetics. Diabetic patients also had higher resting and peak exercise systolic blood pressure. Both positive exercise ECG and abnormal exercise ECG were more common in patients with diabetes. The prevalence of both abnormal HR recovery (≤ 13 beats/minute) and abnormal CI (< 0.8) was significantly higher in diabetics versus non-diabetics. A low CI using the established cut-point of < 0.8 is present in only 16% of the non-diabetics versus 39% of the diabetic patients. Using the traditional cut-point of < 13 beats/minute, abnormal HR recovery is present in only 22%
of non-diabetics versus 39% of diabetics. The prevalence and significance of CI is likely altered by differential use of HR-lowering drugs in diabetics versus non-diabetics, but HR recovery, being affected principally by parasympathetic tone, should not be subject to effect of these drugs. Among the non-diabetic patients, 14,048 (70%) had no exercise HR abnormality (abnormal HR recovery or low CI), 4,724 (23%) had one abnormality and 1,424 (7%) had two abnormalities, while among diabetic patients, 539 (45%) had no abnormality, 381 (32%) had one abnormality and 280 (23%) had two abnormalities.
28
4.7. Effect of Diabetes on Heart Rate Variables
Table 7. shows the effect of diabetes on exercise HR variables controlling for differences between diabetics and non-diabetics in variables potentially affecting exercise HR by use of multivariate linear regression.
Table 7. The effect of diabetes on heart rate variables Effect Simple
Model P
Effect Full
Model P
Resting HR (bpm) + 4.9 <.001 + 2.9 <.001
Peak HR (bpm) - 6.4 <.001 - 4.5 <.001
HR reserve (bpm) - 11.4 <.001 - 7.4 <.001 HR recovery (bpm) - 3.0 <.001 - 1.9 <.001 Chronotropic Index (CI) - 0.128 <.001 - 0.08 <.001
Abbreviations: HR = Heart Rate
In the simple model age, sex and HR-lowering drugs were added to diabetes, while in the full model we extended it with current smoking, hypertension, abnormal exercise ECG, oral hypoglycemic drugs and insulin. Diabetes showed significant HR modifying effects in both models. In the simple model, all factors showed significant effects on each HR variable, except for female sex on HR recovery. In the full model age, female sex, HR-lowering drug, smoking, hypertension and insulin had significant HR - lowering effects on all HR variables, while oral hypoglycemic drugs did not have a significant effect on resting HR, peak HR and on HR recovery; and abnormal exercise ECG did not have a significant effect on peak HR or HR recovery.
29
4.8. Mortality by Diabetes and Impaired Exercise HR
Overall mortality was low. There were 1362 deaths (6.4%) over a mean follow-up of 11.9 ± 4.9 years. Differences in survival in diabetics and non-diabetics according to these two exercise HR variables are shown in Figure 7.
Figure 7. Survival for the first 15 years of follow-up according to presence or absence of diabetes and normal or low chronotropic index (CI) [A] and normal or abnormal heart rate (HR) recovery [B].
The reduction in survival for abnormal CI (Figure 7A) is very similar to the reduction seen with abnormal HR recovery (Figure 7B) for both diabetic and non- diabetic patients. In multivariate analysis using the simple model, which included age, sex, and use of HR-lowering drug, both CI < 0.8 and abnormal HR recovery contributed independently to the risk of death significantly and similarly in both diabetic and non- diabetic patients. The hazard ratio for CI < 0.8 was 2.21 with 95% confidence interval:
1.62 – 3.00, P<.001 in diabetics and 1.94 with 95% confidence interval: 1.71 – 2.20, P<.001 in non-diabetics. Abnormal HR recovery similarly predicted mortality (hazard ratio 2.21 with 95% confidence interval: 1.60 – 5.05, P<.001 in diabetics versus 1.75 with 95% confidence interval: 1.55 - 1.97, P<.001 in non-diabetics). Only minor changes in the hazard ratios occurred with the extended model.
30
In Figure 8 we further explore the relationship of mortality with the two most commonly utilized variables of exercise HR – abnormal CI and abnormal HR recovery–
in diabetics versus non-diabetics.
Figure 8. Hazard ratios with 95% confidence intervals for mortality by diabetes and number of exercise heart rate (HR) abnormalities (chronotropic index (CI) and HR recovery). Patients with no diabetes and 0 exercise HR abnormalities form the referent group.
Mortality increases with the number of exercise HR abnormalities in both diabetic and non-diabetic patients. To highlight the importance of exercise HR as a predictor of mortality, we compared diabetics with normal exercise HR to non-diabetics with one or two exercise HR abnormalities. Using non-diabetics with no HR abnormalities as the referent, the mortality of diabetics with no HR abnormalities (Hazard Ratio = 1.56 [95%
confidence interval: 1.14 - 2.12]) is essentially the same as non-diabetic patients with one HR abnormality (Hazard Ratio = 1.50 [95% confidence interval: 1.31 - 1.71]), and the 95% confidence intervals are fully overlapped. Looking further at the importance of exercise HR in prognosis, the mortality of non-diabetic patients with both HR abnormalities is significantly higher (Hazard Ratio = 2.78 [95% confidence interval:
2.38 – 3.24]) compared to diabetics with no HR abnormalities with no overlap in the 95% confidence intervals. All models were controlled for age, sex, and use of HR- lowering drugs.
31
5. Discussion
We give a detailed description of the role and prognostic performance of prognostic parameteres including HR recovery in a general population. Moreover, we show that HR recovery is associated with a number of CV risk factors including diabetes, hypertension, current smoking and poor CRF but is not affected by sex or use of HR lowering drug. Exercise test is an important prognostic tool to predict mortality. Using non-ECG parameters such as HR recovery we can predict not only total mortality but also abnormal HR recovery, which is an even stronger predictor of CV death and predicts non-CV death as well. While HR recovery performs equally well in all age groups and in both men and women, it is less useful in patients with normal CRF or in those taking a beta-blocker.
If we study exercise HR responses in patients with diabetes, we can see that heart rate responses to exercise are more frequently impaired versus non-diabetic patients.
Abnormal HR response is predictive of excess long-term mortality in both diabetic and non-diabetic patients.
32
5.1. Prognostic Performance of Heart Rate Recovery
This retrospective study confirmed the hypothesis that HR recovery has prognostic significance in a primary prevention cohort of almost 20,000 patients without documented history of known CV disease. We show that HR recovery is a significant predictor not only of total and CV death but of non-CV death as well. HR recovery is impaired by a number of CV risk factors including diabetes, hypertension, obesity, smoking, and poor CRF. HR recovery decreases significantly with age, especially above 50 years, but it performs equally well in all adult age groups. We also show that HR recovery predicts CV death equally in men versus women and patients with and without hypertension, diabetes, or obesity, but its prognostic performance is limited in patients with normal CRF, current smokers, and those taking HR-lowering drugs.
5.1.1. Predictive Value of Heart Rate Recovery
The first comprehensive study of HR recovery was from Lauer et al. in 1999, which included patients who were referred for a first symptom-limited exercise test and single- photon-emission computed tomography with thallium scintigraphy. These patients were candidates for initial angiography (2). Lauer postulated that HR recovery is a reflection of decreased vagal activity and established the formula calculating HR recovery as peak HR – HR at 1 minute in the active recovery and defined it as abnormal if < 13 bpm.
Extended analyses on 9,454 patients undergoing myocardial perfusion imaging confirmed that HR recovery is a powerful predictor of overall mortality independent of workload, presence of myocardial perfusion defects, and DTS (3). Other studies have investigated the predictive value of HR recovery in various high risk populations such as heart failure, diabetes, and coronary artery disease (5,35-38). They all confirmed that HR recovery is an independent predictor of both CV and total mortality in their specific patient populations. In an American Heart Association statement published in 2005 in Circulation, exercise testing was identified as an important tool of assessing and refining prognosis, particularly when emphasis is placed on non-ECG measures including HR recovery (39).
Data on HR recovery in lower risk cohorts is more limited. The prognostic importance (all-cause mortality and non-fatal myocardial infarction) of HR recovery has been confirmed in chest pain patients with low DTS (40). Our group has also previously
33
identified the prognostic role of HR recovery in 2014 in a smaller population with 6,546 patients focusing on the association of HR recovery with exercise test parameters and all-cause mortality (41). The ability of HR recovery to predicted non-CV mortality has not been previously addressed.
5.1.2. Factors Affecting Heart Rate Recovery
Two prior studies investigated the effect of sex on HR recovery and mortality (42,43). Both suggested that abnormal HR recovery was independent of sex and had similar prognostic value in both men and women, as our study has confirmed. Two prior studies reported HR recovery in older patients (44,45), but they did not compare the impact of age on its prognostic value, as we have done here.
Though obesity, hypertension and diabetes are all affected the HR recovery, abnormal HR recovery had similar prognostic significance in patients with or without obesity, hypertension and diabetes. Smokers also had lower HR recovery but abnormal HR recovery was not a significant predictor of CV death in current smokers. We speculate that the profound effect of smoking on CV mortality may follow a different mechanism (acute plaque rupture) than other risk factors including age, sex, obesity, hypertension, and poor CRF, but the limited utility of HR recovery in current smokers may also reflect low statistical power due to the relatively small number of current smokers in the cohort (11%).
Another important clinical question about HR recovery interpretation is the use on HR-lowering drug, mainly beta-blockers. Of the 1761 (8.9%) patients taking any HR- lowering drug, almost all (1667, 94.7%) were taking a beta-blocker. Although there was no difference in HR recovery in patients taking or not taking HR-lowering drug, an abnormal HR recovery did not significantly predict CV death in patients taking a HR- lowering drug. We explain this paradoxical finding by pointing out that an abnormal HR recovery indicates reduced parasympathetic tone with a resultant imbalance between sympathetic and parasympathetic tone. Blocking sympathetic tone may restore that balance and eliminate the hazard associated with the abnormal HR recovery.
However, as may also have been the case with current smoking, the small number of patients in this primary prevention cohort taking beta blocker may have also limited our ability to show significance in this group. Prior studies have tested the role of beta- blockers on HR recovery. One study found significant impact of beta-blocker use on
34
HR recovery, but they included patients with CV diseases (46). Karnik et al. stated that beta-blocker use improved HR recovery in patients with positive exercise stress echocardiography, and that it does not affect HR recovery in patients with negative exercise stress echocardiography, and can be used for mortality prediction (47) – the latter finding is in contrast with what we have observed in a low risk primary prevention cohort. Also in apparent contrast to our findings, the study of Myers et al., which included 1,910 male veterans, suggested that beta-blockade had minimal impact on the prognostic power of HR recovery (48). The interaction of beta blockers and HR recovery may require further clarification.
Our study is also the first to stratify HR recovery according to CRF. Better CRF is clearly associated with better HR recovery, while the prognostic significance of an abnormal HR recovery is inversely related to CRF. The limited utility of HR recovery in patients with normal CRF may be a consequence of the low rate of CV mortality (109 deaths, 1.4%) in this sub-group. The principle that “fitness trumps other risk factors”
has also been observed with respect to obesity and diabetes (49,50) – and also applies to ST segment changes during exercise (1,51). What is more important, perhaps, is the observation that abnormal HR recovery is a strong predictor of CV death in patients with poor CRF, indicating that abnormal HR recovery is more than just
“deconditioning”.
5.1.3. Strength and Limitations
The strengths of our study include a large consecutive cohort with complete mortality follow-up over a long time period. We have also divided mortality according to CV and non-CV death. Exercise test data were robust and complete, and important data on comorbidities and pharmacotherapies were available. Our study reflected the limited racial diversity seen in Minnesota, so our results may not be applicable to more diverse racial or ethnic groups. Overall mortality was low, reflecting the status of Minnesota as a state with low total and CV mortality. However, we might speculate that exercise HR responses might be even more important in a higher risk population.
Exercise tests were conducted in a clinical environment, and patients were instructed to exercise to subjective fatigue. Gas exchange was not measured to confirm the level of metabolic effort by respiratory exchange ratio. We are using CRF at a single