EMPIRICAL ARTICLE
Overcompensation as a service recovery strategy:
the financial aspect of customers’ extra effort
Zsofia Kenesei1 · Zsofia Bali1
Received: 16 July 2019 / Accepted: 23 January 2020 / Published online: 6 February 2020
© The Author(s) 2020
Abstract
Compensation is one of the most important elements of service. Companies often pursue a strategy of overcompensation; however, there are contradictory results in the literature whether overcompensation has a positive or negative effect on post‑
complaint customer behaviour. In this paper, based on three studies, we prove that examining the amount of additional effort required of the customer in order to achieve service recovery can help us better explain outcomes of the service recov‑
ery. Our results clearly show that the degree of additional customer effort has sig‑
nificant influence both on satisfaction and on perceived fairness and it moderates the effect of the amount of compensation.
Keywords Compensation · Consumer behaviour · Complaint handling · Satisfaction · Justice
1 Introduction
Service companies commit mistakes from time to time, which results in consumer loss. Such service failures lead to customer dissatisfaction and may create a com‑
plaint situation. A key element of the retention of disaffected customers is to imple‑
ment an appropriate service recovery mechanism in order to enable the organization responsible for the flawed service to restore customer confidence. The determina‑
tion of the appropriate level of compensation is a critical factor of efficient service recovery.
Service companies have various tools at their disposal to redress the losses at the core of the complaint situation. One option is to offer a level of compensation which exceeds the loss suffered: in other words, overcompensation. For organizations, it is
* Zsofia Kenesei
zsofia.kenesei@uni‑corvinus.hu Zsofia Bali
balizsofiaa@gmail.com
1 Corvinus University Budapest, Fővám tér 8, 1093 Budapest, Hungary
crucial to understand under exactly what circumstances customers actually expect to receive extra compensation in addition to the correction of the flawed service, and what kind of effect such overcompensation is likely to have on postcomplaint cus‑
tomer behaviour. While at first sight, it may appear evident that postcomplaint cus‑
tomer satisfaction has a linear relationship with the level of compensation offered, the theory of justice in fact predicts that this is not necessarily the case. This contra‑
diction is reflected in the findings of the available literature, where various authors have often presented contradictory results. While some studies have found that over‑
compensation can help organizations regain customer satisfaction (Noone and Lee 2011; Noone 2012; Crisafulli and Singh 2016), others have argued that overcom‑
pensation in fact offends customers’ sense of justice and may result in dissatisfaction with the service recovery process (Haesevoets et al. 2014, 2017).
The goal of our research is to identify the factors which underlie these appar‑
ently conflicting findings and to develop and test a theoretical framework which can explain the full spectrum of observed customer reactions to overcompensa‑
tion. Based on a qualitative inquiry we argue that the extra effort customers have to shoulder in order to be provided service correction by the organization respon‑
sible for the flawed service is a major predictor of satisfaction and fairness per‑
ception. In addition to this, we also identify whether the form of monetary com‑
pensation influences postcomplaint customer satisfaction.
Our paper is structured as follows. First, we discuss previous studies on the effects of monetary compensation, using the theoretical framework of justice. We will address the various factors that might influence satisfaction with the differ‑
ent forms of compensation, and we will also evaluate the existing findings on the effects of overcompensation. In the second half of our paper, we introduce our research model, which was created based on the findings of prior qualita‑
tive interviews. In order to test our hypotheses, we conducted two scenario‑based experiments. After the description of the method and presentation of our results, we discuss the theoretical and managerial implications of our findings which will be especially relevant for service companies.
2 Theoretical background
A complaint situation inevitably signals customer dissatisfaction, and organiza‑
tions need to establish a professional service recovery mechanism in order to turn this dissatisfaction into postcomplaint customer satisfaction. If customers who suffered a loss as a result of a service failure are not compensated appropriately, they will remain dissatisfied and they will be unlikely to continue to accept the services offered by the organization. In addition to this, insufficiently compen‑
sated customers may share their negative experiences within their social circles, which can lead to widespread damage to the reputation of the services offered by the organization, and further loss of actual and potential customers and a conse‑
quent fall in revenues and profits.
Service recovery is usually examined within the framework of the theory of justice, where three factors are identified which determine whether the complaint‑
handling process will be perceived as appropriate by the customer.
2.1 Theory of justice and service recovery
The level and type of compensation, the service recovery procedure itself and the behaviour of the organization’s representatives vis‑à‑vis the customer all influ‑
ence the perceived fairness of a service recovery offer in a flawed service situa‑
tion (Tax et al. 1998). Based on this, three dimensions of justice can be identified in a service recovery situation: distributive justice, procedural justice and inter- actional justice (Smith et al. 1999; Maxham 2001; McCall‑Kennedy and Sparks 2003; McCollough et al. 2000). Procedural justice refers to the fairness of proto‑
cols and events within the recovery process, interactional justice is related to the communication and general behaviour of the organization’s representatives, while distributive justice is a function of the perceived fairness of the level of compen‑
sation. In the last dimension, the customer compares the losses suffered because of service failure with the income earned from the compensation. If customers perceive the proportion of losses and incomes to be appropriate, then they will regard the relationship between the organization and themselves as just, whereas if they perceive this proportion inappropriate, they will experience a lack of jus‑
tice (Blodgett et al. 1997; del Rio‑Lanza et al. 2009; Choi and Choi 2014). Per‑
ceived fairness leads to higher postcomplaint satisfaction that enhances customer engagement (Cambra‑Fierro et al. 2016). As Mannaa and Chaudhry (2013) point out, service failures are often impossible to correct, and in such cases, empathy and politeness are crucial factors in retaining the commitment and loyalty of the consumers affected by the service failure. In general, interactional justice (Chen and Lee 2018) or procedural justice (Cheung and To 2017) often serves to com‑
pensate for an inadequate level of distributive justice. As Davidow (2003) points out, the perception of justice is influenced most strongly by the following three factors: equality, need and equity. The principle of equality emphasizes the equal‑
ity of outcomes: a service recovery process is fair if customers affected by the same service failure receive the same treatment. The principle of need takes the needs of affected customers as a reference point. Davidow (2003) uses the exam‑
ple of the scarcity of available seats on an alternative airline in case of a can‑
cellation: the limited number of available seats will be given to those customers who are most in need of getting to their intended destination. In the study of dis‑
tributive justice, the principle of equity is crucial. Customers perceive a service recovery process equitable if their losses (including the time and effort expended lodging a complaint and participating in the service recovery process) are not greater than the compensation (such as refunds or discounts) received. (Roschk and Gelbrich 2014; Crisafulli and Singh 2016; Blodgett et al. 1997).
The focus of our paper is distributive justice and more specifically the effects of overcompensation on postcomplaint customer behaviour.
2.2 The role of compensation
Compensation can be defined as a tangible benefit provided by organizations to dis‑
affected customers (Davidow 2003; Gelbrich et al. 2015). Standop and Grunwald (2009) have shown that the appropriate form and level of compensation are crucial:
they pointed out that postcomplaint customer satisfaction can actually be higher than the satisfaction of those customers who did not have any negative experience with the service or organization due to service failure in the first place. In order to redress the negative experience of disaffected customers, the service failure needs to be cor‑
rected. In order to mitigate the tangible and intangible losses suffered by the custom‑
ers, organizations provide compensation to them. (Blodgett et al. 1997). There are two types of compensation in case of service failure: tangible (material) compensa‑
tion and intangible (psychological) compensation. The former includes compensa‑
tion that can be expressed in financial terms, whereas the latter covers compensation of a less tangible and more emotional nature (Gelbrich and Roschk 2011). Money back, vouchers, store credits, new/exchanged goods and new/reperformed service are examples of tangible compensation; whereas empathy and sincere apology are elements of psychological compensation (Roschk and Gelbrich 2014). The impor‑
tance of intangible compensation is well‑illustrated by complaint situations arising from inappropriate employee behaviour toward a customer, in the course of which the customer suffers emotional loss, and as a consequence, psychological compensa‑
tion plays a key role. Compensation of this kind contributes to the preservation of the self‑esteem of the affected customer and to the maintenance of a long‑term rela‑
tionship between the organization and the customer (Standop and Grunwald 2009;
Gelbrich et al. 2016).
2.3 Different levels of material compensation
The amount of compensation offered to address customer losses arising from service failure does not always correspond to the costs incurred by the disaffected customer as a result of the failure. The level of compensation is affected by various factors.
Prior experiences of the customer, the communication strategy of the organization, the compensations already offered to other affected customers and the magnitude of the loss suffered by the client all influence the acceptable level of compensation (Maxham III and Netemeyer 2002). The customers affected by service failure suf‑
fer losses as a result, and the expected level of compensation should be in relation‑
ship with the level of these: this means that at the very least, the organization has to restore the situation that preceded the service failure event; otherwise, customers may become unsatisfied. Based on the equity paradigm, the higher the losses, the higher is the compensation demanded by the affected customers in order to balance the losses suffered as a result of service failure. (Kim and Ulgado 2012; Davidow 2003). Compensation is usually defined as a percentage of the customer loss; thus, one can speak of partial compensation, full compensation, and overcompensation (Gelbrich et al. 2015).
In the case of partial compensation, the compensation provided by the organiza‑
tion is less than the loss suffered by the customer. Partial compensation typically occurs in cases where customers eventually accepted the flawed service, but they were still dissatisfied with a certain component of the service. E.g., in the case of significant delays, train companies typically reimburse clients only partially, even though the service they provided was in essence flawed.
Full compensation means a level of compensation equal to the level of customer loss. Full compensation enables an organization to address service failure by essen‑
tially restoring the pre‑failure situation. However, in practice, organizations often fall short of providing compensation for all the losses suffered by a client. (Gel‑
brich et al. 2015; Gelbrich and Roschk 2011). In fact, simply reimbursing customers the full purchase price may not be enough to satisfy them, as in addition to losing the service, they may have incurred other costs. In such cases, full reimbursement of the purchase price may be seen as not amounting to full compensation. A typi‑
cal situation is a flight cancellation, where even though the price of the air ticket itself is reimbursed, but other losses, such as the loss incurred by being unable to arrive to one’s pre‑booked and pre‑paid accommodation on time, are not addressed.
Often, the mere act of lodging a complaint incurs material and psychological costs.
Because of this, in practice, full compensation typically means a compensation level significantly higher than the simple reimbursement of the purchase price. (Hae‑
sevoets et al. 2017).
This practice is described as overcompensation, i.e. the offering of a compensa‑
tion level which exceeds the original purchase price in service failure situation. In other words, overcompensation offers a level of compensation that is higher than the direct losses suffered by the customer. (Haesevoets et al. 2017; Noone and Lee 2011;
Noone 2012; Crisafulli and Singh 2016).
Compared to full compensation, overcompensation is a costlier alternative from the perspective of the organization, since it involves providing compensation higher than full compensation; by the same token, overcompensation is a more rewarding alternative from the perspective of the customer. Companies naturally try to keep service recovery costs as low as possible: this means that unless the benefits of over‑
compensation are significantly higher than the benefits of the alternatives, it makes sense in general to prefer less costly strategies such as full compensation or partial compensation (Noone 2012).
2.4 Psychological and economic aspects of overcompensation
While prior to compensation, customers experience a state of disadvantageous ine‑
quality arising from service failure; after an episode of overcompensation, customers experience a state of advantageous inequality. Research into fairness has shown that customers prefer advantageous inequality to disadvantageous inequality. However, it is less clear whether customers in general prefer a compensation scheme that creates a state of advantageous inequality to one that would create a state of equality (Gar‑
rett 1999). Customer reactions to various compensation schemes might be examined from two perspectives: the psychological and the economic (Haesevoets et al. 2014).
The psychological perspective emphasizes that it is not only the absolute mag‑
nitude of the compensation that matters: the perceived fairness of the compensa‑
tion and its appropriate proportionality with the losses also influences postcomplaint customer behaviour. One reflection of this is that in general, customers prefer com‑
pensation schemes which restore equality to those which lead to inequality (even if that inequality is actually advantageous to the consumer): in other words, customers often prefer full compensation to overcompensation (Chen et al. 2018). Crisafulli and Singh (2016) argue that this apparent paradox is explained by the fact that cus‑
tomers want to avoid the feeling of guilt which would arise if they were to become beneficiaries of an unjust situation.
However, the findings of some studies in fact contradict these predictions of the psychological approach. The authors of these papers argue that customers have a higher level of satisfaction after overcompensation (which leads to a state of advan‑
tageous inequality) than after full or partial compensation (which leads a state of equality). This predicts that raising the level of compensation will lead to higher postcomplaint customer satisfaction (Garrett 1999).
These observations resonate with the economic perspective, which emphasizes financial gain as a primary motivator of humans and stresses the desire of maximal‑
izing financial outcomes. In this view, overcompensation is a superior outcome in monetary terms, and therefore, it is likely to result in higher postcomplaint satisfac‑
tion, increased repurchase intention, a more positive company image, and stronger loyalty.
2.5 Effect of overcompensation and its moderators
Although there is a controversy about the exact effect of overcompensation, there is set of factors that researchers found to be important to consider in examining this effect. Based on a research that compared different levels of overcompensation, Gel‑
brich et al. (2015) found that the relationship between the amount of overcompensa‑
tion and satisfaction is not linear. There is a downward slope for higher amount of overcompensation for customers who rejected the flawed service and a saturation effect for customers who accepted the service. They recommended a maximum of 170% overcompensation, as above this amount the satisfaction may decrease. They also found that there can be a difference between the type of services, as the slope and maximum satisfaction were different in the case of lodging and a music theatre.
Haesoevets et al. (2017) similarly claimed that there is an inverted U‑relation between the amount of overcompensation and loyalty but found two distinct cus‑
tomer groups: while the first group has rejected any overcompensation (down‑
stream??? curve), the second has accepted it and their loyalty increased gradually until a certain point (flattening curve). In the study, more than 80% of the respond‑
ents showed this letter pattern. Based on three studies, they recommend an overcom‑
pensation of 150% as the optimal level.
Another factor that can influence the relationship between the amount of over‑
compensation and satisfaction is the relationship quality between the customer and the service provider (Gelbrich et al. 2016; Tektas 2017). While for customers with a
low relationship quality, the shape of the curve remains inverted U shape; in case of high relationship quality customers, the curve is close to linear; and at 200% over‑
compensation, it does not reach saturation. Based on the evaluation of the authors, this higher amount of overcompensation stands for the appreciation of the trust and loyalty of the high relationship customers.
Estelami and Meyer (2002) found that overgenerosity is not valued by customers especially if it is provided by a low‑level service provider. In this case, customers would feel ashamed or think that the employee risks the profitability of the business.
On the other hand, overgenerosity is received more favourably by customers if it is provided by a high organizational‑level service provider. This relationship is moder‑
ated by past purchase history, i.e. if there is a longer relationship with the provider, customers are more willing to accept overgenerosity.
Noone (2012) claims first that 200% overcompensation causes significantly higher justice perceptions than either full or partial compensation and that cash‑
based overcompensation is perceived fairer than credit‑based (over)compensation.
This final factor is worth further investigation.
2.6 Different forms of compensation
In addition to the level of compensation, its form is also an important determinant of postcomplaint customer satisfaction. Monetary compensation may be offered either at the time of the complaint or in a delayed fashion. Based on this, one can differ‑
entiate between cash-based and voucher-based compensation. One typical instance of cash‑based compensation is a ‘money back’ scheme, whereas voucher‑based schemes include cases where the customer receives a store credit which can be redeemed at the time of the next purchase. These two types of compensation differ significantly in terms of flexibility, timeliness and uncertainty (Roschk and Gelbrich 2014; Noone and Lee 2011; Noone 2012; Crisafulli and Singh 2016).
Timeliness refers to the actual time when the benefits connected to the compensa‑
tion can be realized. In case of cash‑based schemes, customers receive at once the compensation that they are entitled to as a consequence of service failure. Voucher‑
based compensation entails that customers can only realize the benefits at a later point in time, at the time of their next purchase at the same company (Zaubermann 2003). In terms of timeliness, customers in general prefer immediate compensation to delayed compensation. The second differentiating factor between cash‑based and voucher‑based compensation is uncertainty. In the case of cash‑based compensa‑
tion, customers can be certain that they will indeed receive the compensation, since it is immediately transferred to them. As opposed to this, in the case of voucher‑
based compensation, the actual event of receiving the compensation is placed in the future and it is thus uncertain. In general, customers prefer certain (immediate) compensation to uncertain (delayed) compensation. Flexibility is another important parameter. In the case of voucher‑based compensation, the customers’ options of realizing the benefits of the compensation are strictly limited as they are required to redeem the voucher by affecting another purchase at the same company. Cash‑based
compensation, on the other hand, imposes no such restrictions at all on the use of the compensation received.
Crisafulli and Singh (2016), as well as Noone and Lee (2011) have found that customers in general prefer cash‑based compensation to voucher‑based com‑
pensation. This is in line with the important benefits of cash‑based compensation discussed above. Nevertheless, we would like to emphasize that voucher‑based schemes do have a major advantage when it comes to repurchase intent. Noone and Lee (2011) point out that compared with the alternatives, voucher‑based compen‑
sation has the highest positive effect on the probability of repurchase/repatronage.
This is explained by the observation that customers are strongly motivated to restore fairness and equality, which, in the case of voucher‑based compensation, can only be achieved if they redeem the voucher in an act of repurchase. This in turn gives the company a second chance to provide a high‑quality service experience to the client and to increase postcomplaint client satisfaction. Tang et al. (2018) propose a more situation‑based strategy, as they emphasize that different pairings of recovery timing and strategy should be employed adjusted to the state of emotion of customers.
To conclude, the overview of relevant research shows that it is far from evident that overcompensation after service failure affects satisfaction and loyalty in a posi‑
tive way. While there are cases when overcompensation helps companies in the pro‑
cess of satisfactory service recovery (Gelbrich et al. 2015), in other cases it may hinder it (Haesoevets et al. 2014). Our goal in this paper is to explore the underly‑
ing reasons for these seemingly contradictory findings. To this end, we conducted a series of studies, which we discuss in the next section.
3 Study 1: qualitative study on the role of customer effort
The contradictory findings in the literature discussed above strongly suggest that there exist some hitherto unexamined factors that need to be built into our models in order to gain a more satisfactory understanding of the effects of overcompensation on postcomplaint customer satisfaction. Our goal in the exploratory research stage was to identify any additional factor which might help us better explain how custom‑
ers react to overcompensation. Based on the findings of this stage, we are able to formulate our hypotheses that will serve as the basis for Study 2 and Study 3.
3.1 Method and sample
Throughout the process of data collection, coding and analysis, the methodology of grounded theory was followed. In addition to the two main schools of grounded theory (Strauss and Corbin 1990; Glaser 1992), constructivist grounded theory, 2014) has become popular in the past few years (Denzin and Lincoln 2011; Wertz et al. 2011). Contrary to the markedly positivist stance of the original grounded the‑
ory concept that objective knowledge of the world can be acquired, constructivist grounded theory claims that researchers are in continuous interaction with the pro‑
cess and the object of inquiry. A characteristic trait of the constructivist method is
the recognition that researchers themselves are an important part of the process, as they continually interact with interviewees and data, and therefore, their personal input plays a significant role in the findings and the theory developed.
Based on these principles, we conducted semi‑structured interviews, using prede‑
termined, open‑ended questions that enabled us to generate a theory after the coding and analysis of the data. The interviews were planned to cover two main topics. In the first part, we explored the expectations of our respondents regarding a service failure. In this phase, our inquiry was focused on the possible solutions and compen‑
sation expectations that can be satisfying in a situation where in addition to some compensation, there is a possibility of correcting the service failure. In the second phase, we presented scenarios asking their reactions to different failure scenarios and solutions. In this phase, we planned to collect aspects that can have an effect on their reactions.
In order to reach our goal, we conducted in‑depth interviews with 10 subjects concerning their experiences with service recovery in connection with service fail‑
ure. We designed our sample in accordance with the principles of theoretical sam‑
pling and continued until reaching saturation. Our respondents were selected with a snow‑ball technique and we strived for heterogeneity in terms of age, gender and background.
3.2 Data analysis and results
The transcription of the interviews and the analysis of the transcripts were carried out by the authors. Throughout the process of data collection and analysis, we fol‑
lowed the basic principles of grounded theory, specifically the constant compari‑
son technique. We iteratively collected and analysed data, comparing constantly the newly emerged data against the already existing insights (Charmaz 2000). Moving through the different levels of coding is a critical element in data analysis. In the first step, with the help of open coding, we identified keywords and key phrases.
During this phase, we developed the first‑order categories to describe the reaction of consumers to overcompensation. As a result, several conceptual groups having an impact on the perception of overcompensation have been distinguished. First‑
level categories included phrases such as ‘it cost me money’, ‘unpleasant feeling’,
‘it takes my time’, ‘they fix it right away’, ‘they ought to compensate me’, ‘it took me a lot of effort’ or ‘it is insignificant’. The next step of coding (axial coding) involves the classification and grouping of key phrases to create concepts such as ‘additional time’, ‘additional money’, ‘compensation’, ‘additional effort’ or ‘insignificant addi- tional effort’. After this, in the final step (selective coding), we identified the key concepts which will underpin our theory. This resulted in the creation of the follow‑
ing concepts: ‘effort’ and ‘compensation’. After a while, the same key phrases and concepts repeated themselves, which we interpreted as a sign of saturation, and after this, we discontinued the further collection of data.
The first important finding of our analysis is that fundamentally, what customers expect is not compensation but, if it is possible, that the service provider provides (i.e. reperforms) the original service that they have paid for.
What really matters to me is that the company corrects its mistake and does the job properly the second time. That’s why I went to them in the first place.
I don’t need them to pay me my money back: I want them to do their job prop‑
erly, that’s what I payed them for! (man, age 27)
Furthermore, it became clear from the interviews that in addition to the actual direct material loss suffered as a consequence of service failure, there is another crucial factor which customers take into account when formulating their demand for com‑
pensation: the level of additional effort that they have to make in order to achieve service recovery.
Having kept me waiting for so long, I think I am now entitled to expect some degree of compensation. I think 15 min is about the limit after which some sort of compensation should be given in addition to fixing the error. Time is money, after all! (man, age 57)
Service acceptance vs. service rejection has been identified by Roschk and Gelbrich (2014) as a factor in the determination of the appropriate level of compensation:
they found that consumers who decided to accept the flawed service find it difficult to identify a clear benchmark point to formulate the level of compensation that they demand. In our research, we added a new perspective to this: the question of service reperformance. In cases where the flawed service can be reperformed, our interview‑
ees expressed a clear and strong preference for receiving the desired service rather than receiving their money back.
Let them fix their mistake, rather then giving me my money back! That’s why I called them in the first place, to do their job properly. (man, age 43)
The further scrutiny of these issues revealed that in the case of reperformance, the level of the additional effort required from customers has a strong effect on the expected level of compensation. Note that effort as an antecedent of customer satis‑
faction with service recovery has so far been investigated only in the context of the company’s employees (Cambra‑Fierro et al. 2015), suggesting that greater recov‑
ery effort perceived by the customer leads higher satisfaction. Our research results indicate that effort can be interpreted on the side of the customer as well. If the correction of the service failure entails significant additional costs for the customer (whether of temporal, material or emotional nature), then most customers deem it appropriate or fair to receive overcompensation (i.e. compensation which exceeds the direct economic loss suffered). On the contrary, if any additional costs or efforts on the customers’ side are marginal, then no compensation over the correct perfor‑
mance is expected in general.
I don’t need any compensation. They fixed the mistake right away, so I suffered no loss whatsoever. (woman, age 26)
The additional efforts which customers need to make in order to achieve recovery of the flawed service are very often not of a directly monetary nature, but rather, of a temporal kind. Due to the wide variety of services, this can take many forms and we can only provide a handful of illustrative examples. Consider the case
where a hotel room is unclean, and it needs to be cleaned: this means that the guest can only occupy the room a couple of hours later than originally intended.
A hairdresser might fix the botched haircut: however, this means that the patron has to stay longer than planned. Internet providers may need to send a mechanic to the customer’s home to fix an error: this means that the customer needs to stay at home. Service failure on part of a car mechanic may involve not fixing the car on time: this means that the customer may have to go back the next day to fetch the car. The practical implication of this is that in case of a service failure, service providers need to evaluate carefully the extra effort on the customer’s side that a service reperformance or correction will involve; since this is the main factor in determining the expected level of compensation. The theoretical implication is that the study of the additional effort required from customers is essential in order to properly analyse customer behaviour in connection with overcompensation.
We would like to emphasize that the concept of additional customer effort introduced here is quite separate from the well‑known concept of procedural jus‑
tice (Wirtz and Mattila 2004). Procedural justice in the context of service recov‑
ery refers to the perceived fairness and justice experienced by the customer in the process of complaint handling and the attainment of compensation: this includes elements such as the time difference between lodging a complaint and receiving a compensation, or any problems which arise in the complaint registration process.
The concept of additional customer effort, however, is not related to difficulties or problems arising within the process of service recovery. Rather, it is the inherent nature of service reperformance and compensation in itself which entails addi‑
tional customer efforts, even in cases where the service recovery process of the organization is optimal and flawlessly executed.
4 Research hypotheses
Based on the literature review and the analysis of the interviews, we formulated our hypotheses around two broad themes: the additional customer effort required in service recovery and the form of compensation.
With our first hypothesis, we empirically test one of the findings from the qual‑
itative research stage: in case of an outcome failure that can be corrected, custom‑
ers in general prefer the appropriate reperformance of the service to receiving monetary compensation.
Roschk and Gelbrich (2014) have shown that in general, customers have the highest postcomplaint satisfaction if the type of compensation corresponds to the type of service failure. If the service is such that it can be reperformed, then in general, customers above all expect the organization to reperform the service in a flawless fashion. Our hypotheses, however, is that this is only true if customers are not required to make additional efforts in order to facilitate this service reper‑
formance. In the light of this, our first hypothesis is the following:
H1 If customers are not required to make significant additional efforts in connection with the service recovery, they will not require monetary compensation in addition to the satisfactory performance.
The exploratory research suggests that the degree of satisfaction with a com‑
pensation depends not only on the level of compensation, but also on the addi‑
tional customer effort needed in order to attain the flawless service. Our second hypothesis concerns this connection between additional customer effort and post‑
complaint satisfaction. Based on our analysis of the interviews, we assume that customers will have higher postcomplaint satisfaction if they are not required to make significant additional efforts in the course of the service recovery process.
Gelbrich et al. (2016) argue that most customers wish to receive such recovery which leads to a state of equality. In the context of additional customer effort, this means that if customers are required to make significant additional efforts in order to receive a flawless reperformance of the service, then they will not regard it fair and will not be satisfied with the simple reperformance of the service.
H2 If customers are required to make significant additional efforts in order to achieve service recovery, then (a) the customers will have lower postcomplaint satis‑
faction and (b) the customer will regard the service recovery less fair.
Based on our first hypothesis, we assumed that customers do not require mon‑
etary compensation in addition to the reperformance if there is no need of them to make an effort to receive it. Based on our second hypothesis, we supposed that if there is an extra effort required from the customer to receive the flawless service, they will be less satisfied and perceive it as unfair. These two hypotheses can be modulated with regard of the interaction term: if there is an extra effort to receive the recovered service, customers will be more satisfied and will perceive it as fair if they get overcompensation. At the same time, if a customer is not required to make additional efforts, then overcompensation will actually not increase the cus‑
tomer’s postcomplaint satisfaction and sense of fairness.
H3 Overcompensation results in significantly higher (a) postcomplaint satisfaction and (b) perceived fairness only if additional customer effort is required to attain ser‑
vice recovery.
The effects of overcompensation on postcomplaint customer behaviour also depend on the type of compensation (Roschk and Gelbrich 2014; Noone and Lee 2011; Noone 2012; Crisafulli and Singh 2016). One has to differentiate between cash‑based and voucher‑based overcompensation, which differ from each other in terms of timeliness, uncertainty and flexibility. On all three counts, cash‑based overcompensation has an advantage: customers prefer instant compensation (timeliness), guaranteed compensation (uncertainty) and flexibility of use (flex‑
ibility). This is in line with the findings of Crisafulli and Singh (2016) and Noone
and Lee (2011), who showed that customers prefer cash‑based overcompensation to voucher‑based overcompensation.
H4 Cash‑based overcompensation leads to (a) higher postcomplaint satisfaction and to (b) a higher sense of fairness than voucher‑based overcompensation, indepen‑
dently from the degree of additional customer effort required.
5 Study 2: effect of customer effort on the impact of overcompensation
The goal of this study is to test our first three hypotheses, i.e. the effects of overcom‑
pensation and additional customer effort on postcomplaint customer behaviour. We chose a scenario‑based experimental methodology based on predefined scenarios.
The main advantage of such an approach is that it helps respondents to identify with the situation and thus it results in more authentic customer reactions and more valid findings (Blodgett et al. 1997). Because of this, experimental methods are the most widely used tool in service recovery.
5.1 Design
In the experiment, we wished to examine the effects of two independent variables.
The first independent variable concerned compensation, and we defined two levels in terms of the level of compensation: service recovery with simple (full) compen‑
sation (100%) and service recovery with overcompensation (200%). In defining the amount of overcompensation, we relied on the research results of Gelbrich et al.
(2015) and Haesevoets et al. (2017), as both researches have determined 200% over‑
compensation as an amount that is high enough to have either positive or negative effect on consumers.
The second independent variable relates to the concept of additional customer effort (which we identified in the exploratory research stage). Two levels are speci‑
fied for this variable: significant additional customer effort and insignificant addi‑
tional customer effort.
For the scenario‑based experiment, we applied a 2 × 2 between‑subject factorial design, which necessitated the creation of four scenarios based on the manipulation of the independent variables. These scenarios were randomly assigned to respond‑
ents, and it was ensured that each scenario was assigned to approximately the same number of respondents.
When developing the scenarios, we aimed to find a context which is natural enough and at the same time, lends itself to the kind of manipulation necessary for our purposes. We chose telephone subscription services, where the failed service is an erroneous monthly bill. In the high effort situation, the customer is expected to visit the customer service centre where the failure can be corrected, while, in the low effort situation, the service provider corrects the failure through telephone, without any further hassle. The level of compensation has two levels: in the full
compensation situation the service provider pays back the erroneously charged amount, while in the overcompensation situation the service provider pays back the money plus pays the same amount once more as a compensation. The scenarios are summarized in Appendix 1.
The sample of this study consisted of 123 students from a large European uni‑
versity with a mean age of 24.1, and 65% of them female and 35% male, and 72% is working besides university. We conducted our experiment within the online survey design software Qualtrics, which ensured that scenarios were allocated to respond‑
ents in a randomized fashion. The data were analysed in SPSS 23.0.
5.2 Measures
We defined the dependent variables in the light of the findings of previous related studies. There is a large body of literature which examines the effects of over‑
compensation and the findings are diverse and often contradictory; therefore, we took care to define these variables in a way which could help us to at least par‑
tially explain the somewhat paradoxical findings of earlier studies. We defined three dependent variables. To ensure the validity of the scales, we used existing scales from the literature. In order to ensure correct translation of the items, we used back‑
translation (Brislin 1970) in an iterative and collaborative approach (Douglas and Craig 2007). Items of the scales were translated separately from English to Hungar‑
ian by two professionals. After reaching consensus, the items were back‑translated by a third experienced researcher and after several iterations, the team reached con‑
sensus. The questionnaire was pilot tested by 10 respondents.
To measure postcomplaint satisfaction, we used a three‑item scale based on Mat‑
tila and Patterson (2004) and Noone and Lee (2011): “Overall, how satisfied would you be with your customer service experience on this particular occasion?” “How satisfied would you be with the company’ handling of the problem?” “Regarding this particular event, how satisfied would you be with the company’s response to the problem?” (Cronbach’s α = 0.81). To measure fairness, we used a three‑item scale based on Mattila and Patterson (2004): “How fair was the employee in resolving your problem?” “How fair was the effort the company put into the problem solv‑
ing?” “How fair was the service recovery you received?” (Cronbach’s α = 0.82).
Satisfaction with compensation refers in our case to satisfaction with the amount of compensation. Garrett (1999) used one item to measure compensation satisfac‑
tion that we completed to a four‑item scale using scales developed by Haesoevoets et al. (2014) and Roggeveen et al. (2012) with some modification. As, in this case, the outcome that should be evaluated by respondents is the amount of money the customer received, we used the following items: “I was satisfied with the amount of compensation”, “I would have expected more compensation” (reverse scale) and
“In my opinion on this particular occasion the firm should have provided a higher amount of compensation” (reverse scale). “Regarding this particular event, I am satisfied with the amount of money the company provided me”. After recoding the reversed items, we reached high reliability with Cronbach’s α = 0.85.
Concerning internal validity, we ran a manipulation check and found that in terms of the perceived level of effort (“How would you rate your additional effort in order to get the correct service?” 1—I had to put a lot of effort; 5—no effort), there was a significant difference between the group means (Mno effort = 3.7; Meffort = 3.11;
p < 0.000), which shows that the manipulation works as intended. Looking at the level of overcompensation (“Did you get (a) the amount that was incorrectly billed (b) the incorrectly billed amount plus the same amount as compensation”), the dif‑
ferences between groups were also significant (χ2 < 0.001). In sum, the observed internal validity suggests that respondents had a clear perception of the different levels of the independent variables, which means that these scenarios proved to be adequate to examine the causal relationships that we were interested in. In terms of external validity, we measured the realism of the scenarios and found that respond‑
ents perceived the scenarios as realistic (means are between 4.06 and 4.73 on a 1 to 5 scale).
5.3 Results of Study 2
First, we discuss the results related to the satisfaction with the amount of compensa‑
tion. This will be followed by a discussion of the dimensions of postcomplaint cus‑
tomer satisfaction and of perceived fairness. Table 1 shows the mean values of the dependent variables as a function of the levels of the independent variables.
5.3.1 Satisfaction with the amount of compensation
In our first hypothesis, we assumed that as long as service recovery does not involve significant additional client effort, clients will not expect monetary
Table 1 Mean values of the dependent variables for Study 2 and Study 3 (Five‑point Likert scales) Effort
needed Compensation Satisfaction with the
amount of compensa‑
tion
Postcom‑
plaint satisfaction
Perceived fairness
Study 2
No effort No overcompensation 4.29 4.44 4.41
Overcompensation 4.35 4.5 4.60
Extra effort No overcompensation 3.46 3.40 3.88
Overcompensation 4.10 3.97 4.49
Study 3
No effort Reperformance without overcom‑
pensation 3.83 3.10 4.17
Voucher‑based overcompensation 3.57 4.04 4.36
Cash‑based overcompensation 4.16 4.07 4.67
Extra effort Reperformance without overcom‑
pensation 3.09 2.19 3.47
Voucher‑based overcompensation 3.88 3.46 4.32
Cash‑based overcompensation 4.30 3.51 4.57
compensation in addition to the flawless reperformance of the service. In order to test it, we examined the expectations of customers with regard to compensation under the different scenarios. To test the hypothesis, one‑way factorial ANOVA was run, where we examined the effect of the level of compensation (independ‑
ent variable) on customer satisfaction with the compensation received (dependent variable).
The numbers in Table 2 show that both of our independent variables are sig‑
nificant individually as well as in terms of the interaction effect (p < 0.05). This result allows us to investigate the moderation effect of customer effort on over‑
compensation. While the means for the “no effort” situation are significantly not different (Mno overcomp = 4.29 vs. Movercomp = 4.35, not significant), the difference in case of “effort” situation is significant (Mno overcomp = 4.29 vs. Movercomp = 4.35;
p < 0.01).
This indicates that as long as the customer is not required to make signifi‑
cant additional effort, the average compensation satisfaction values do not differ significantly between the different levels of compensation. In the light of these results, we accept Hypothesis 1. As long as customers are not required to make significant effort, they do not expect overcompensation in addition to the correct performance of the service.
Although customers do not expect higher amount of compensation, they may become more satisfied in general if they receive it. In our next analysis, we inves‑
tigate the effect of customer effort and overcompensation on the satisfaction with overall service recovery.
Table 2 Main and interaction effects of Study 2 Independent variable Type III sum
of squares df Mean square F Sig Partial eta squared Satisfaction with the amount of compensation
Level of effort 8.857 1 8.857 20.098 0.000 0.144
Compensation 3.724 1 3.724 8.451 0.004 0.066
Effort × compensation 2.460 1 2.460 5.582 0.020 0.045
R2 = 0.237 (Adjusted R2 = 0.218) Postcomplaint satisfaction
Level of effort 11.600 1 11.600 30.886 0.000 0.206
Compensation 7.166 1 7.166 19.080 0.000 0.138
Effort × compensation 0.259 1 0.259 0.689 0.408 0.006
R2 = 0.324 (Adjusted R2 = 0.307) Perceived fairness
Level of effort 3.148 1 3.148 10.776 0.001 0.083
Compensation 4.850 1 4.850 16.603 0.000 0.122
Effort × compensation 1.319 1 1.319 4.516 0.036 0.037
R2 = 0.227 (Adjusted R2 = 0.208)
5.3.2 Postcomplaint satisfaction
The testing of H2(a) and H3(a) means the investigation of the main and interac‑
tion effects of the independent variables on postcomplaint satisfaction. We con‑
ducted one‑way factorial analysis of variance (ANOVA). The results of the F‑test show that both additional effort and overcompensation have a significant main effect on postcomplaint satisfaction, while the interaction effect is not signifi‑
cant (Table 2). The R2 measure indicates that additional effort and compensation, taken together, explain 32.4% of the variance of postcomplaint satisfaction.
Looking at the main effects, we find that the level of overall postcomplaint satisfaction is higher in case of no additional customer effort than it is in case of significant additional customer effort. (Mno effort = 4.33; Meffort = 3.66; p < 0.000).
Based on this, we can accept Hypothesis 2(a).
As the interaction effect is not significant we have to draw the conclusion that the effect of overcompensation does not diminish with the lack of customer effort.
This means that Hypothesis 3(a) has to be rejected, i.e. customers feel increased overall satisfaction in case of overcompensation even if they are not required to make extra effort.
5.3.3 Perception of fairness
In order to test H2(b) and H3(b), we examined the main and interaction effects of additional customer effort and the level of compensation with regard to the dependent variable, in this case, the perceived fairness of service recovery with the help of ANOVA. The F‑test results show that both of our independent vari‑
ables (p < 0.001) and their interaction (p < 0.05) have a significant effect on per‑
ceived fairness. The R2 measure shows that a model with these two independent variables explains 23% of the variation of perceived fairness. (Table 2).
Looking at main effects, the lack of additional effort is associated with a higher level of perceived fairness (Mno effort = 4.52; Meffort = 4.16; p < 0.05). Because of this, we can accept Hypothesis 2(b).
The significant interaction term indicates that additional effort moderates the effect of overcompensation. If there is an additional customer effort, then over‑
compensated respondents have significantly higher perception of fairness than those respondents who received no overcompensation (Mno overcomp, effort = 3.88;
Movercomp, effort = 4.49; p < 0.001). In contrast, this significant relationship disappears in case of the “no effort” situation (Mno overcomp, no effort = 4.60;
Movercomp, no effort = 4.41; n.s.). Because of this, Hypothesis 3(b) can be accepted.
6 Study 3: effect of effort and form of compensation
In Study 3, we incorporated the testing of our fourth hypothesis, plus we wished to reinforce the results of Study 2 by replicating the hypothesis testing for the first three hypotheses in a different context.
6.1 Design and measures
In order to increase the robustness of the results, we selected a different context from the previous study. When developing the scenarios, we chose dry cleaning as the service and the wrinkled state of the dress as the service failure. The failure in this case was not a monetary type failure (wrong bill) but a physical type (wrinkled dress) and the recovery was not a refund but a reperformance.
Our first independent variable was similar that of the first experiment, it relates to the concept of additional customer effort and has two levels: significant additional customer effort and insignificant additional customer effort.
We took care to ensure that while the magnitude of the additional customer effort is being manipulated (in one group of scenarios, the dress will be re‑ironed straight away, whereas in another group, the customer needs to come back the next day), the type of the service failure (a wrinkled dress) remains the same. In those sce‑
narios where the service failure is fixed instantly, customers are only required to put in insignificant additional effort; whereas in those scenarios where customers are required to return later, this requires the customers to exert significant additional effort (summary of the scenarios is in Appendix 1).
In contrast to the first experiment, our second independent variable, the level of compensation, was manipulated on three levels, as we added a different format of the overcompensation, a voucher for future service. In defining the three levels above, we wished to create a situation where we can compare simple reperformance without additional compensation (100% compensation) vs. reperformance with significant overcompensation (200% compensation), on the one hand, and cash‑
based compensation vs. voucher‑based compensation, on the other hand. Based on these considerations, the manipulation was designed as follows: the service fail‑
ure (wrinkled dress) is redressed by (1) reperformance, (2) reperformance and full
‘money back’ in cash and (3) reperformance and full ‘money back’ in the format of a voucher redeemable at the next purchase. In the design, the three variable levels combine the effects of two factors: the level and the form of compensation. Such a variable definition is not without examples in service research, e.g. Sirianni et al.
(2013) have used a similar approach in their work on customer responses to branded services.
We used a convenience sample of consumers. Our total sample size was 223 respondents, with a mean age of 29.1, 77% of them female and 23% male. For this experiment, we applied a 2 × 3 between‑subject factorial design that resulted six scenarios. Again, the scenarios were randomly assigned to respondents, and it was ensured that each scenario was assigned to approximately the same number
of respondents. We conducted our experiment within the online survey design software Qualtrics, which ensured that scenarios were allocated to respondents in a randomized fashion. The data were analysed in SPSS 23.0.
We defined the dependent variables considering the findings of our previous study. Based on the high reliability of the scales that we used and for the sake of parsimonies, we employed one item from each scale. Perceived fairness was measured by the question “How fair do you think the way your complaint was handled?” postcomplaint customer satisfaction was measures with “In this case, how satisfied would you have left the laundry?”, and satisfaction with the amount of compensation “I would have expected more compensation”.
To test manipulations, we ran manipulation checks and found that in terms of the perceived level of effort, there is a significant difference between the group means, which shows that the manipulation works as intended. Looking at the level and type of overcompensation, the differences between group means are also significant. We also measured the realism of the scenarios and found that respondents perceived the scenarios as realistic (means are between 3.22 and 4.03 on a 1 to 5 scale).
6.2 Results of Study 3
Presentation of the result of Study 3 follows the logic of Study 2. Mean values of our dependent variables are presented in Table 1.
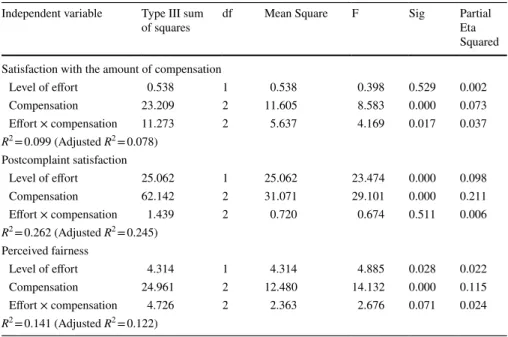
Table 3 Main and interaction effects of Study 3 Independent variable Type III sum
of squares df Mean Square F Sig Partial
Eta Squared
Satisfaction with the amount of compensation
Level of effort 0.538 1 0.538 0.398 0.529 0.002
Compensation 23.209 2 11.605 8.583 0.000 0.073
Effort × compensation 11.273 2 5.637 4.169 0.017 0.037
R2 = 0.099 (Adjusted R2 = 0.078) Postcomplaint satisfaction
Level of effort 25.062 1 25.062 23.474 0.000 0.098
Compensation 62.142 2 31.071 29.101 0.000 0.211
Effort × compensation 1.439 2 0.720 0.674 0.511 0.006
R2 = 0.262 (Adjusted R2 = 0.245) Perceived fairness
Level of effort 4.314 1 4.314 4.885 0.028 0.022
Compensation 24.961 2 12.480 14.132 0.000 0.115
Effort × compensation 4.726 2 2.363 2.676 0.071 0.024
R2 = 0.141 (Adjusted R2 = 0.122)
6.2.1 Satisfaction with the amount of compensation
To test our first hypothesis, we run one‑way factorial ANOVA. As it is presented in Table 3 while additional customer effort does not have a significant main effect (p = 0.53), the interaction effect is significant (p < 0.001).
Based on the results that is represented in Fig. 1, we can state that albeit effort as a main effect does not impact satisfaction with the compensation amount, it moderates the effect of compensation level. This result indicates that our results should be examined separately for the two levels of effort.
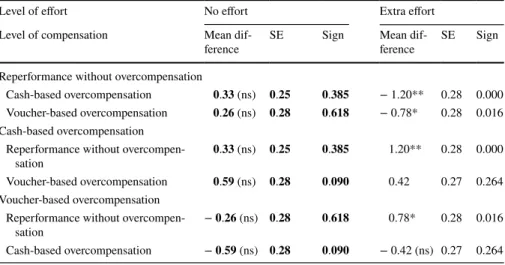
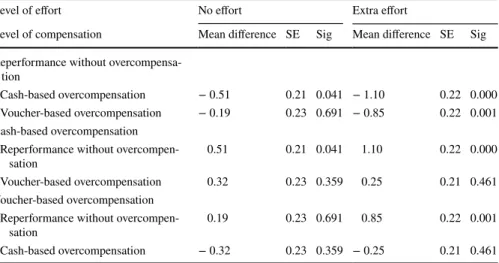
Table 4 shows the results of the post hoc test of the significance of the pairwise differences between the various levels of compensation. Concerning our hypothesis,
2 2.5 3 3.5 4 4.5 5
No effort Extra effort
No overcompensation Cash-based overcompensation Voucher-based overcompensation Satisfaction with the amount of compensation
Level of effort
Level and form of compensation
Fig. 1 Interaction effect of customer effort and compensation on the satisfaction with the amount of com‑
pensation
Table 4 Post hoc test of the effect of compensation on satisfaction with the amount of compensation in relation of customer effort (Study 3)
*p < 0.05, **p < 0.01; (ns) not significant
Level of effort No effort Extra effort
Level of compensation Mean dif‑
ference SE Sign Mean dif‑
ference SE Sign Reperformance without overcompensation
Cash‑based overcompensation 0.33 (ns) 0.25 0.385 − 1.20** 0.28 0.000 Voucher‑based overcompensation 0.26 (ns) 0.28 0.618 − 0.78* 0.28 0.016 Cash‑based overcompensation
Reperformance without overcompen‑
sation 0.33 (ns) 0.25 0.385 1.20** 0.28 0.000
Voucher‑based overcompensation 0.59 (ns) 0.28 0.090 0.42 0.27 0.264 Voucher‑based overcompensation
Reperformance without overcompen‑
sation − 0.26 (ns) 0.28 0.618 0.78* 0.28 0.016
Cash‑based overcompensation − 0.59 (ns) 0.28 0.090 − 0.42 (ns) 0.27 0.264
one should focus on the values corresponding to “no effort” here, none of the dif‑
ferences are significant (Mvoucher = 3.57; Mcash = 4.16 Mno overcomp = 3.83; n.s.). This result reinforces the result of Study 2: as long as customers are not required to make significant additional effort, their satisfaction with the amount of compensation does not differ significantly between the different levels of compensation. To check interaction, the significant differences in case of effort situation indicates that effort moderates in effect the relationship between overcompensation and satisfaction with the amount. Based on these results, we accept Hypothesis 1, if customers are not required to make significant effort, they do not expect overcompensation in addition to the reperformance of the service.
6.2.2 Postcomplaint satisfaction
The results of Study 2 suggest that even if customers do not expect higher amount of compensation, they may become more satisfied in general if they receive it. To examine this assumption, we explore the effect of customer effort and overcompen‑
sation on the satisfaction with overall service recovery (H2(a) and H3(a).
At the same time, during the analysis, we test H4(a) with the investigation of the main effects of the different form of overcompensation on postcomplaint satisfac‑
tion. We conducted one‑way factorial analysis of variance (ANOVA). The results of the F‑test show that both additional effort and overcompensation have a significant main effect on postcomplaint satisfaction, while the interaction effect is not significant (Table 3). The R2 measure indicates that additional effort and compensation, taken together, explain 24.5% of the variance of postcomplaint satisfaction. Based on the main effects, we can state that the level of postcomplaint satisfaction is higher in case of no additional customer effort than it is in case of significant additional customer effort.
(Mno effort = 3.7; Meffort = 3.11; p < 0.000). Based on this, we accept Hypothesis 2(a).
In terms of levels of compensation, perhaps unsurprisingly, the lack of over‑
compensation is associated with the lowest level of postcomplaint satisfaction (Mno comp = 2.70), while in the case of overcompensation, no significant differ‑
ence can be observed between cash‑based and voucher‑based compensation (Mvoucher = 3.70; Mcash = 3.81; not significant) based on the result from the post hoc test (Appendix 2). Thus, hypothesis 4(a) has to be rejected: the form of compensa‑
tion does not affect postcomplaint satisfaction.
Even though our first conclusion, based on the lack of interaction effects, was that the interaction of independent variables does not significantly affect the levels of the dependent variable, a more refined picture emerges from the post hoc Tukey test (Appendix 2). In Hypothesis 3, we hypothesized that if customers need to make additional effort, they will be more satisfied if there is some overcompensation, whereas if no additional effort is needed, than customer satisfaction will not signifi‑
cantly depend on whether there is overcompensation or not. The post hoc test indi‑
cates that the level of postcomplaint satisfaction is significantly different based on the different levels of compensation amount (p < 0.05). However, the form of com‑
pensation does not have a significant relationship with postcomplaint satisfaction on either level of the effort variable. On the contrary, the level of effort does not impact this effect at all: in both cases, satisfaction is higher if there is an overcompensation.
At this point, it is instructive to examine Fig. 2. The horizontal axis shows the lev‑
els of additional customer effort, whereas the lines represent the level and form of overcompensation. The fact that the lines are roughly parallel clearly indicates that cash‑based and voucher‑based compensation leads to higher postcomplaint satis‑
faction even in those cases where there was insignificant additional customer effort required. This means that Hypothesis 3(a) has to be rejected, i.e. customers feel increased satisfaction in case of any form of overcompensation even if they are not required to make extra effort.
6.2.3 Perceived fairness
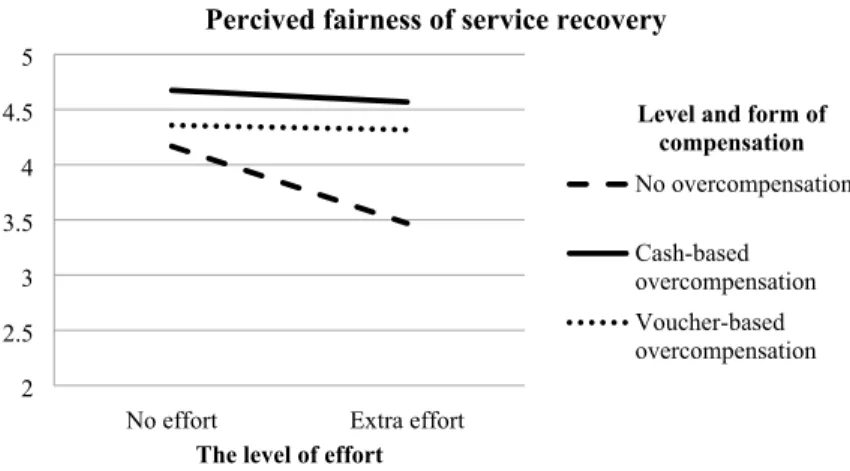
In Study 2, we found support for H2(b) and H3(b). In this subsection, we place H2(b) and H3(b) under further scrutiny, and in addition, we examine H4(b). In order to test these hypotheses, we examined the main effects of additional customer effort and the level and form of compensation with regard to the dependent variable, in this case, the perceived fairness of service recovery with the help of ANOVA. The F‑test results show that while individually, both additional customer effort and the level and form of compensation have a significant effect on perceived fairness (p < 0.05), their interaction does not have a significant effect on the dependent variable—since p is slightly higher than 0.05. The R2 measure shows that a model with these two inde‑
pendent variables explains 14.1% of the variation of perceived fairness. (Table 3).
Table 3 suggests that the main effects of customer effort are significant; thus, the lack of additional effort is associated with a higher level of perceived fairness (Mno effort = 4.41;
Meffort = 4.15; p < 0.05). Based on this result, we accept Hypothesis 2(b).
In terms of the different levels and forms of compensation, our finding is that a lack of overcompensation corresponds to the lowest mean value of the depend‑
ent variable (Mno comp = 3.86), while cash‑based overcompensation resulted in the highest perceived fairness, although the difference between cash‑based and
1 1.5 2 2.5 3 3.5 4 4.5 5
No effort Extra effort
No overcompensation Cash-based overcompensation Voucher-based overcompensation Postcomplaint satisfaction
Level of effort
Level and form of compensation
Fig. 2 Interaction effect of customer effort and compensation on postcomplaint satisfaction