New Echocardiographic Techniques in Rare Cardiological Disorders
Doctoral Thesis
Gabriella Veress MD
Semmelweis University Doctoral School of Basic Medicine
Supervisor
Béla Merkely MD, DSc, Professor of Medicine Official Reviewers
Lívia Jánoskúti MD, PhD
Albert Varga MD, PhD, Professor of Medicine Head of Examination Committee
Zoltán Szabó, MD, PhD, Professor of Medicine Members of Examination Committee
József Borbola, MD, PhD, Professor of Medicine András Zsáry MD, PhD
Budapest 2011
1 Table of contents
1 Table of contents ... 2
2 Abbreviations ... 3
3 Introduction ... 6
3.1 Rare cardiological disorders ... 6
3.1.1 Constrictive pericarditis ... 6
3.1.2 Restrictive cardiomyopathy ... 11
3.1.3 Acute thrombus formation related to endomyocardial biopsy ... 13
3.1.4 Non-compact cardiomyopathy ... 13
3.2 New echocardiographic techniques ... 14
3.1.5 Tissue Doppler echocardiography: principles and applications ... 15
3.1.6 Myocardial strain imaging ... 17
4 Objectives ... 21
5 Methods ... 22
5.1 Methods and patients in tissue Doppler imaging study of constrictive pericarditis ... 22
5.2 Methods and patients in speckle tracking imaging study of constrictive pericarditis and restrictive cardiomyopathy ... 23
5.3 Methods and patients in the echocardiography guided endomyocardial biopsy study 25 5.4 Methods and patients in speckle tracking imaging study of isolated noncompact cardiomyopathy ... 26
6 Results ... 30
6.1 Results in tissue Doppler imaging study of constrictive pericarditis ... 30
6.2 Results in speckle tracking imaging study of constrictive pericarditis and restrictive cardiomyopathy ... 41
6.3 Results in the echocardiography guided endomyocardial biopsy study ... 46
6.4 Results in speckle tracking imaging study of isolated noncompact cardiomyopathy ... 51
7 Discussion ... 62
8 Conclusions ... 77
9 Summary ... 79
10 Összefoglalás ... 80
11 References ... 81
12 Publications…...………94
12.1 Publications related to the thesis………...…….94
12.2 Other publications and citable abstracts………...…………..95
13 Acknowledgement………96
2 Abbreviations
: strain
2D: two-dimensional
A: late diastolic velocity of the mitral wave a’: late diastolic annulus velocity
ACC: American College of Cardiology AF: atrial fibrillation
AHA: American Heart Association
ASE: American Society of Echocardiography BMI: body mass index
BS/BL: basal septum/basal lateral BSA: body surface area
CA: cardiac amyloidosis
CMR: cardiac magnetic resonance
CMR: cine magnetic resonance
COPD: chronic pulmonary obstructive disease CP: constrictive pericarditis
CRT-D: cardiac resynchronization therapy defibrillator CT: computer tomography
DM: diabetes mellitus
DMI: Doppler myocardial imaging
dMV-E: early diastolic peak value for myocardial velocity dSR-E: earlydiastolic strain rate
DT: deceleration time DVT: deep vein thrombosis
E: early diastolic wave of mitral inflow e’: early diastolic annulus velocity EF: ejection fraction
EMB: endomyocardial biopsy FPS: frame per second
Fr: french
HL: hyperlipidemia HR: heart rate HT: hypertension
HTX: heart transplantation ICD: intracardiac defibrillator IJ: internal jugular
iLVNC: isolated left ventricular non-compaction iv.: intravenous
IVRT: isovolumetric relaxation time JVP: jugular venous pressure LA: left atrium
LAVI: left atrial volume index LMWH: low-molecular weight heparin LV rot: left ventricular rotation LV tor: left ventricular torsion LV: left ventricle
LVAD: left ventricular assist device
LVEDD: left ventricular end-diastolic diameter LVEF: left ventricular ejection fraction LVESD: left ventricular end-systolic diameter MM: mycophenolate mofetil
MS/ML: mid septum/mid lateral MV: mitral valve
MVG: myocardial velocity gradient NCCM: non-compact cardiomyopathy PWTDI: pulse wave tissue Doppler imaging
NS: non-significant
PPM: permanent pacemaker PW: posterior wall
RA: right atrium
RCM: restrictive cardiomyopathy ROC: receiver-operating characteristics
RV: right ventricle
RVEDP: right ventricular end-diastolic pressure RVESP: right ventricular end-systolic pressure
S’: systolic annulus velocity sD: systolic displacement SMI: speckle myocardial imaging
sMV: systolic peak value for myocardial velocity SRI: strain rate imaging
SS: systolic strain sSR: systolic strain rate
STE: speckle tracking echocardiography SVC: superior vena cava
vs.: versus
TDI: tissue Doppler imaging
TEE: transesophageal echocardiography TIA: transient ischaemic attack
TTE: transthoracic echocardiography TV: tricuspid valve
3 Introduction
The new echocardiographic techniques characterize the mechanics of myocardial contraction and relaxation precisely and have been applied in numerous cardiac disorders.
There is no substantial amount of information available in cardiac tissue Doppler analysis and deformation imaging, as in strain and strain rate imaging by speckle tracking imaging in rare cardiologic disorders, such as constrictive pericarditis (CP), restrictive cardiomyopathy (RCM) and isolated noncompact cardiomyopathy (iLVNC).
Our studies were focusing on better understanding of the functional and pathophysiological changes in the heart within the above referenced disorders by new echocardiographic techniques. In addition, we have examined the additional benefit of echocardiography guided endomyocardial biopsy (EMB) in lieu of fluoroscopic guidance alone during the procedure relative to the recognition of hitherto unreported sequels.
3.1 Rare cardiological disorders
3.1.1 Constrictive pericarditis
CP is frequently difficult to diagnose even after comprehensive evaluation, and often not considered in the differential diagnosis of patients with heart failure.
Echocardiography has made a significant contribution to the accurate and increasing diagnosis of CP and is the imaging modality of choice for the initial evaluation of patients with suspected CP.
The echocardiographic diagnosis of CP was originally based on M-mode echocardiography findings and subsequently on 2D echocardiography and Doppler hemodynamics.1 M-mode provides useful information in CP, although not specifically diagnostic for the disease. One of the several findings that may be seen on M-mode is thickened pericardium. While 15-20% of CP patients had normal pericardium in a study by Talreja2, mildly increased pericardial thickness can be often missed or often false positive results can be obtained if gain is set too high. Abrupt posterior motion of the interventricular septum with inspiration in early diastole can also be seen, which is the
consequence of the underfilling of the ventricle due to decreased pulmonary vein-left atrial gradient with inspiration.3 Further signs on M-mode are flat posterior LV wall motion in mid-diastole4 and ventricular septal notch in early diastole due to transient reversal of ventricular septal transmural pressure at that time in the cardiac cycle.5, 6 Left atrial enlargement, premature opening of the pulmonary valve caused by the rapid early diastolic filling of the right ventricle7 and abnormalities in posterior aortic root motion, such as sharp downward motion of the posterior aortic root in early diastole can also be observed.
The role of 2D echocardiography initially was to rule out other causes of right heart failure such as pulmonary hypertension, unexpected LV dysfunction or valvular disease.8 In CP normal ventricular dimensions can usually be seen on 2D with normal systolic function, where ejection fraction is typically preserved, although may be impaired in mixed constrictive-restrictive disease.Pericardial thickness and calcification can be assessed to some extent. Transesophageal echocardiography (TEE) is superior to transthoracic echocardiography (TTE) in measuring the pericardial thickness and has an excellent correlation with cardiac tomography (CT).9 The 2003 ACC/AHA/ASE task force gave a class IIb recommendation to TEE assessment of pericardial thickness to support the diagnosis for CP.10 Abnormal ventricular septal motion/early diastolic septal bounce resulting from exaggerated ventricular interaction can be frequently observed.
Elevated right atrial pressures are reflected by a dilated inferior vena cava with minimal or no respiratory variation in its diameter. If present, pericardial or pleural effusion can be identified. Further signs can be observed by 2D echocardiography include displacement of the interatrial septum towards the left atrium (LA) during inspiration, some dilatation of the atria, especially the LA, and an abnormal contour between the posterior LV and the LA posterior walls.11
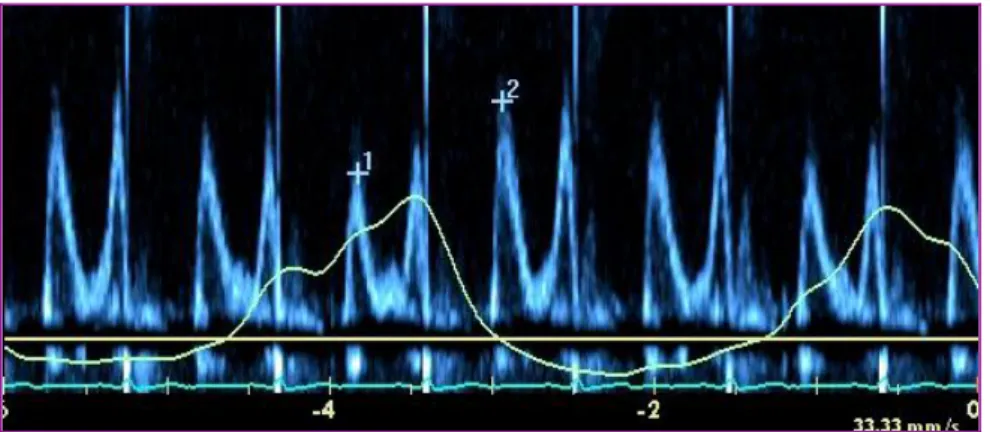
Doppler echocardiography is essential in CP diagnosis showing early increased diastolic filling velocity (E) followed by rapid deceleration leading to a short filling period with mitral E wave typically being <160 ms. In addition, Hatle and Oh described the characteristic mitral inflow respiratory variation exceeding 25% in Doppler flow velocities in CP patients that are not present in patients with RCM. 12, 13 (Figure 1) The major factor responsible for this phenomenon is the dissociation of intrathoracic and intracardiac pressures with respiration.
Figure 1. Mitral inflow in constrictive pericarditis. Characteristic respiratory variation >
25% of mitral E wave (1 vs.2).
Normally, with inspiration the intrathoracic pressure decreases approximately to the same extent as the intracardiac pressure therefore the pressure gradient remains quasi the same. In CP with inspiration, the intrathoracic pressure declination, due to pericardial isolation is not fully transferred to the intracardiac pressure. Consequently, the pressure gradient is lowered and LV diastolic filling is reduced. As in CP the cardiac volume is relatively fixed, this is coupled with a simultaneous RV diastolic filling increase, resulting in left interventricular septum shift. The opposite change occurs with expiration. 13
This respiratory variation in transmitral flow is not present in RCM or in normal subjects but can be observed in patients with chronic obstructive airway disease (COPD).14 For differentiating CP from COPD by Doppler echocardiography superior vena cava (SVC) flow velocities can be recorded. In COPD there is a marked increase in systolic forward flow velocity during inspiration, which is not seen in CP.In CP the SVC diastolic flow velocity exceeds systolic flow velocity and there is little respiratory variation in systolic flow velocity.15
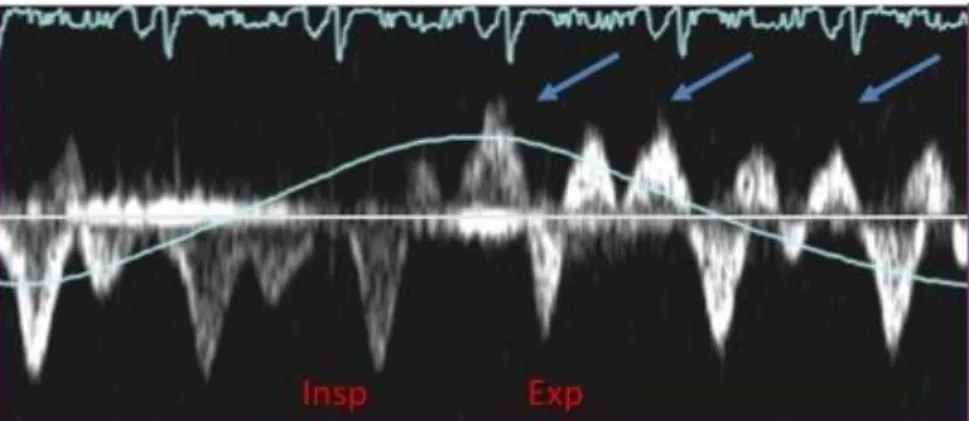
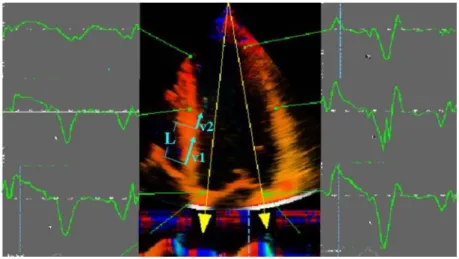
Figure 2. Hepatic vein flow in constrictive pericarditis. Arrows: expiratory, diastolic flow reversal. Insp: inspiration, Exp: expiration.
In addition, in a subset (20%) of CP patients the typical respiratory variation of mitral E velocity may not be present, which can be due to LA pressure increase or to mixed constrictive-restrictive pathophysiology.13 Oh et al proposed in this group of patients additional echocardiographic tests to reduce preload (by head-up tilt, upright position, or diuresis) that may help unmask or enhance respiratory variation on transmitral Doppler flow.16 Atrial fibrillation makes the interpretation of respiratory variation in Doppler velocities difficult, however with meticulous analysis of a longer Doppler strip chart makes the interpretation of underlying hemodynamic mechanism possible.13 Doppler interrogation of the hepatic vein can also be useful for the diagnosis. The pulsed Doppler recording of hepatic venous flow (Figure 2) shows a diastolic flow reversal with expiration, reflecting the ventricular interaction and the dissociation of intracardiac and intrathoracic pressures. In mixed constrictive-restrictive cases both expiratory and inspiratory flow reversal can be seen.13
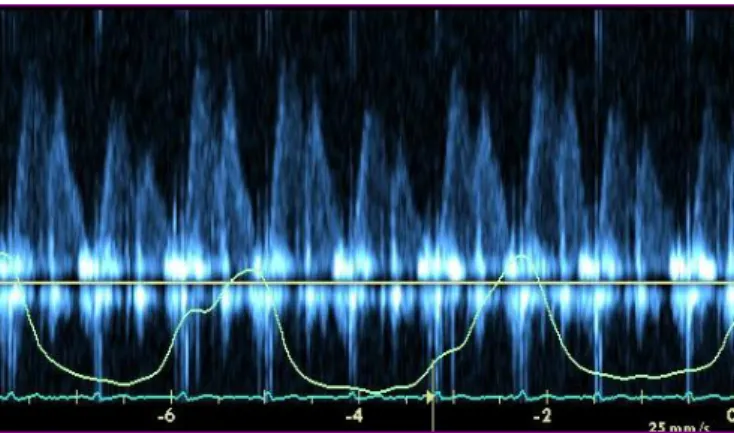
With the help of TEE, pulmonary venous flow can be studied. A peak diastolic flow velocity fall of > 40% on inspiration and a systolic/diastolic flow ratio < 0.65 in inspiration demarcates CP from RCM.17 The respiratory variation in pulmonary venous flow is even more pronounced than in mitral inflow18 (Figure 3).
The assessment of myocardial contraction and relaxation using Doppler myocardial velocity gradient (MVG) at the LV posterior wall may be another method distinguishing CP from RCM. MVG quantifies the spatial distribution of intramural velocities across the myocardium.19 It was shown that MVG was lower in RCM patients compared with
both CP patients and normal controls during ventricular ejection and rapid ventricular filling, measured at the left ventricular posterior wall.20
Figure 3. Pulmonary vein flow in constrictive pericarditis. Marked respiratory change in pulmonary venous flow.
TDI offers a quantitative measurement of regional and global myocardial tissue function. In particular, the assessment of longitudinal mitral annular motion provides an accurate estimate of global LV function21 and it has further facilitated the detection of CP.Since the mechanoelastic properties of the myocardium are preserved in CP, the longitudinal mitral annular velocities remain normal or can be exaggerated as lateral expansion in CP is limited.
Garcia et al were the first to report that measurement of longitudinal axis expansion by TDI provided a clinically useful distinction between CP and RCM.22 Rajagopalan et al showed that a peak e‟ velocity ≥ 8 cm/s could discriminate between the entities CP and RCM with high sensitivity (89%) and specificity (100%).23 Studies by Ha et al and by Sohn et al recommended that e‟ velocity can provide a helpful diagnostic indicator and should be measured routinely in the evaluation of heart failure or suspected CP.24, 25 Ha et al recommended the same 8 cm/s cut off value for CP diagnosis where e‟ velocity is equal or greater than 8 cm/s, with 95% sensitivity and 96% specificity.24 Ha et al also evaluated the role of TDI in the diagnosis of CP in patients without diagnostic respiratory variation of transmitral early diastolic filling velocity. It was confirmed that e‟ velocity was well-preserved independent of any respiratory variation in mitral inflow velocities.26 Other studies suggested that e‟ should be used with caution if CP is combined with myocardial diseases, extensive annular calcification or segmental non- uniform myocardial velocities.27, 28, 29
It has been shown by Choi et al that the addition
of extra parameters to the e‟ velocities such as measurement of s‟ velocities and the time difference between onset of mitral inflow and onset of e‟ increases sensitivity and provide additional information to e‟ for the differentiation of CP from RCM.30
Several investigators have shown that E/e‟ ratio correlates well with LV filling pressure.
31, 32 E/e‟ >15 identifies increased LV filling pressure while E/e‟ <8 describes normal filling pressure. Ha introduced the concept of „annulus paradoxus‟, which describes the paradoxical behavior of the mitral annulus in CP.33 He found that an inverse relationship exists between E/e‟ and LV filling pressure, which can be explained by the fact that in CP the mitral annulus has an exaggerated longitudinal motion leading to an increase in e‟, despite high filling pressures.
In normal subjects, the mitral lateral annulus e‟ velocity is higher than the medial annulus e‟ velocity.34 Reuss et al identified the reversal of the normal relationship of mitral lateral e‟ and medial e‟ velocities in CP, where mitral lateral e‟ velocity is lower than medial e‟ velocity, therefore lateral/medial e‟ ratio is inverted and called „annulus reversus”.35 This finding is based on the tethering of the adjacent fibrotic and scarred pericardium, which influences the lateral mitral annulus in patients with CP. In a patient with preserved mitral e‟ velocities (> 8 cm/sec) and a low E/e‟ratio (< 8) with high LV filling pressure, the recognition of „annulus reversus” should alert to the diagnosis of CP.
In general, TDI offers incremental diagnostic information to M-mode, 2D echo and transmitral flow Doppler for detecting constrictive physiology, with a reported sensitivity and specificity of 88.8% and 94.8%, respectively.27
Kim JS and al examined the medial annular velocities in patients with CP after pericardiectomy in 16 patients and found that e‟ decreased significantly after pericardiectomy.36 However, there is no substantive data on mitral annulus systolic velocity and tricuspid annulus velocity in CP and no data on the effect of pericardiectomy on these annular velocities.
3.1.2 Restrictive cardiomyopathy
The clinical and hemodynamic profiles of restriction (myocardial diastolic heart failure) and constriction (pericardial diastolic heart failure) are similar, even though their pathophysiologic mechanisms are distinctly different. Both are characterized by limited
or restricted diastolic filling with relatively preserved global systolic function. Diastolic dysfunction in RCM is the result of a stiff and noncompliant ventricular myocardium, whereas in CP diastolic dysfunction is related to a thickened or noncompliant pericardium. Both disease process limit diastolic filling and result in diastolic heart failure.
Despite the distinct difference in pathophysiologic mechanisms of restriction and constriction, the hemodynamic variables of these two conditions overlap considerably.
Increased atrial pressures, equalization of end diastolic pressures, and dip-and-plateau (or square root sign) of the ventricular diastolic pressure recording have been widely considered as the hemodynamic features typical of CP.37 Hemodynamic pressure tracings with almost identical characteristics can be obtained from patients who have either constriction or RCM.38 While the echocardiographic features of amyloid infiltration of the heart are fairly characteristic in the advanced stages of the disease, early cardiac infiltration may produce a mixed and confusing picture.
Echocardiographic features of amyloid infiltration of the heart in advanced stages are as follows:
increased LV/RV wall thickness,
enlarged LA,
valve thickening,
usually mild mitral regurgitation,
thickened atrial septum,
E/A ratio >1 and
pericardial effusion.
Making the distinction between CP and RCM is a diagnostic challenge. The diagnosis of CP is clinically important for a timely treatment but often very challenging even after comprehensive evaluation using various cardiovascular imaging and hemodynamic studies.
Strain and strain rate are measures of deformation that are basic descriptors of both the nature and function of cardiac tissue. 2D speckle tracking echocardiography (STE) is a new technique, based on frame-by-frame tracking of tiny echo-dense speckles within the myocardium and subsequent measurement of left ventricular deformation.39, 40
Mitral septal annular velocity is usually increased in patients with CP and higher than the lateral annular velocity.24, 26 We hypothesized that the longitudinal strain of the lateral wall that is in contact with diseased pericardium is lower than that of the medial segments in CP.
3.1.3 Acute thrombus formation related to endomyocardial biopsy
Endomyocardial biopsy is currently the technique most often used in the diagnosis of cardiac transplant rejection and it is the standard method for evaluating infiltrative cardiac lesions, cardiomyopathies and myocarditis.41 It is generally considered a safe procedure but is associated with recognized significant complications related to venous cannulation, arrhythmias and conduction abnormalities as well as inadvertent trauma to cardiac structures such as the tricuspid valve, tricuspid valve apparatus and right ventricular free wall.42 Endomyocardial biopsy is usually performed under fluoroscopic guidance. However, adjunctive echocardiography is increasingly used since it permits precise positioning of the bioptome, minimizing the risk of complications. In addition, echocardiography facilitates prompt recognition and treatment of complications if these do occur.43
3.1.4 Non-compact cardiomyopathy
NCCM is rare, unclassified, congenital cardiomyopathy due to embryogenic arrest of compaction44, previously described as persistent intramyocardial sinusoids. NCCM is genetically heterogenous condition with both familial and sporadic forms described.45 Because of the significant potential for cardiovascular complications, early recognition is essential. It is characterized by segmental thickening of the LV wall consisting of two layers: a thin compacted epicardial layer and a thickened endocardial layer with marked trabeculations and deep intratrabecular recesses. Ventricular noncompaction is often associated with other congenital cardiac malformations, such as obstruction of the left and right ventricular outflow tracts, complex congenital malformations and coronary anomalies.46, 47, 48
The clinical manifestations of noncompacted cardiomyopathy are variable. Patients may be asymptomatic or may demonstrate evidence of congestive heart failure, arrhythmias or systemic emboli.44, 49, 50, 51
Application of the echocardiographic diagnostic criteria for left ventricular non- compaction as postulated by Jenni52 et al together with advances in cardiac imaging techniques have enhanced awareness and diagnosis of left ventricular noncompaction.
The four morphologic criteria for echocardiographic diagnosis are the followings:
lack of coexisting cardiovascular abnormalities,
segmental LV wall thickening with a thin compacted epicardial layer and a thicker noncompacted endocardial layer,
an end-systolic noncompacted-to-compacted myocardial ratio > 2.0 and
the presence of color Doppler flow within the deep intertrabecular recesses.
Patients with these morphologic features may present with normal or abnormal LV function as assessed by EF. Although, iLVNC is included in the 2006 World Health Organization classification of cardiomyopathies, however, its etiology, pathogenesis, diagnosis, and management have to be further defined.
3.2 New echocardiographic techniques
Echocardiography has been a pillar of modern cardiology practice, with several decades of increasing utilization as international practice guidelines progressively expanded the number and type of indications for which this diagnostic modality was approved.53 From the perspective of the single cardiology patient, the standard echocardiogram has provided a comprehensive and rapid assessment of their heart‟s unique structure and function, and played a critical role in allowing each person‟s cardiology care plan to be successfully individualized. Nevertheless, looking towards the future, we can identify several new aspects of echocardiographic techniques that must be tested and, where successful, integrated into recommended practice.
In particular, during recent years remarkable progress has been made in cardiac tissue Doppler analysis, strain and strain rate imaging by speckle tracking imaging. They characterize the mechanics of myocardial contraction and relaxation (deformation imaging) more precisely and find applications in many cardiac pathologies.54 Determination of myocardial function is vital for the clinical evaluation of cardiovascular diseases. It not only helps to establish a diagnosis, but often can provide
important prognostic and management information that is invaluable in a variety of cardiac diseases. Early detection of abnormalities is crucial and may often influence treatments and establish prognosis.
3.1.5 Tissue Doppler echocardiography: principles and applications
TDI is a novel use of ultrasound to image the motion of tissue with Doppler echocardiography. It is a robust and reproducible echocardiographic tool, which has permitted a quantitative assessment of both global and regional function and timing of myocardial events.55, 56
Tissue Doppler velocity estimation is based on the same principles as pulsed-wave and color Doppler echocardiography for blood flow. To distinguish between signals originating from moving tissue and blood flow, a so-called wall filter is used, which is a high-pass filter used to image blood velocities or a low-pass filter used to display tissue velocities. While the intensity of the signals generated by the myocardium is higher than that generated by blood, blood velocity usually exceeds that of the myocardium.57
In clinical practice, the myocardial time-velocity curve can be reconstructed either on line as spectral pulsed TDI or offline from 2D color-coded TDI image loops.58
Pulse wave tissue Doppler imaging (PWTDI) can be seen as the precursor of the more recent Doppler myocardial imaging (DMI) modalities. PWTDI allows for recording of a high-quality Doppler profile of the motion of cardiac structures (e.g. mitral ring). It provides a spectral display of the peak tissue velocities.59 Limitation of pulsed TDI is that simultaneous recording of different ventricular wall segments is not possible.
Because TDI in pulsed mode is characterized by high temporal but low spatial resolution, differentiation between subepicardial and subendocardial myocardial velocities is not possible. Most importantly, the single-point velocity method of spectral tissue imaging does not differentiate between actively contracting and passively moving tissue.
In color-coded TDI each pixel of the Doppler spectrum is colored depending on the direction and mean velocity of the motion of the structures within the field of view.
Thus, objects moving towards the transducer are colored red, while those moving away from it are colored blue. The advantages of color Doppler mapping include the capacity for rapid visual qualitative assessment of movement of structures, good spatial
resolution allowing differentiation of the velocity profiles between subepicardial and subendocardial layers of myocardium and the ability to analyze simultaneously various myocardial segment. Major disadvantage of color-coded TDI is poor temporal resolution.
As with conventional Doppler echocardiography, TDI requires the beam to be aligned parallel to the direction of movement of the structures of interest for accurate assessment. Therefore, the angle between the ultrasound beam and the direction of movement should not exceed 15. Another limitation of TDI is related to the fact that the heart performs complex rotational and translational movements inside the chest, thus distorting the measurements of myocardial velocities.
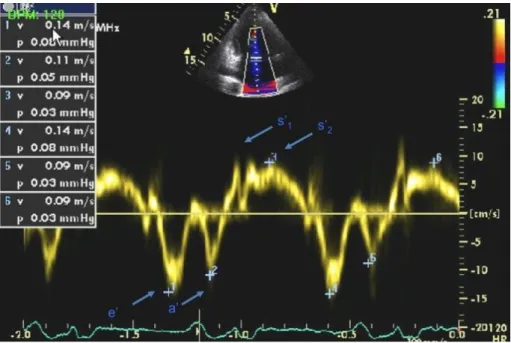
Figure 4. Pulsed Doppler tissue Doppler imaging (TDI) of the mitral annulus. s‟1:tissue velocity wave in the isometric contraction period, s‟2:velocity wave in the ejection period, e‟ and a‟: velocity wave in early and late diastolic periods, respectively.
TDI can be applied to the assessment of both regional and global LV function.
Measuring velocities of myocardial segments gives information about regional ventricular contractility, while the measurement of mitral annular velocities provides information on overall longitudinal LV function. Regardless of the site of the measurement, the normal TDI profile has a characteristic appearance. It consists of a systolic (s‟) wave and early (e‟) and late (a‟) diastolic waves. The systolic wave often has two peaks s‟1 and s‟2. S‟1 reflects isovolumic contraction, while s‟2 occurs during
ejection (Figure 4).
Myocardial velocities tend to decrease from the mitral annulus to the apex. The magnitude of myocardial velocities also depends on the mode of TDI used. In pulsed mode, velocities (peak) are higher than in color Doppler mode (mean velocities).
However, the character of velocity traces does not depend on the mode of scanning.60 Currently, TDI is an integral part of an echocardiography examination in various areas of cardiology.
3.1.6 Myocardial strain imaging
Myocardial velocities measured with TDI may be overestimated or underestimated by translational motion or tethering of the myocardium, respectively. This limitation can be overcome by measuring the actual extent of myocardial deformation (stretching or contraction) by strain () and strain rate imaging (SRI).58 Strain is a representation of myocardial deformation or change in length during systole and diastole. It can be measured utilizing either TDI or, more recently by 2D echocardiographic speckle tracking derived parameters. Strain is a dimensionless index, and reflects the total deformation of the myocardium during cardiac cycle relative to its initial length. For example, if the velocities measured at all points within a moving object are the same, than the object would be described as having displacement. If, on the other hand, different points within an object are moving at different velocities, then the object will exhibit deformation and alter its shape.54 This is the definition of Langranian strain.
Because myocardial deformation or strain is caused by contraction, strain is a measure of myocardial contractile function.61 By convention, lengthening is represented as a positive value for strain, while shortening is represented by a negative value.62 Strain allows for the differentiation of active vs. passive movement within a myocardial segment. Strain rate (SR) is the rate of change (reflects how fast regional myocardial shortening or lengthening occurs) in length calculated as the difference between two velocities normalized to the distance between them; it is expressed as seconds-1. For example, if we assume 20% total Lagrangian strain of a one dimensional object (e.g. the object lengthens from its original length of 2 cm to 2.4 cm) and if the total deformation takes 2 seconds, the average strain rate is equal to 0.20/2 seconds, which is 0.1 s-1: on average, the object lengthens by 10% every second. When the same amount of
deformation occurs in only half this time period (in this example: 1 second) the average strain rate doubles to 0.20/1 second = 0.2 s-1: on average, the object lengthens by 20%
every second. 62 The technique of tissue Doppler derived strain and SR is illustrated in Figure 5. A major limitation of this technique is its dependence on the angle of incidence between the ultrasound beam and myocardial motion. Furthermore, high frame rate imaging, ideally > 130 frames per second (FPS), is required for this type of imaging.
Speckle tracking echocardiography (STE) is an alternative and innovative way to obtain myocardial tissue motion information. 2D strain imaging techniques measure Langrangian strain and SR by tracking echocardiographic B-mode speckles (Figure 6), natural acoustic markers, or acoustic backscatter generated by ultrasound interactions (reflection, scattering and interference) within the myocardium (generally made up of 20-40 pixels). The geometric shift of each speckle represents myocardial motion and can be tracked frame to frame, thus allowing for the calculation of strain and SR. See Figure 7. Specialized software for temporal and spatial tracking provides a pattern recognition algorithm to achieve the most accurate derivation for strain. The optimal frame rate for speckle tracking is between 50 and 70 FPS.58
Figure 5. Tissue Doppler derived strain imaging. The difference in velocities (velocity gradient) between two different regions (v1 and v2) at a known distance (L) is measured; this allows for the calculation of strain rate (SR): (v1-v2)/ L; Strain () can be back calculated by using the temporal integration of the SR (= SR x dt).
Figure 6. Typical speckle pattern in the myocardium. The two enlarged areas show completely different speckle patterns, which is due to the randomness of the
interference. This creates a unique pattern for any selected region, providing both identification of the region and the degree of displacement of the region in the next frame.
Previous studies have depicted LV architecture as a transmural continuum between two helical fiber geometries, where right-handed helical geometry in the subendocardial region gradually changes into lefthanded geometry in the subepicardial region.63, 64 Thus, cardiac motion is a complex process involving rotation, contraction, and shortening.65
STE is simple to perform, it requires only one cardiac cycle, and further processing and interpretation can be done offline. The software only requires harmonic and high frame rate imaging. The real power of speckle analysis is the ability to examine several components or planes (i.e. radial, longitudinal and circumferential) in a single data set.
Myocardial strain quantification by STE has been well validated, using sonomicrometry and tagged cMR as reference methods.66 STE strain measurements are accurate, with minimal bias and low intra- and interobserver variabilities, and are valid in patients with and without wall motion abnormalities. More recently, STE has been used to evaluate new indices of systolic function, particularly longitudinal strain.67
Figure 7. Speckle tracking technique. In the speckle tracking technique, a defined region (Kernel) is tracked, following a search algorithm trying to recognize the most similar speckle pattern from one frame to another. The initial frame is shown in green.
Within a defined search area, the new position of the kernel in the next frame (red) can be recognized by finding the same speckle pattern in a new position, indicating that each speckle has moved the same distance in the same direction (thin blue arrows). This allows measurement of the movement of the whole kernel (thick blue arrow), which is the same distance as that of the individual speckles.
STE also offers the unique opportunity to assess torsional deformation of the LV.
Indeed, LV contraction not only generates shortening and thickening, but also torsion.
Due to the orientation of LV muscle fibres varying across the LV wall – from a right hand helix in the subendocardium, through circumferential fibres in the midwall, to a left hand helix in the subepicardium – the shortening of obliquely oriented LV fibres generates a wringing motion responsible for LV torsion.68. 69 During the cardiac cycle, a systolic twist and an early diastolic untwist are generated by opposite basal and apical rotations. When viewed from the apex during systole, the apex rotates counter clockwise relative to the base. Torsion, or twist, plays an important role in ejection and in the storage of potential energy at end systole, the release of this energy as elastic recoil during early diastole assists ventricular suction.67
For the investigations detailed in this thesis we performed all strain and strain rate measurements by 2D STE.
4 Objectives
The objectives of the present dissertation were the followings:
to assess the characterization of the mitral and tricuspid annular velocity changes by tissue Doppler imaging in patients with constrictive pericarditis (CP) who underwent pericardiectomy in order to get further insight into the mechanism of annulus motion in CP and to define the diagnostic threshold between primary and secondary CP subgroups,
to investigate the usefulness of the ratio of medial/lateral strain measurement by speckle tracking echocardiography in the differential diagnosis of CP from restrictive myocardial diseases,
to perform an analysis of the 189 echocardiography-guided endomyocardial biopsy (EMB) procedures in search of new complications previously undetected by fluoroscopy alone and to describe the characteristics, procedural details, clinical significance and treatment of patients who developed an acute right sided thrombus during the procedure and
to determine the potential role of speckle myocardial imaging (SMI) for identifying left ventricular dysfunction in patients with isolated left ventricular non-compaction (iLVNC) who have no evidence on two- dimensional imaging or standard Doppler of cardiac impairment and to establish which of the SMI modalities is the most accurate for detection of early left ventricular dysfunction in patients with iLVNC.
5 Methods
The study population consisted of a total of 366 patients in the four presented studies, 288 (99 patients with CP, 189 patients who underwent endomyocardial biopsies), retrospectively enrolled patients between January 2006 and April 2009 and 80 (15 patients with CP, 15 with CA and 20 with iLVNC and 40 control subjects) prospectively enrolled patients between July 2006 through 2009 at the Cardiovascular Division of Mayo Clinic, Rochester, Minnesota. The protocols of the studies were approved by Institutional Review Board of Mayo Clinic. Informed consent was given to patients enrolled in the studies. All patients underwent comprehensive echocardiographic examination.
5.1 Methods and patients in tissue Doppler imaging study of constrictive pericarditis
From January 2006 through September 2008, 183 patients had pericardiectomy at the Mayo Clinic, Rochester, Minnesota. We excluded 41 patients who had pericardiectomy due to recurrent or relapsing pericarditis but no evidence of CP. Also excluded were 43 patients who had concomitant valve surgery or coronary artery bypass grafting at the time of pericardiectomy. Hence, the study population consisted of 99 patients (72 men and 27 women; mean age, 58±15 years) with surgically proven CP who had comprehensive echocardiographic examination before and after pericardiectomy. Since concomitant myocardial disease can affect annulus velocities, we divided patients into 2 groups based on the underlying etiology of CP, i.e. primary CP (idiopathic, postpericarditis, viral etiology; n=52) and secondary CP (due to surgery or radiation;
n=47). The clinical profile and echocardiographic findings for both groups were compared before and after pericardiectomy.
Echocardiography examination. All patients had comprehensive evaluation with M- mode, 2-D and pulsed-wave Doppler echocardiography with a respirometer recording and TDI before and after pericardiectomy. Left ventricular ejection fraction (LVEF) was calculated by 2D echocardiography with a modification of the method of Quinones et al.70 Left atrial volume was measured by the modified biplane area-length method.71 Right ventricular systolic function was visually assessed. From the mitral inflow
velocities by pulsed wave Doppler echocardiography, the following variables were measured: peak velocities of early (E) and late filling (A) and E wave deceleration time (DT). Peak annular velocities were measured from the apical four chamber view at systole (s‟), early (e‟) and late (a‟) diastole with a 2–5 mm tissue Doppler sample volume placed at the septal corner and at the mitral and tricuspid lateral annuli. In patients with atrial fibrillation (AF), five consecutive signals were measured and averaged.
Diagnosis of constrictive pericarditis. Clinical, hemodynamic and echocardiographic findings were considered but the final diagnosis of CP was confirmed at the time of surgery in all study patients.
Operative details. Pericardiectomy was performed via a sternotomy or left thoracotomy incision. The standard pericardial resection at our institution is comprehensive, with removal of the diaphragmatic component, the anterior pericardium from phrenic nerve to phrenic nerve as well as that posterior to the left phrenic nerve. In most patients, radical pericardiectomy was performed. Where this was not achievable, as much pericardium was resected as possible. Visceral pericardium was also removed as required.
Statistical analysis. Descriptive data are reported as mean ± SD or count (percent), as appropriate. The Shapiro-Wilk test was used to check the normality of the outcome distributions. Paired t-tests (or Wilcoxon signed-rank tests for non-normal data) were used to assess the echocardiographic parameters before and after pericardiectomy. In addition, comparisons between 2 groups were done with the t-test (or Wilcoxon Rank- Sum test for non-normal data). Differences were considered statistically significant at p< 0.05. For all outcomes, Spearman correlations were computed. All analyses were performed using JMP statistical software (version 8, SAS Institute Inc., Cary, NC)
5.2 Methods and patients in speckle tracking imaging study of constrictive pericarditis and restrictive cardiomyopathy
For the differential diagnosis of CP and RCM, a total of 45 patients (15 patients with CP, 15 patients with cardiac amyloidosis (CA) and 15 control subjects) who agreed to join the present study and gave informed consent were prospectively enrolled from patients undergoing evaluation in the Cardiovascular Division at the Mayo Clinic,
Rochester Minnesota, from December 2008 through September 2009 referred for an echocardiogram. Other inclusion criteria were left ventricular ejection fraction (LVEF)
> 45%, age > 18 years old and clinically stable patients. Exclusion criteria were more than moderate degree of valvular heart disease, difficult echocardiographic images and present regional wall motion abnormalities. The control subjects were selected from colleagues or trainees who agreed to join the study.
All patients with CP had clinical and echocardiographic evidence of increased right- sided filling pressures. Additional tests for assessment of CP included computed tomography (CT) in 7 patients (47%), CMR in 7 patients (47%), coronary angiography and assessment of cardiac hemodynamics using cardiac catheterization in 8 (53%) patients. Pericardial thickening were noted in 7 patients and calcification were noted in 4 patients by CMR or CT.
RCM was defined as myocardial disease that was characterized by restrictive physiology demonstrated by Doppler transmitral diastolic flow velocity, reduced diastolic LV volumes and LVEF >45%. The underlying etiology of RCM was biopsy proven systemic amyloidosis in all cases.
Echocardiography examination was performed on the patient in the left lateral decubitus position using Artida (Toshiba, Japan) with a PST-30SBT probe. The thickness of the ventricular septum and LV and LV posterior wall, the end-systolic and end-diastolic LV diameters were determined from M-mode or two-dimensional imaging and LV mass and EF were calculated. Left atrial volume measurement and pulsed wave Doppler of mitral inflow were carried out as previously described.78 Both LV mass and left atrial volume were indexed to body surface area. Peak annular velocities were measured from the apical 4-chamber view at peak annular systole (s‟), early (e‟) and late (a‟) diastole with a 2-to-5-mm sample volume placed at the septal corner and at the mitral and tricuspid lateral annuli by tissue Doppler echocardiography.
The longitudinal strain was assessed by 2D Speckle Tracking Analysis from apical 4- chamber views using wall motion tracking software (Toshiba, Artida). Following manual initialization of the LV endocardial border, endocardial contours were tracked automatically frame by frame, with the papillary muscles included in the LV cavity.
Epicardial contours were manually adjusted when necessary to optimize the boundary position. The LV segments were divided into basal, mid and apical segments. The ratios
of the medial/lateral strains were assessed. Frame rates were set in 50 to 70 Hz in this study.
Statistical analysis. Continuous variables are expressed as mean ± standard deviation.
Continuous variables were assessed with the paired t test. Univariate logistic regression was used to predict disease status (constriction vs. restriction) and areas under the curve were calculated. Specific cut points were investigated and specificities and sensitivities were calculated for those cut-points. A value of p< 0.05 was considered significant.
5.3 Methods and patients in the echocardiography guided endomyocardial biopsy study
We identified all patients who underwent endomyocardial biopsy at Mayo Clinic, Rochester MN from June 2008 to April 2009 and retrospectively reviewed all the charts of patients undergoing echocardiographic guided endomyocardial biopsies. At Mayo Clinic, echocardiography is used as a supplemental imaging modality to guide EMB in patients undergoing EMB to diagnose myocardial diseases in patients with ventricular dysfunction or who are undergoing surveillance biopsies who are less than 3 month post transplant. Patients who undergo biopsies beyond 3 months post transplant usually have the procedure performed under fluoroscopic guidance alone since cardiac perforation is considered unlikely. We recorded the indication for EMB, route of biopsy, number of biopsy specimens taken and whether the procedure was complicated by thrombus formation.
The EMB undertaken in these patients was performed as follows: in the cardiac catheterization laboratory, either the right internal jugular, or the right or left femoral vein was prepped and draped. After instillation of a local anesthetic agent, the right or left femoral/ right internal jugular vein was entered using the percutaneous technique.
An 11cm sheath (ranging in caliber from 7 to 9 French) was placed if an internal jugular vein approach was used. If a trans-femoral route was used an 8 French Mullins sheath was inserted into the femoral vein. Next, a bioptome (ranging in caliber from 6 to 9 French), manufactured by Cordis or Scholten Surgical, was inserted into the sheath and advanced to the right ventricle. Once the position of the bioptome tip was in an ideal location, guided by transthoracic echocardiography (see below), an endomyocardial biopsy was obtained. After each biopsy the bioptome was removed from the heart and
reinserted until a satisfactory number of specimens had been obtained. The venous sheaths were not routinely flushed during the procedure. After the last biopsy specimen had been obtained, the bioptome and sheath were removed and pressure was applied to the puncture site until hemostasis was achieved. The procedure was performed under fluoroscopic and echocardiographic guidance.
Echocardiographic imaging was performed using iE33 Philips transthoracic machine with an S5-1 probe and GE Vivid I laptop machine with a GE 3S-rs probe. Harmonic imaging was routinely used to optimize image quality. The patient was imaged in the cardiac catheterization laboratory while lying supine on the procedure table. Generally, the patient was already prepped and draped prior to imaging. No specific echocardiographic views were obtained. Generally scanning was performed left-handed from the left side of the bed and apical or para-apical views were obtained. Attention was paid to obtain the best longitudinal axis images of the right atrium and right ventricle, tricuspid valve and tricuspid apparatus as well as ensuring the bioptome tip could be visualized in the right ventricle prior to biopsy. Baseline imaging was performed immediately before the procedure and then imaging repeated during bioptome insertion, positioning and biopsy and immediately on withdrawal of the bioptome to evaluate for tricuspid regurgitation and assess for a pericardial effusion.
This imaging sequence was repeated for each biopsy attempt until the conclusion of the case. Occasionally, due to poor apical window image quality a subcostal window was used.
5.4 Methods and patients in speckle tracking imaging study of isolated noncompact cardiomyopathy
For the early detection of myocardial impairment in isolated left ventricular non- compaction, the following methods and patient population were used. Exclusion criteria included age < 18 years old, history of moderate or greater systemic or pulmonary hypertension, significant valvular heart disease, clinical or electrocardiographic evidence of ischemic heart disease and evidence of concomitant complex congenital heart disease. Controls (group I) were selected from patients undergoing clinically- indicated echocardiography who had no cardiac symptoms, and no history of hypertension or cardiac disease. They were referred to the echocardiography laboratory
for atypical chest pain (n=6), low-intensity systolic murmur at physical examination (n=4), or to define risk of imminent non-cardiac surgery (n=10). Patients with iLVNC were divided in two groups based on the EF: patients with an EF > 50% (n = 10) were labeled as group II; patients with EF ≤ 50% (n = 10) were labeled as group III.
All ultrasound examinations were performed with a commercially available echocardiographic instrument (Vivid 7; GE Healthcare, Milwaukee, WI). The thickness of the ventricular septum and LV posterior wall, the end-systolic and end-diastolic LV diameters were determined from M-mode or 2D imaging, and LV mass and EF were calculated as previously described.72 Pulsed wave Doppler of mitral inflow, and LV outflow was performed as previously described.72 Pulsed wave tissue Doppler Imaging (PWTDI) was measured placing the sample volume on the medial mitral annulus in the apical 4-chamber view. Off-line analysis of standard echocardiographic variables was performed with the use of dedicated software (ProSolv CV analyzer version 3.0); three consecutive beats were measured and averaged for each measurement.
For SMI, apical 4-chamber, long axis, and 2-chamber views were acquired, as well as parasternal short axis view at basal, mid and apical LV level, as previously described (Figure 8).73 In addition, narrow sector views were acquired for each left ventricular wall from apical views. 2D recordings were collected with a frame rate ranging from 60 (full apical views) to 160 (narrow sector views) frames/sec during brief breath hold.
Three consecutive cardiac cycles were recorded as 2D cine loops and the acquired raw data were saved on magneto optical disks or DVDs for offline analysis.
Longitudinal systolic peak values were determined for myocardial velocity (sMV), displacement (sD) strain rate (sSR) and strain (sS). Longitudinal early diastolic peak values were determined for myocardial velocity (dMV-E) and strain rate (dSR-E).
Radial and circumferential systolic and early diastolic peak values were measured for sSR, dSR-E, and sS. For longtudinal SMI, analysis was performed considering a model of 18 LV segments individually and also combining them in clusters according to two different criteria. The first criterion was determined by LV level (basal, middle and apical). The SMI values (sMVI, dMV-E, sD, sSR, dSR-E, and sS) were averaged for the 6 basal segments (basal mean), for the 6 middle segments (middle mean) and for the 6 apical segments (apical mean). The second criterion was determined by LV wall. The SMI values were averaged for the anterolateral, inferoseptal, posterior, anteroseptal,
inferior and anterior walls. The averaged LV rotation and rotational velocity profile from six segments of short-axis views at the basal and apical levels were used for the calculation of LV torsion as elsewhere described.74 After procurements of LV rotation at the two short-axis levels, LV torsion was calculated as the net difference between LV rotation angles obtained from basal (clockwise) and apical (counterclockwise) short axis planes at the same time point, that is, LV torsion (degree) = (apical LV rotation - basal LV rotation).
In the current version of the software used for the measurement of SMI values (Echopac BT09, GE Vingmend Ultrasound Medical Systems, Milwaukee, Wisconsin, USA), the tracking quality for each segment was automatically evaluated and summarized in the tracking table as V (valid tracking) and X (not acceptable tracking).
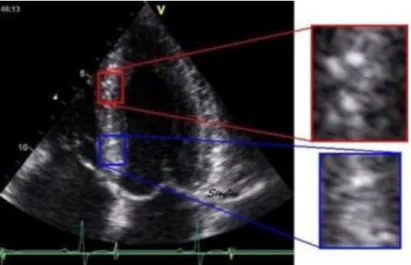
Figure 8. Speckle tracking of the lateral wall (apical 4 chamber, narrow view) in a patient with overt isolated left ventricular non-compaction. The image was analyzed offline with the help of a specific software (ECHOPAC BTW09 GE Vingmend Ultrasound medical systems), tracking quality for each segment is reported at the bottom of the figure.
Cardiac magnetic resonance. ECG-gated CMR was performed on a 1.5T system (Twin speed EXCITE, GE Healthcare, Waukesha, WI, Figure 9) and consisted of steady-state free precession (SSFP) cine-imaging using an eight-element phased-array cardiac coilfor signal reception. Left ventricular function was obtainedwith cine images
using a steady-state free precession (SSFP)technique (TR/TE, 3.5/1.4; matrix, 192 x 192; field of view, 34 x 34 cm; slice thickness, 8 mm) obtained in 2-chamber, 4- chamber,and short-axis planes.
Assessment of the CMR‟s was performed by one observer by off line measurements of the compacted and non-compacted myocardium in each segment of the 17 segment model.
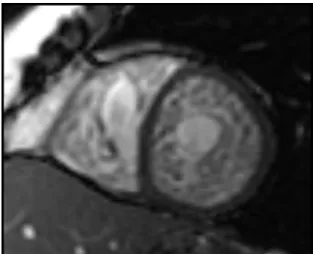
Figure 9. Short axis cardiovascular magnetic resonance (CMR) of a steady state free precession (SSFP) image illustrating severe myocardial trabeculation with deep
intertrabecular recesses. Biventricular myocardial involvement with features consistent with non-compaction can be appreciated.
Statistical analyses were performed with a commercially available software program (STATA v10.1, STATA Institute, Cary, TX, USA). Pairwise comparisons between groups were made by Wilcoxon Rank Sum test, Fisher exact test, or exact inference for ordered contingency tables. For measurements of the longitudinal sS at the basal, mid, and apical segments, considering each group separately, a repeated-measures analysis of variance (ANOVA) containing group and segment effects was carried out and the group-segment interaction was fitted. Differences across the three segments within each group were compared using ANOVA for repeated measures. A p-value less than 0.05 for repeated-measures ANOVA was considered statistically significant. Diagnostic accuracy of the SMI modalities (longitudinal, radial, circumferential and rotation/torsion), including global mean values, mean value for clusters and measurements for individual LV segments, was compared by the receiver operating characteristics (ROC) curves for patients with iLVNC and EF > 50% vs controls.
Formal comparisons of the areas under the ROC curves (AUC) were performed as well, using the method of Delong and Delong75 for comparing AUC between two tests performed on the same subjects.
To examine intra-observer variability (repeatability), a sample of 10 echocardiographic examinations was randomly selected for masked review by the same investigator. To examine inter-observer variability a co-investigator blinded to the clinical information and to the results of the first investigator examined 10 randomly selected echocardiographic exams. Intraclass correlation coefficients (ICCs) for the same observer and different observers were calculated using previously described formulae76 for single segments and for the global mean of each DMI modality. Data are expressed as mean value ± SD, or count (percent). A difference was considered statistically significant when the p-value was less than 0.05.
6 Results
6.1 Results in tissue Doppler imaging study of constrictive pericarditis
To assess the characterization of the mitral and tricuspid annular velocity changes in patients with CP who underwent pericardiectomy, the following results were obtained.
Of the 99 patients, CP was secondary to previous cardiac surgery in 34 (34.4%), previous radiation therapy in 13 (13.1%), other causes (postpericarditis, autoimmune, etc.) in 19 (19.2%), and idiopathic in 33 (33.3%). Their mean age was 58±15 years; 72 (73%) were men; patients in the secondary CP group were older (61±13 vs. 53±16 years, p=0.0053). Sinus rhythm was present in 83% of primary CP patients and 83% of secondary CP. Body mass index was 28.5±5 vs. 27.5±5 kg/m2, and body surface area was 1.99±0.3vs. 1.98±0.2 m2, respectively.
Two-dimensional and Doppler echocardiography. Follow-up echocardiograms were obtained 51±131 (range, 0 to 778 days) days after pericardiectomy. Table 1 lists 2D and Doppler echocardiographic data before and after pericardiectomy. Before pericardiectomy, biatrial enlargement was reported in 26 (50%) primary and 32 (68%) secondary CP patients. Apart from mitral A velocity, there were no significant differences between the two subgroups before pericardiectomy. Following
pericardiectomy, only LV end-diastolic dimension was significantly different between these subgroups.
Prior to pericardiectomy, RV function was normal or mildly decreased in 95% of patients, and moderate to severely decreased in 5%. After surgery, these proportions were 81% and 19%, respectively.
Before pericardiectomy After pericardiectomy All
patients
Primary CP
Secondary
CP P All
patients
Primary CP
Secondary
CP P P† P‡
LVEDD
(mm) 43±6 43±6 43±5 0.72 44±6 45±6 42±5 0.045 0.008 0.58
LVESD
(mm) 28±4 28±4 28±4 0.25 28
(24,32) 29±5 28±6 0.30 0.11 0.87
LVEF
(%) 59±7 60±7 58±7 0.12 60
(54,66)
62
(55,66) 59±10 0.50 0.68 0.26 LAVI
(ml/m2)
33 (28,45)
33 (26,40)
32
(29,52) 0.46 48±17 47±14 48±17 0.71 0.004 0.03
6 E (m/s) 0.9
(0.7,1.1) 0.9±0.3 0.9
(0.7,1.2) 0.21 1.0
(0.8,1.2) 1±0.2 1.0
(0.8,1.3) 0.36 0.07 0.93 A (m/s) 0.5
(0.4,0.6)
0.5 (0.4,0.6)
0.5
(0.5,0.7) 0.023 0.6
(0.4,0.7) 0.6±0.2 0.6±0.2 0.31 0.039 0.17
E/A 1.7
(1.4,2.2)
1.8 (1.5,2.3)
1.6
(1.3,2.1) 0.42 1.9±0.8 1.9±0.9 1.9±0.7 0.99 0.73 0.76 DT (ms) 155±31 154±31 156±32 0.87 156±33 164±35 148±24 0.06 0.10 0.36 Table 1. General two-dimensional and Doppler echocardiographic parameters in 99 patients with constrictive pericarditis (CP).
comparing primary and secondary CP values, †comparing pre- and post-pericardiectomy values in primary CP, ‡comparing pre- and post-pericardiectomy values in secondary CP, not normal distribution values shown as: median (25th, 75th percentile), A: late diastolic velocity of mitral inflow; DT: deceleration time; E: early diastolic velocity of mitral inflow; E/A: early/late filling ratio; LAVI: left atrial volume index; LVEDD: left ventricular end-diastolic diameter; LVEF: left ventricular ejection fraction; LVESD: left ventricular end-systolic diameter, NS: not significant.
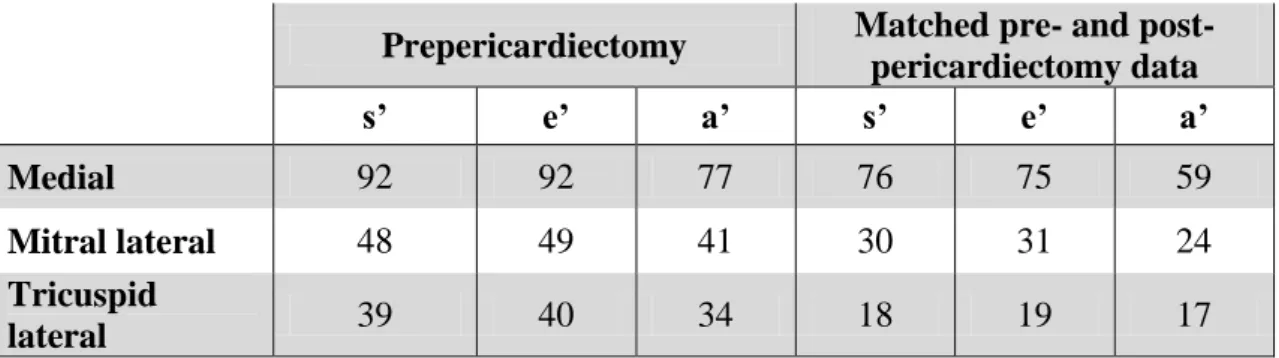
Tissue Doppler imaging. Table 2 shows the TDI data points available for analysis, and Table 3 their overall mean values. Among analyzable patients, a medial e‟ velocity ≥ 8 cm/s was present prior to pericardiectomy in 86% of the entire group, and in 100% of primary and 75% of secondary CP cases.
Between primary and secondary CP groups, there were significant differences in e‟
velocities except at the tricuspid annulus (Table4). In both primary and secondary CP groups, early annular diastolic velocities decreased significantly after pericardiectomy (Figure 10, Figure 11, Figure 12, Figure 13, Figure 14, Figure 15), whether medial e‟
(p<0.0001 and p=0.0004, respectively), mitral lateral e‟ (p=0.022 and p=0.013, respectively) or tricuspid lateral e‟ (p=0.0005 and p=0.028, respectively, Table 4).
Overall, the reduction in medial e‟ was somewhat more significant than mitral lateral e‟
velocity (p<0.0001 and p=0.0004, respectively, Table 3).
Prepericardiectomy Matched pre- and post- pericardiectomy data
s’ e’ a’ s’ e’ a’
Medial 92 92 77 76 75 59
Mitral lateral 48 49 41 30 31 24
Tricuspid
lateral 39 40 34 18 19 17
Table 2. Frequency of baseline (prepericardiectomy) and matched pre- and post- pericardiectomy tissue velocity data in 99 patients with constrictive pericarditis. The fewer a‟ values reflect the occurrence of atrial fibrillation. s‟: systolic annulus velocity, e‟: early diastolic annulus velocity, a‟: late diastolic annulus velocity.
Before pericardiectomy After pericardiectomy P value*
s’ e’ a’ s’ e’ a’ P s’ P e’ P a’
Medial 7.0
(6.0,9.0) 12.2 8.0 (7.0,11.5)
6.0 (5.0,7.0)
8.0 (6.0,1.0)
7.0
(5.0,8.0) <0.0001 <0.0001 <0.0001 Lateral mitral 8.0
(6.3,9.8) 11.9 10.0 6.9 8.0
(7.0,11.0) 7.4 0.017 0.0004 0.016
Lateral tricuspid 12.1 13.1 13.8 6.9 7.5 7.5
(5.0,9.0) <0.0001 <0.0001 0.0002 Table 3. Overall mean long-axis annular velocities before and after pericardiectomy. All velocity values are in cm/s. *comparing before and after pericardiectomy, s‟: systolic annulus velocity; e‟: early diastolic annulus velocity; a‟: late diastolic annulus velocity. Not normal distribution values shown as: median (25th, 75th percentile).
Before pericardiectomy After pericardiectomy All
patients (cm/s)
Primary CP (cm/s)
Secondary CP (cm/s)
P*
All patients
(cm/s)
Primary CP (cm/s)
Secondary CP (cm/s)
P† P‡
Medial s’ 7.0
(6.0, 9.0)
9.0 (7.0,10.0)
6.0
(5.0,8.0) 0.0002 6.0
(5.0,7.0) 6.4±1.7 6.0
(5.0,7.8) <0.0001 0.038 Mitral lateral s’ 8.0
(6.3,9.8) 9.1±2 7.0
(6.0,9.0) 0.002 7.1±2.2 7.9±1.7 6.5±2.4 0.09 0.11 Tricuspid lateral s’ 11.2±3.8 12.4±3.1 9.7±4.0 0.029 7.2±2.7 6.9±2.9 7.6±2.9 0.0005 0.043 Medial e’ 12.2±4.2 14.6±3.4 10.3±3.5 <0.0001 8.0
(6.0,1.0) 9±2.9 7.0
(6.0,9.0) <0.0001 0.0004 Mitral lateral e’ 11.6±3.5 12.8±3.8 10.3±2.8 0.008 8.0
(7.0,11.0)
10.0
(8.5,13.0) 7.6±2.0 0.022 0.013 Tricuspid lateral e’ 12.2±4.9 13.1±4.8 11.2±4.8 0.20 7.5±2.7 8.4±2.8 6.8±2.4 0.0005 0.028
Medial a’ 8.0
(7.0,11.5)
10.0 (7.0,13.0)
8.0
(7.0,10.0) 0.040 7.0 (5.0,8.0)
6.0
(5.0,8.0) 7.2±2.9 <0.0001 0.06 Mitral lateral a’ 10.3±4.3 10.5±4.9 10.1±3.5 0.79 8.2±3.4 7.8±3 8.5±3.9 0.08 0.12 Tricuspid lateral a’ 11.7±5.4 13.1±5.7 9.6±4.5 0.06 7.5
(5.0,9.0)
8.0 (6.0,9.5)
6.0
(5.0, 9.0) 0.003 0.06 Table 4. Long-axis systolic (s‟), early diastolic (e‟) and late diastolic (a‟) annular velocities before and after pericardiectomy. All velocity values are in cm/s. *comparing primary and secondary constrictive pericarditis (CP), †comparing pre- and post-
pericardiectomy values in primary CP, ‡comparing pre- and post-pericardiectomy values in secondary CP; Not normal
distribution values shown as: median (25th, 75th percentile). s‟: systolic annulus velocity, e‟: early diastolic annulus velocity, a‟:
late diastolic annulus velocity.
Before pericardiectomy After pericardiectomy All
patients
Primary CP
Secondary
CP P* All
patients
Primary CP
Secondary
CP P* P† P‡
E/e’
medial
7.5
(4.8,10) 6.7±4 8.9
(6.4,14.0) 0.0008 11.2
(7.2,18) 11.7±9 11.2
(8.7,18.4) 0.22 <0.0001 0.22 E/e’
lateral mitral
8.3 ±4 7.5±4 9.4±5 0.12 12
(7.3,17) 11±6 13.7
(10,20) 0.022 0.05 0.012 E/e’
lateral tricuspid
8.0 (6.0,10.0)
7.1 (5.0, 9.0)
9.2
(6.9,16.5) 0.048 14.3±8 12.5±6.4 16±10 0.10 0.13 0.05 e’ lateral
mitral /e’medial
0.93
(0.78,1.07) 0.9±0.2 0.94
(0.85,1.2) 0.52 1.1 (0.85,1.5)
1.2 (0.95,1.5)
1.0
(0.8, 1.6) 0.22 0.0006 0.035 Table 5. Early diastolic velocity of mitral inflow (E) to early annular velocity (e‟) ratios and lateral mitral to medial e‟ ratio before and after pericardiectomy. *comparing primary and secondary constrictive pericarditis (CP), †comparing pre- and post- pericardiectomy values in primary CP, ‡comparing pre- and post-pericardiectomy values in secondary CP, not normal
distribution values shown as: median (25th, 75th percentile).