0 20 40 60 80 100
Thousands
1990 1995 2000 2005 2010 2015
Total W/o. public works schemes
0 20 40 60 80 100
2008 2009 2010 2011 2012 2013 2014 2015 2016 Lower secondary Vocational training certificate Upper secondary vocational Upper secondary Tertiary
Percentages
1.3 TRENDS IN BASIC SHORTAGE INDICATORS
János Köllő, Zsanna Nyírő & István János Tóth
There are two main approaches for measuring labour shortage: 1) using in- dicators of labour market imbalance, 2) analysing employers’ perceptions of labour shortage, which is mapped by enterprise surveys (Reymen et al, 2015).
This subchapter first investigates the trends in labour shortage in Hungary (and also abroad) using the first then the second approach. We are revealing up front that all sources reviewed suggest growing recruitment difficulties and increasingly more serious complaints in Hungary after 2013.
The vacancy registry of the National Labour Office
The average monthly number of vacancies reported to local job centres in- creased in 2015–2016 to a level unprecedented since the political changeover of the 90s. However, it is important to note that public works vacancies ac- count for half of the total vacancies and 60 per cent of total vacancies require only a lower secondary qualification at most (Figure 1.3.1), thus the statistics of the National Labour Office cannot be regarded as an overall shortage indicator.
Figure 1.3.1: Number of vacancies reported by the National Labour Office, 1990–2016 (in thousands) a) All vacancies and excluding public works vacancies (after 2012) b) Total, broken down to qualification levels required
Note: Annual average figures.
It should be noted that the average number of annual vacancies reported in the primary labour market in 2016 (47,302 vacancies) was lower than the total number in the period between 1998 and 2004 including public works vacancies. However, the number of public works participants in that period
0.8 0.1 1.2 1.4 1.6 1.8
Vacancies/total jobs (%)
2005 2007 2009 2011 2013 2015 2017
0 1 2 3 4
Percentages
Q1 2006 Q1 2008 Q1 2010 Q1 2012 Q1 2014 Q1 2016
Hungary BG EE FI
LV LT NL PL
RO SK SI SE
Quarterly
did not reach twenty thousand, i.e. one-tenth of the figure in 2016, thus de- mand for labour in that sector cannot have been significant.
Data collected by the Hungarian Central Statistical Office (HCSO) and Eurostat
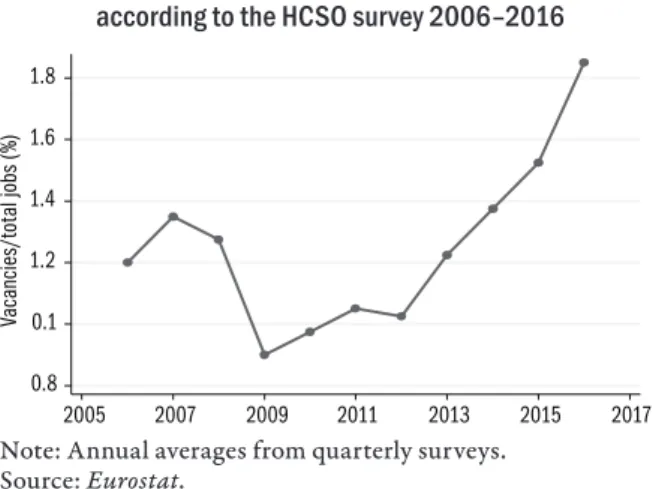
Based on enterprise surveys, there has been a dynamic growth in the propor- tion of vacancies relative to the total (filled and unfilled) jobs in the HCSO survey, which follows the methodology of Eurostat, since 2009 (Figure 1.3.2.).
(The exact definition HCSO data is provided in the note of Figure A1.3 of the Annex.)
Figure 1.3.2: Vacancies as a percentage of total jobs according to the HCSO survey 2006–2016
Note: Annual averages from quarterly surveys.
Source: Eurostat.
Figure 1.3.3: The proportion of vacancies according to Eurostat data in 12 countries, 2006–2016
Country codes are provided below Figure 1.3.4.
Source: Eurostat data, authors’ calculation.
0.0 0.5 1.0 1.5 2.0 Vacancies, percentage
BEAT CHCY DKEL ESFRIEIT MTPLPT BGSKLTLUFI ROHRLV EENOSI HUSENL
Entire economy
0 1 2 3 4
Vacancies, percentage
FRIT MTES ELBG CYPL SKIE PTRO CHHRLT LUFI LVNO DKEE HUATNLSEBESI
Business sector
0 1 2 3
Vacancies, percentage
FRIT MTEL ESCY LUPT BGIE PLFI NOHRSKLT ROATCHDKEESELVNLSI HUBE
Industry
0 1 2 3
Vacancies, percentage
FRIT MTEL ESCYLUPT BGPLIEFI NOHR SKLT ROAT CHDK EESI SELVNL HUBE
Construction industry
0 1 2 3
Vacancies, percentage
FRIT MTEL ESCY LUPT BGIEPLFI NOHR SKLT ROAT CHDK EESI SELV HUNLBE
ICT
0 1 2 3
Vacancies, percentage
FRIT MTBG ESPL SKCY ELIE ROHRFI LTPT CHLU HULVNODKEESEATNLBESI
Trade
0 1 2 3
Vacancies, percentage
DKEL FRIT MTPT PLCY ESSK CHLTATSIIE BGLV RONLEEFI HUNOHRLUSEBE
Education
0 1 2 3 4
Vacancies, percentage
DKEL FRIT MTPT CYPL SKESSI CHFI LULT ATEEIE BESE HRNL LVNO BGRO HU
Healthcare and welfare services
Eurostat surveys enable international comparison. As seen in Figure 1.3.3, Hungary was in the mid-range in terms of vacancies in 2006 but as a result of the dynamic increase, which started three or four years ago, an extremely high level has emerged: at the end of 2016, Hungary had the third highest number of vacancies following Sweden and Holland. The figure includes coun- tries that publish time series about the entire economy since 2008 or earlier.
The Hungarian surveys started in 2006.
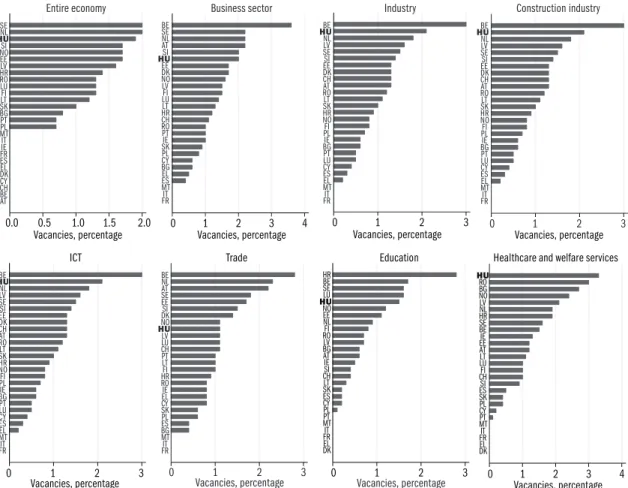
Figure 1.3.4: The proportion of vacancies in the fourth quarter of 2016 according to Eurostat
Country codes: AT: Austria, BE: Belgium, BG: Bulgaria, CY: Cyprus, CZ: Czech Re- public, DE: Germany, DK: Denmark, EE: Estonia, EL: Greece, ES: Spain, FI: Fin- land, FR: France, HR: Croatia, HU: Hungary, IE: Ireland, IT: Italy, LT: Lithuania, LU: Luxemburg, LV: Latvia, MT: Malta, NL: Holland, PL: Poland, PT: Portugal, RO: Romania, SE: Sweden, SI: Slovenia, SK: Slovakia.
Figure 1.3.4. shows that at the end of last year Hungary ranked second in the proportion of vacancies in industry, the construction industry and the IT sec- tor. However, concerning the whole business sector, and among a wider range
0123401234
20 30 40 50 60 20 30 40 50 60 20 30 40 50 60
Construction industry Education Healthcare
Industry ICT Science and technology services
Proportion of vacancies
Quarterly until 2016
of countries, it only ranks sixth. The high level in education and especially in healthcare and social welfare plays a key role in ranking third in terms of the entire economy, as seen in Figure 1.3.3. Healthcare is the only sector that Hungary ranks first in. The number of vacancies broken down to sectors is provided in Figure 1.3.5.
Figure 1.3.5: The proportion of vacancies in some sectors
Source: Eurostat.
The graphs of the Figure reveal how different the reasons leading to complaints of shortages are. The highest final levels are seen in the IT sector as well as healthcare and social welfare. The former shows a continuous increase also taking place during the global crisis, which is probably due to the rapid in- crease in global demand resulting from digitalization and the (partly inevi- table) slow adaptation of the education system. The latter is primarily due to regulatory restrictions on headcount, low wages and the resulting continuous outmigration of doctors and nurses. By contrast, the time series of industry, construction industry and science-engineering services were heavily affected by the crisis and the following recovery.1
The questionnaires of several international (e.g. the Business and Consumer Survey coordinated by the European Commission)2 and Hungarian (e.g. GKI Economic Research. Institute for Economic and Enterprise Research [IEER], Kopint–Tárki Institute for Economic research) business surveys contain ques- tions on the most important factors hindering firms’ business activities. They also include labour shortage (and sometimes also skilled worker shortage) among the possible answers. The question has been included in business sur- veys covering EU member states and accession states since the 1980s. The main findings of surveys on Hungarian labour shortage are presented below.
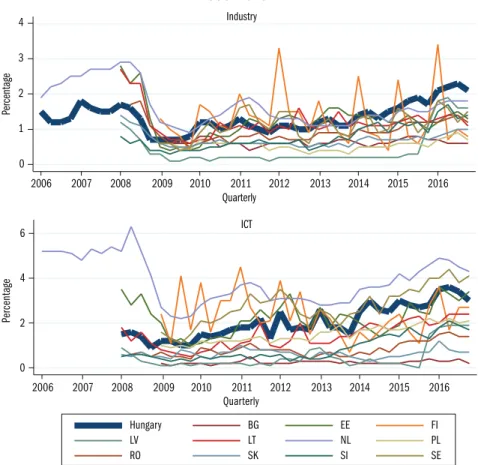
1 Time series about industry and the IT sector are provided in Figure A1.3 of the Annex.
2 The Business and Consumer Survey of the European Com- mission.
Labour shortage Skilled worker shortage
0 10 20 30 40 50 60 70
1999 2001 2003 2005 2007 2009 2011 2013 2015 2017 Quarterly
Percentage
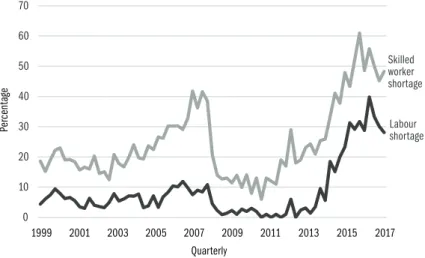
Labour shortage as barrier – Surveys conducted by Kopint–Tárki The proportion of those regarding labour shortage or the shortage of skilled
workers as an obstacle is first presented relying on data from Kopint–Tárki (Figure 1.3.6). According to these, the proportion of businesses mentioning labour shortage was about 10 per cent and those mentioning skilled worker shortage was 30–40 per cent before the economic crisis, then the figures for both indicators decreased as a result of the crisis: between the end of 2008 and the beginning of 2014, the proportion of businesses mentioning labour shortage was only between 0 and 6 per cent, while the proportion of those referring to skilled worker shortage was low between 2009 and the begin- ning of 2012: 6–14 per cent. The proportion of those reporting labour short- age started to grow at the end of 2014 and reached a peak at the end of 2016, when 40 per cent of respondents mentioned this problem. Since that time their proportion has been around 30 per cent. The proportion of those men- tioning skilled worker shortage started to increase in the spring of 2012 and culminated in the spring of 2016 when 61 per cent of respondents reported this as a problem. Since then the proportion has been around 50 per cent in each data collection period.
Figure 1.3.6: The proportion of businesses reporting labour and skilled worker shortage as an obstacle to business activity, April 2000 – July 2017 (percentage)
Source: Kopint–Tárki.
Surveys conducted by the Institute for Economic and Enterprise Research (IEER)
The business surveys of IEER indicate that about one in ten firms faced labour or skilled worker shortages between 2011 and 2013 (Figure 1.3.7).
At the end of 2014, one in five (21 per cent) firms were facing the problem, then (apart from a short slowdown) the proportion of those complaining
10 10 9 8 7 10 13
21 20
27 29
36 38
0 5 10 15 20 25 30 35 40 45
Percentage
04.2011 10.2011 04.2012 10.2012 04.2013 10.2013 04.2014 10.2014 04.2015 10.2015 04.2016 10.2016 04.2017
started to grow continuously. In April 2017, 38% of respondents reported that labour and skilled worker shortage is a key obstacle to business (Ná- belek et al, 2017).
Figure 1.3.7: The proportion of businesses reporting both labour and skilled worker shortage as an obstacle to business activity, April 2011 – April 2017 (percentage)
Note: N = 1,823–3,614.
Source: IEER business surveys.
Surveys conducted by GKI Economic Research (GKI) and the European Commission.
Figure 1.3.8 indicates the proportion of businesses mentioning labour short- age as an obstacle, broken down to sectors, in comparison with the EU av- erage. The most recent data from 2017 suggest that the labour shortage per- ceived by Hungarian firms considerably exceeds the EU average in all three sectors. The proportion of firms complaining in the industry sector started to grow sharply in the second quarter of 2014, while the EU average only in- creased slightly. The difference was the most conspicuous in the third quar- ter of 2017, when 83 per cent of Hungarian businesses as opposed to 16 per cent of EU firms believed labour shortage is a major barrier to business. The construction industry and services experienced similar tendencies: while the proportion of those complaining showed a steep increase in Hungary (from 2014 in the service sector and from 2015 in the construction industry), the EU average grew modestly.
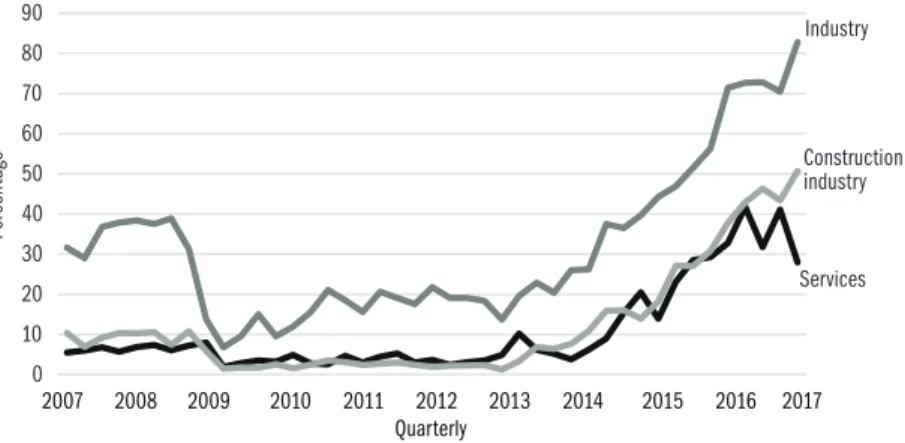
Figure 1.3.9 shows sectoral labour shortage in Hungary between 2007 and 2017. Industry was excessively affected by labour shortage, while the services sector and the construction industry experienced a much smaller and similar labour shortage in this period.
In 2007 and 2008, only manufacturing industry was characterised by high (29–39 per cent) labour shortage, which then diminished as a result of the economic crisis and thus in 2009 was nearly as low as the level in the con- struction industry and services. However, it started to increase again: between 2010 and 2014 it exceeded the figures of the other two sectors by 10–20 per-
0 20 40 60 80 100
2017 2016 2015 2014 2013 2012 2011 2010 2009 2008
2007 Quarterly
Percentage
Industry
0 10 20 30 40 50 60
2017 2016 2015 2014 2013 2012 2011 2010 2009 2008
2007 Monthly
Construction industry
0 10 20 30 40 50
Magyarország EU-28
2017 2016 2015 2014 2013 2012 2011 2010 2009 2008
2007 Quarterly
Percentage
Services
Industry
Services Construction industry
0 10 20 30 40 50 60 70 80 90
Percentage
2007 2008 2009 2010 2011 2012 2013 2014 2015 2016 2017 Quarterly
centage points. Then the difference was even larger at the end of 2014 and has been about 20–30 percentage points (sometimes reaching 40 percentage points) since that time.
Figure 1.3.8: The proportion of businesses reporting labour shortage as an obstacle to business activity broken down to economic sectors, in the EU and Hungary, 2007–2017 (percentage)
Source: European Commission, Hungarian data: GKI.
Figure 1.3.9: The proportion of businesses reporting labour shortage as an obstacle to business activity broken down to economic sectors in Hungary,
2007–2017 (percentage)
Note: Monthly data on the construction industry are provided as quarterly averages.
Source: European Commission, Hungarian data: GKI.
0 10 20 30 40 50 60 70
EE LV LT BE AT HU MT BG DE FR CZ SE LU EU-28 SK RO FI PT PL IE NL DK SI UK IT HR ES CY EL
Percentage
Data from the Eurofond European Company Survey
The Eurofond data draw attention to skills mismatch as a source of complaints.
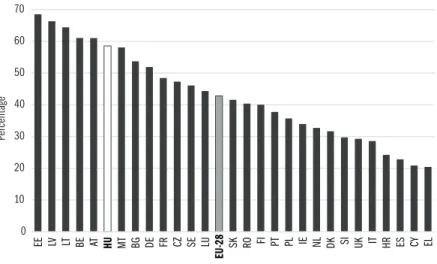
The most recent (2013) European Company Survey3 indicate that four out of ten (42.8 per cent) European firms find it difficult to hire appropriately skilled employees – this is shown in Figure 1.3.10 59 per cent of Hungarian firms agree with it; only five member states (Estonia: 69, Latvia: 66, Lithu- ania: 64, Belgium: 61 and Austria: 61 per cent) reported more serious diffi- culties than Hungary.
Figure 1.3.10: The proportion of businesses in the EU member states finding it difficult to hire appropriately skilled employees, 2013 (percentage)
Note: N = 26,803.
Country codes are provided at Figure 1.3.4.
Source: Authors’ calculations based on the 2013 database of the European Company Survey.
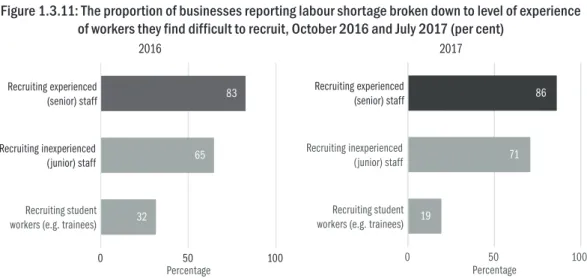
Hiring school leavers and experienced workers – Surveys by IEER The findings of the mid-year business survey of IEER in 2016 (Figures 1.3.11
and 1.3.12) showed that, the majority (83 per cent) of firms facing labour shortage find it difficult to recruit experienced workers, nearly two-thirds (65 per cent) also find it difficult to hire freshers and about one-third (32 per cent) even find it difficult to recruit student workers. The quarterly figures of IEER were similar in 2017: most firms (86 per cent) found it difficult to hire experienced employees, followed by freshers (71 per cent) and student workers (19 per cent).4
In conclusion, the above surveys unanimously suggest that complaints of labour shortage, the number of vacancies reported to job centres and the shortage assessed in business surveys have been increasing in Hungary since 2013. At present Hungary is in the “top league” in Europe in terms of com- plaints of labour shortage.
3 European Company Survey.
4 The two data collections (the quarterly and biannual) are not comparable because they rely on different samples and adopt dif- ferent data collection methodol- ogy. In addition, one of them is conducted in October, the other in July and therefore there may also be seasonal effects.
32
65 83
0 50 100
Recruiting student workers (e.g. trainees) Recruiting inexperienced (junior) staff Recruiting experienced (senior) staff
Percentage
19
71 86
0 50 100
Recruiting student workers (e.g. trainees) Recruiting inexperienced (junior) staff Recruiting experienced (senior) staff
Percentage
Figure 1.3.11: The proportion of businesses reporting labour shortage broken down to level of experience of workers they find difficult to recruit, October 2016 and July 2017 (per cent)
2016 2017
Note: 2016: N = 853–1,092, 2017: N = 144.
Source: IEER.
References
Reymen, D.–Gerard, M.–De Beer, P.–Meierkord, A.–Paskov,M.–Di Stasio, V.–
Donlevy, V.–Atkinson, I.–Makulec, A.–Famira-Mühlberger, U.–Lutz, H.
(2015): Labour Market Shortages in the European Union. European Parliament, Policy Department A: Economic and Scientific Policy.
Nábelek Fruzsina–Hajdú Miklós–Nyírő Zsanna–Tóth István János (2017): A munkaerőhiány vállalati percepciója. Egy empirikus vizsgálat tapaszta- lata. (The perception of labour shortage by businesses. An empirical survey.) MKIK GVI, Budapest.
0 1 2 3 4
Percentage
2006 2007 2008 2009 2010 2011 2012 2013 2014 2015 2016
Quarterly Industry
0 2 4 6
Percentage
Quarterly
Hungary BG EE FI
LV LT NL PL
RO SK SI SE
2006 2007 2008 2009 2010 2011 2012 2013 2014 2015 2016
ICT
Annex 1.3
Figure A1.3: Vacancies in two sectors as a percentage of the total number of jobs, 2006–2016
Note: according to the Eurostat and HCSO methodology, the definition for job va- cancy is “a post that is newly created, unoccupied or about to become vacant in the near the future (within 3 months), for which the employer is taking active steps (e.g.
through advertisements, tendering, contacting the National Labour Office, private recruitment agencies, colleagues, friends or acquaintances etc.) to fill with an em- ployee with an employment contract. A post cannot be regarded as a vacancy if it is to be filled with temporary workers, independent contractors, service contracts, by transferring their own employee from another job or with a pupil or student on unpaid, compulsory traineeship. Also posts reserved for those with an employment contract but not obliged to work due to permanent absence (parental leave, military service or sickness leave or unpaid leave exceeding 1 month) cannot be regarded as vacancies either. The rate of vacancies: the number of vacancies expressed as a percentage of total posts (headcount of those participating in the activity of the organisation + number of vacancies).” http://www.ksh.hu/docs/hun/modsz/
modsz21.html.