ENHANCEMENT OF CHICKEN PRIMORDIAL GERM CELL IN VITRO MAINTENANCE USING
AN AUTOMATED CELL IMAGE ANALYSER
Mahek ANAND1,2#, Bence LÁZÁR2,3#, Roland TÓTH1,2, Emőke PÁLL5, Eszter PATAKINÉ VÁRKONYI3, Krisztina LIPTÓI3, László HOMOLYA4, Zoltán HEGYI4,
András HIDAS3 and Elen GÓCZA2*
1Doctoral School of Animal Husbandry Science, Szent István University, Gödöllő, Hungary; 2National Agricultural Research and Innovation Center, Agricultural Biotechnology Institute, Animal Biotechnology Department, Szent-Györgyi Albert u. 4,
H-2100 Gödöllő, Hungary; 3Research Centre for Farm Animal Gene Conservation, Gödöllő, Hungary; 4Molecular Cell Biology Research Group, Institute of Enzymology,
Research Centre for Natural Sciences, Hungarian Academy of Sciences, Budapest, Hungary; 5Department of Reproduction, Obstetrics and Veterinary Gynaecology, University of Agricultural Sciences and Veterinary Medicine, Cluj-Napoca, Romania
(Received 6 June 2018; accepted 25 July 2018)
Primordial germ cells (PGCs) were isolated from blood samples of chicken embryos. We established four PGC lines: two males (FS-ZZ-101, GFP-ZZ-4ZP) and two females (FS-ZW-111, GFP-ZW-5ZP). We could not detect a significant difference in the marker expression profile, but there was a remarkable difference between the proliferation rates of these PGC lines. We monitored the number of PGCs throughout a three-day period using a high-content screening cell imaging and analysing system (HCS). We compared three different initial cell concentra- tions in the wells: ~1000 cells (1×), ~4000 (4×) and ~8000 (8×). For the GFP- ZW-5ZP, FS-ZZ-101 and FS-ZW-111 PGC lines the lowest doubling time was observed at 4× concentration, while for GFP-ZZ-4ZP we found the lowest dou- bling time at 1× concentration. At 8× initial concentration, the growth rate was high during the first two days for all cell lines, but this was followed by the ap- pearance of cell aggregates decreasing the cell growth rate. We could conclude that the difference in proliferation rate could mainly be attributed to genotypic variation in the established PGC lines, but external factors such as cell concentra- tion and quality of the culture medium also affect the growth rate of PGCs.
Key words: Chicken, primordial germ cells, cell culture, proliferation rate, doubling time, high-content screening
#Shared first authors
*Corresponding author; E-mail: gocza.elen@abc.naik.hu, Phone: 0036 (28) 526-162;
Fax: 0036 (28) 526-151
Open Access. This is an open-access article distributed under the terms of the Creative Commons Attribution- NonCommercial 4.0 International License (https://creativecommons.org/licenses/by-nc/4.0/), which permits un- restricted use, distribution, and reproduction in any medium for non-commercial purposes, provided the origi- nal author and source are credited, a link to the CC License is provided, and changes – if any – are indicated.
Avian primordial germ cells (PGCs) are upcoming pioneers in the field of stem cell and developmental biology. The chicken, due to its relatively short re- productive cycle and easy access of embryos, is an important animal model among vertebrates for in vitro studies (Nakamura et al., 2013). PGCs are the pre- cursors of functional gametes and they tend to migrate from the hypoblast via the circulatory system to the genital ridge – the place of the final development, where based on the sex of the embryo they will develop into male or female gametes (Kagami, 2016). It is possible to collect avian blastodermal cells from the blastodisc at stage X (Sztán et al., 2017) or PGCs from the blood between stages 13–17 (Raucci et al., 2015) and culture the isolated cells in vitro. In order to fully reserve the developmental potential of PGCs, an optimal cell culture medium should be developed. A well-defined culture medium plays an important role in expanding the population of PGCs (Van Der Sanden et al., 2010) and promotes healthy cell proliferation (Kagami, 2016; Nakamura, 2016). Using the culture protocol developed by McGrew et al. (2004), it became possible to culture both female and male chicken PGCs in vitro for a long time (Whyte et al., 2015).
The components of the culture medium, cell concentration in the culture plate along with physical factors like pH, oxygen, and the level of carbon dioxide play a major role in regulating the proliferation, growth and quality of PGCs (Whyte et al., 2015). The culture medium can effectively mimic the in vivo mi- croenvironment during in vitro expansion; also, the components tend to interact with each other and with the metabolites or factors secreted by the cells.
Cell competition is present under both in vitro and in vivo conditions. This system acts as a filtering method of removing stem cells having acquired delete- rious mutations following the onset of proliferation. Under in vitro conditions, a similar mechanism has been observed. When male and female PGCs were co- cultured, it was observed that male PGCs grow faster and female PGCs tend to disappear from the culture after an extended period of culturing (Whyte et al., 2015; Nakamura, 2016). This observation was consistent with the findings of Sancho et al. (2013) who observed competition between the different genotypes when cells were cultured in a heterogeneous population.
Bertocchini and Chuva de Sousa Lopes (2016) reported that PGCs tend to acquire mutations via migration. This may turn them ectopic or tumorigenic in nature (De Melo Bernardo et al., 2012; Bertocchini and Chuva de Sousa Lopes, 2016), which affects the proliferation rate.
The main aim of our investigation was to explore the optimal culture con- ditions along with environmental and physical factors that promote the growth of PGCs maintained in vitro, facilitating the future of PGC-based bio-banking.
Materials and methods Experimental animals and animal welfare
The animals were maintained according to the rules set up by the Hungarian Animal Protection Law (Act No. XXVII of 1998). The permission to perform ex- periments on animals at the Research Centre for Farm Animal Gene Conservation (Gödöllő, Hungary) was granted by the National Food Chain Safety Office, Animal Health and Animal Welfare Directorate, Budapest (no.: 1/1512/49/15/
2/2012). The Partridge Colour Chicken breed used in our study is being kept at the Research Centre for Farm Animal Gene Conservation (Gödöllő, Hungary) in vivo.
The White Leghorn chicken breed expressing the GFP gene was identical to the one established by McGrew and colleagues as described before (McGrew et al., 2004).
Establishment of the PGC lines
The eggs were collected and then incubated for the establishment of the Partridge Colour PGC lines (PGC lines FS-ZZ-101 and FS-ZW-111) and the GFP-expressing White Leghorn lines (GFP lines GFP-ZZ-4ZP and GFP-ZW- 5ZP). The blood was isolated (approx. 1 μl) from the HH stage 14–17 embryos and added to the selective PGC culture medium developed by McGrew and col- leagues (Whyte et al., 2015), to remove the blood cells completely and to support the growth and division of PGCs. A one-third proportion of the medium was changed every day. A PGC line was considered successfully established if the cell number has reached 1 × 10⁵ by the end of the third week (Whyte et al., 2015).
During our study, two male PGC lines (FS-ZZ-101, GFP-ZZ-4ZP) and two female PGC lines (FS-ZW-111, GFP-ZW-5ZP) were compared (Fig. 1).
Detailed analysis of the established FS-ZZ-101 and FS-ZW-111 was de- scribed by Lázár et al. (2017) and that of the GFP-ZZ-4ZP and GFP-ZW-5ZP lines by Tóth et al. (2017). The stem cell and germ cell specific marker and miRNA expression profiles of the PGC lines used have been described recently by our group (Lázár et al., 2018).
Culture medium for primordial germ cells
The PGC culture medium was prepared according to the medium protocol formulated by McGrew and his colleagues (Whyte et al., 2015). The basis of the PGC culture medium is a special AVIAN DMEM containing B27, ovalbumin and heparin. The medium contains the growth factors h-Activin A (25 ng/μl) and h-FGF2 (10 ng/μl). The stock medium was filtered using a 0.22-μl syringe filter.
The filtered medium was kept at 4 °C.
DNA isolation and sex determination
The DNA extraction procedure was performed using the High Pure PCR Template Preparation Kit (Roche, Cat. No. 11796828001), according to the manu-
facturer’s instructions. The samples were stored at –20 °C. The sex of the donor embryos and the established PGC lines were determined using the CHD1 primer set (FW: 5’-TATCGTCAGTTTCCTTTTCAGGT-3’; RV: 5’-CCTTTTATTGAT CCATCAAGCCT-3’) as described previously by Lee et al. (2010). The extract- ed DNA was diluted to 25 ng/µl concentration for PCR reaction and gel electro- phoresis. MyTaq Red Mix was used for the reaction (Bioline, Cat. No. BIO- 25043). The PCR products were then separated by electrophoresis, using 1%
agarose gel stained with ethidium bromide, at 100 V for 1.5–2.0 h. The DNA bands were then visualised and photographed under UV illumination.
Chromosome analysis
The metaphase chromosomes were prepared by methanol-acetic acid fixa- tion and air-drying technique (Alfi et al., 1973). To the intensively proliferating PGC culture one drop of vinblastine solution (10 µg/ml, Sigma) was added. After 2 h, the medium containing the PG cells was harvested from the plate, collected in an Eppendorf tube, and then the cell suspension was centrifuged. The superna- tant was removed, and the cells were suspended in ice-cold 0.56% KCl solution.
Hypotonic treatment took 10 min at room temperature and was followed by 3 changes of methanol/acetic acid (3:1) fixative. The cell suspension was spread on slides, dried at room temperature, and stained with 5% fresh Giemsa (in phos- phate buffer, pH 7.0) for 7–8 min. Five slides of each cell line were prepared and at least 50 metaphase spreads per line were examined.
Cell counting
The cell counting of the PGCs before preparing the examined 96-well plates was performed using the Arthur Novel Fluorescence Cell Counter (NanoEnTek, Pleasanton, USA). This cell counter is a 3-channel desktop image analyser which allows users to perform assays for cells in suspension, including GFP and RFP ex- pression, apoptosis, cell viability, cell cycle, and cell counting.
Doubling time measurement and time lapse video analysis
High-content screening and analysis were performed by a Molecular De- vices ImageXpress Micro XLS Imaging System with a built-in incubator, which equipment also allows acquisition of time lapse videos (Kecse-Nagy et al., 2016;
Hegedüs et al., 2017). Twelve fields of view were monitored of each well of a 96-well culturing plate for 64 h. The cell number was determined every 4 h.
Doubling times were calculated from 12 repeats, two biological parallels of the four PGC lines (FS-ZZ-101, FS-ZW-111, GFP-ZZ-4ZP, GFP-ZW-5ZP) at 1×, 4× and 8× concentration.
Doubling time calculation
The doubling time is the time required for a culture to double in number.
We calculated the doubling time using the following formula. Gr (growth rate) = ln[N(t)/N(0)]/t, where N(t) is the number of cells at time t, N(0) is the number of cells at time t = 0 (t expressed in days). Therefore, Doubling Time = ln(2)/growth rate (Gr). The doubling time is inversely proportional to the proliferation rate.
Statistical analysis
All data were analysed by R Studio (version 1.0.136), R (version R-3.2.2.) and GenEx (version 6.0). R software was used to build a multiple linear regres- sion model in which ‘doubling time’ was the response variable, while ‘concen- tration’ and ‘cell line’ were predictor variables. Both predictor variables showed a significant effect on doubling time; therefore, multiple comparisons of means (Tukey contrasts) were performed to further analyse the differences between groups. P < 0.05 was considered significant (*P < 0.05, **P < 0.01, ***P < 0.001).
Results
Characterisation and sex determination of PGC lines
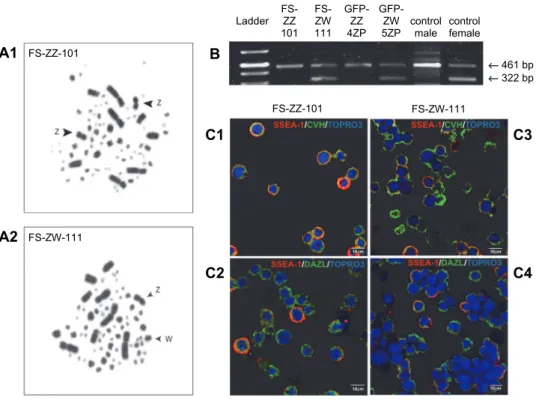
As a first step, we characterised the established PGC lines. We performed chromosome analysis (Fig. 1A1, A2) and sex PCR (Fig. 1B) to detect the sex of the PGC lines. According to our results, two male PGC lines (FS-ZZ-101, GFP- ZZ-4ZP) and two female PGC lines (FS-ZW-111, GFP-ZW-5ZP) were identi- fied. There was no difference in the marker expression profile between the stem cell-specific (SSEA-1) and germ cell-specific (CVH, DAZL) markers in the PGC lines examined. Figure 1C shows the results of the SSEA-1, CVH and DAZL immunostaining of FS-ZZ-101 and FS-ZW-111 PGC lines (SSEA-1: Fig. 1/C1, C2, C3, C4; CVH: Fig. 1/C1, C3; DAZL: Fig. 1/C2, C4).
Tracking the cell number growth using time lapse video image analyser in chick- en PGCs cultured in vitro
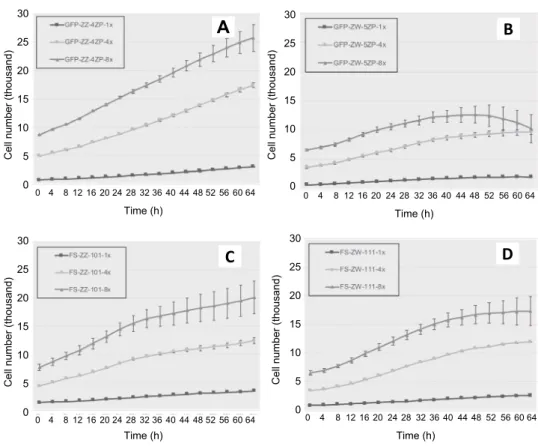
The total number of PGCs was calculated by measuring the cell number in 12 small squares in each well. Two biological parallels and three different initial concentrations [~1000 cells (1×), ~4000 (4×) and ~8000 (8×)] were examined and compared in all four cell lines (GFP-ZZ-4ZP, GFP-ZW-5ZP, FS-ZZ-101, FS-ZW-111; Fig. 2/A, B, C, D).
The cell number increased to ~3000 cells (1×), ~17,000 (4×) and ~26,000 (8×) in the case of the GFP-ZZ-4ZP (Fig. 2A); ~2000 cells (1×), ~10,000 (4×) and
~10,000 (8×) for the GFP-ZW-5ZP (Fig. 2B); ~3000 cells (1×), ~12,000 (4×) and
~20,000 (8×) in the case of the FS-ZZ-101 (Fig. 2C), and ~3000 cells (1×),
~12,000 (4×) and ~17,000 (8×) for the FS-ZW-111 (Fig. 2D). We observed the highest growth rate at a high (8×) initial cell concentration; however, despite the increased cell number, we detected high standard deviation (SD) between the two parallel samples after 32 h. The high value of SD corresponds to the random pro- cesses going on under in vitro cell culture conditions. The cell number of the GFP- ZW-5ZP PGC line increased from 0 to 32 h, but subsequently there was a regres- sion in the cell numbers from 32 to 64 h [32 h: ~11,000 (8×); 64 h: ~10,000 (8×);
Fig. 2B]. After 64 h of cultivation, we obtained the highest cell number of ~26,000 (8×) in GFP-ZZ-4ZP line (Fig. 2A). The lowest cell number after 64 h of cultiva- tion at 8× initial cell concentration was observed for the GFP-ZW-5ZP PGC cell line [64 h: ~10,000 (8×); Fig. 2B]. The decrease in cell number can be caused by the formation of clumps in the in vitro culture but other on-going cellular processes such as apoptosis or cellular toxicity could also be involved.
Fig. 1. SSEA-1, CVH and DAZL expression in FS-ZZ-101 and FS-ZW-111 PGC lines was performed (SSEA-1: Fig. 1/C1, C2, C3, C4; CVH: Fig. 1/C1, C3; DAZL: Fig. 1/C2, C4). We performed chromosome analysis (A) and sex PCR to detect the sex (B) of PGC lines. A: Metaphase
spread of FS-ZZ-101 (A1) and FS-ZW-111 cell lines (A2). B: Sex determination of PGC lines using CHD1 primers. Sex determination was performed by using the CHD1 FW and RV primer sets. The size of the PCR products was 322 bp and 461 bp, respectively. In case of the female cell
lines, two bands were detected. C: SSEA-1 (red), CVH (green) and nuclear staining (blue) of FS-ZZ-101 (C1) and FS-ZW-111 cell lines (C3). SSEA-1 (red), DAZL (green), nuclear staining
(blue) in FS-ZZ-101 (C2) and FS-ZW-111 cell lines (C4). Scale bars: 10 µm
FS- FS- GFP- GFP- Ladder ZZ ZW ZZ ZW control control 101 111 4ZP 5ZP male female
A1
A2
B
C1
C2 C4
C3
← 461 bp
← 322 bp FS-ZZ-101
FS-ZW-111
FS-ZZ-101 FS-ZW-111
Fig. 2. High-content screening using Molecular Devices ImageXpress Micro XLS Imaging System with a built-in incubator was performed at the Molecular Cell Biology
Research Group. The cell number was measured at 4-h intervals, at 17 different measurement points, for 64 h. For the calculation of doubling time, we used data collected from 12 repeats, two biological parallels of the four PGC lines (FS-ZZ-101, FS-ZW-111, GFP-ZZ-4ZP, GFP-ZW-5ZP). The four cell lines (GFP-ZZ-4ZP, GFP-ZW-
5ZP, FS-ZZ-101, FS-ZW-111) were compared by examining three different initial concentrations [~1000 cells (1×), ~4000 (4×) and ~8000 (8×)] (Fig. 2/A, B, C, D)
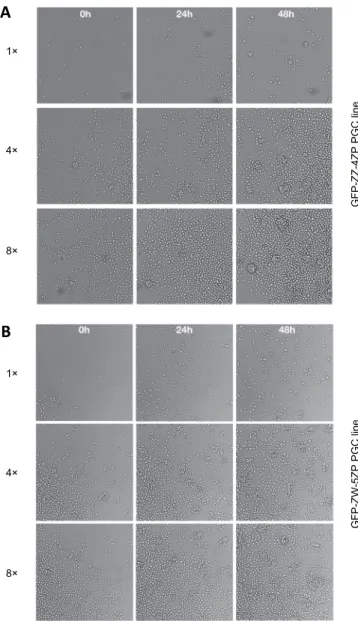
We followed the cell proliferation by capturing time lapse pictures. The initial concentration was 4×, and the image analyser took pictures at 4-h inter- vals. In the case of GFP-ZZ-4ZP PGC line the formation of small aggregates was observed after 48 h (Fig. 3A). In the case of the GFP-ZW-5ZP PGC line, we rec- ognised small aggregates from the beginning of culture. After 48 h of culture, these small aggregates formed big clumps (Fig. 3B).
Determination of the doubling time in chicken PGC lines cultured in vitro
The doubling time (the time required for a culture to double in number) of PGCs was calculated by measuring the cell numbers in 12 small squares in each
0 4 8 12 16 20 24 28 32 36 40 44 48 52 56 60 64
Cell number (thousand)
A
Time (h)
0 4 8 12 16 20 24 28 32 36 40 44 48 52 56 60 64 30
25 20 15 10 5 0
Cell number (thousand)
C
Time (h)
0 4 8 12 16 20 24 28 32 36 40 44 48 52 56 60 64 30
25 20 15 10 5 0
Cell number (thousand)
B
Time (h)
0 4 8 12 16 20 24 28 32 36 40 44 48 52 56 60 64 30
25 20 15 10 5 0
D
Time (h) 30
25 20 15 10 5 0
Cell number (thousand)
well. Four cell lines (GFP-ZZ-4ZP, GFP-ZW-5ZP, FS-ZZ-101, FS-ZW-111) were compared using two biological parallels and three different initial concen- trations [~1000 cells (1×), ~4000 (4×) and ~8000 (8×); Fig. 4/A, B, C, D].
Fig. 3. A: Time lapse captures of the GFP-ZZ-4ZP PGC line. The initial concentration was 4×, the image analyser took pictures at 4-h intervals. After 48 h of culture it was possible to observe the formation of small aggregates. B: Time lapse captures of the GFP-ZW-5ZP PGC line. The initial concentration was 4×, and the image analyser took pictures at 4-h intervals. At the beginning of the
culture it was possible to recognise small aggregates. After 48 h of culture, these small aggregates formed big clumps
A
B
GFP-ZW-5ZP PGC lineGFP-ZZ-4ZP PGC line
1×
4×
8×
1×
4×
8×
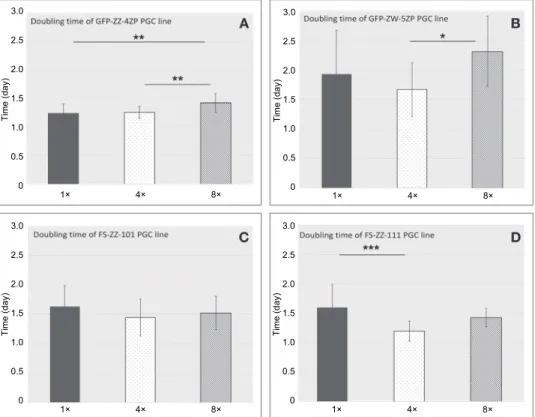
Fig. 4. Summary of the doubling times of PGC lines at different concentrations. The FS-ZW-111 PGC line showed the lowest doubling time at 4× concentration (Fig. 4D). The highest doubling times were calculated in the case of the GFP-ZW-5ZP PGC line (Fig. 4B). The doubling times of the GFP-ZW-5ZP, FS-ZZ-101 and FS-ZW-111 lines were the lowest at the 4× initial concentration (Fig. 4B, C and D), while the GFP-ZZ-4ZP line showed the highest proliferation rate at 1× concen-
tration. P < 0.05 was considered significant (*P < 0.05, **P < 0.01 and ***P < 0.001)
According to the multiple linear regression model, in which ‘doubling time’ was the response variable while ‘concentration’ and ‘cell line’ were predic- tor variables, we found a significant difference between the PGC lines except the FS-ZW-111–GFP-ZZ-4ZP and the FS-ZW-111–FS-ZZ-101 pairs. In cell concen- tration, a significant difference was found between 4×–8× and 4×–1× but not be- tween 1×–8×. Comparing the doubling times of cell lines at different concentra- tions, the FS-ZW-111 PGC line showed the lowest doubling time (the maximum proliferation rate) with a value of 1.19 (4×) (Fig. 4D). The highest doubling time was calculated for the GFP-ZW-5ZP PGC line [with 2.31 (8×), 1.94 (1×) and 1.67 (4×); Fig. 4B]. It was followed by the FS-ZZ-101 PGC line with a value of 1.63 (1×) (Fig. 4C) and the FS-ZW-111 PGC line with a value of 1.59 (1×) (Fig.
4D). Interestingly, the doubling time of the GFP-ZW-5ZP, FS-ZZ-101 and FS-
1× 4× 8×
3.0 2.5 2.0 1.5 1.0 0.5 0
Time (day)
1× 4× 8×
3.0 2.5 2.0 1.5 1.0 0.5 0
Time (day)
1× 4× 8×
3.0 2.5 2.0 1.5 1.0 0.5 0
Time (day)
1× 4× 8×
3.0 2.5 2.0 1.5 1.0 0.5 0
Time (day)
ZW-111 lines was the lowest at 4× initial concentration [GFP-ZW-5ZP: 1.67 (4×); FS-ZZ-101: 1.45 (4×); FS-ZW-111: 1.19 (4×); Fig. 4B, C, D].
From the above results, it can be concluded that the doubling time is geno- type dependent, but it is also affected by the initial cell concentration because the cell metabolism modifies the in vitro culture conditions.
Discussion
In our laboratory, male and female PGCs were cultured in a defined medi- um (Whyte et al., 2015).
As in chickens the females are heterogametic and the males are homoga- metic, some of the genes show sex-dependent expression and, hence, it is specu- lated that this phenomenon affects the proliferation rate differently in male and female PGCs (Ronen and Benvenisty, 2014). According to a study (Van Der Sanden et al., 2010), many intrinsic and extrinsic factors affect cell proliferation.
Cell concentration is an important extrinsic factor. It was observed that at an op- timal cell number the cells tend to show higher proliferation rate. In our study, the optimal concentration was cell line dependent. The best initial concentration for the cell lines GFP-ZW-5ZP, FS-ZZ-101 and FS-ZW-111 was ~4000 cells/
well (in a 96-well plate), while in the case of the GFP-ZZ-4ZP it was ~1000 cells/
well. The GFP-ZZ-4ZP cell line showed the lowest doubling rate at an initial concentration of ~1000 cells/well.
Cells are in a state of dynamic interaction with one another while growing.
Also, there may be some competition between the cells. In a few cells, new mu- tations could arise which may cause a higher proliferation rate (Bertocchini and Chuva de Sousa Lopes, 2016), or cell may acquire a mutation that decreases the proliferation rate. There is interaction between cells via cell to cell adhesion or chemical attraction (Renner et al., 1993; Agnew et al., 2014). PGCs secrete chemical molecules (glycoproteins, cell surface proteins), which attract PGCs towards each other, resulting in clump or aggregate formation. At high concen- tration, there is exacerbated proliferation followed by clump formation. These aggregates eventually increase cellular toxicity in the culture (Yao and Asayama, 2017). These results were consistent with our findings. Both male and female PGCs form aggregates, but in the case of female cell lines this was observable at lower cell concentrations. For the GFP-ZW-5ZP PGC line we could detect in- creased cell clump formation from 32 h of culturing. The clump formation was thus decreasing the proliferation rate.
The primary mechanisms of molecular signalling pathways controlling the proliferation rate or growth pattern of PGCs are not yet fully elucidated. Despite the establishment of an optimum PGC culture medium there is clump/aggregation formation noticed during in vitro culturing of PGCs. Hence, understanding these
mechanisms and identifying the main molecules or genes responsible for control- ling the growth would open doors for future work and applications related to the culturing of PGCs (Nakamura, 2016). The maintenance of PG cells under opti- mal culture conditions can improve the efficiency of cryopreservation, genome modification or drug design studies. Our study demonstrated that, using an au- tomated cell image analyser, the optimal PGC culture condition can be identified in a short period of time.
Acknowledgements
This work was supported by the IMAGE Horizon 2020 Research and Innovation Programme (677353, IMAGE) (EPV, KL), GÉNNET_21 (VEKOP-2.3.2-16-2016- 00012) (EG, EPV, KL), the National Research, Development and Innovation Fund (KTIA_AIK_12-1-2012-0025) (LH), and the Momentum Programme of the Hungarian Academy of Sciences (LP2012-025) (LH).
References
Agnew, D. J. G., Green, J. E. F., Brown, T. M., Simpson, M. J. and Binder, B. J. (2014): Distin- guishing between mechanisms of cell aggregation using pair-correlation functions. J. Theor.
Biol. 352, 16–23.
Alfi, O. S., Donnell, G. N. and Derencsenyi, A. (1973): C-banding of human chromosomes pro- duced by D.N.ase. Lancet 302, 505.
Bertocchini, F. and Chuva de Sousa Lopes, S. M. (2016): Germline development in amniotes: A paradigm shift in primordial germ cell specification. BioEssays 38, 791–800.
De Melo Bernardo, A., Sprenkels, K., Rodrigues, G., Noce, T., Chuva de Sousa Lopes, S. M.
(2012): Chicken primordial germ cells use the anterior vitelline veins to enter the embryon- ic circulation. Biol. Open 1, 1146–1152.
Hegedüs, L., Padányi, R., Molnár, J., Pászty, K., Varga, K., Kenessey, I., Sárközy, E., Wolf, M., Grusch, M., Hegyi, Z., Homolya, L., Aigner, C., Garay, T., Hegedüs, B., Timár, J., Kállay, E. and Enyedi, Á. (2017): Histone deacetylase inhibitor treatment increases the expression of the plasma membrane Ca2+ pump PMCA4b and inhibits the migration of melanoma cells independent of ERK. Front. Oncol. 2017 May 24; 7:95. doi: 10.3389/fonc. 2017. 00095.
eCollection 2017.
Kagami, H. (2016): Perspectives on avian stem cells for poultry breeding. Anim. Sci. J. 87, 1065–1075.
Kecse-Nagy, C., Szittner, Z., Papp, K., Hegyi, Z., Rovero, P., Migliorini, P., Lóránd, V., Homolya, L. and Prechl, J. (2016): Characterization of NF-κB reporter U937 cells and their applica- tion for the detection of inflammatory immune-complexes. PLoS One 2016 May 27;
11(5):e0156328. doi: 10.1371/journal.pone.0156328. eCollection 2016.
Lázár, B., Anand, M., Tóth, R., Várkonyi, E. P., Liptói, K. and Gócza, E. (2018): Comparison of the microRNA expression profiles of male and female avian primordial germ cell lines.
Stem Cell Int. 2018, 1–17. doi: 10.1155/2018/1780679. eCollection 2018.
Lázár, B., Tóth, R., Nagy, A., Anand, M., Liptói, K., Patakiné Várkonyi, E. and Gócza, E. (2017):
Primordial germ cell-based biobanking of Hungarian indigenous chicken breeds. Poult.
Sci. 96, 62.
Lee, J. C. I., Tsai, L. C., Hwa, P. Y., Chan, C. L., Huang, A., Chin, S. C., Wang, L. C., Lin, J. T., Linacre, A. and Hsieh, H. M. (2010): A novel strategy for avian species and gender identi- fication using the CHD gene. Mol. Cell. Probes 24, 27–31.
McGrew, M. J., Sherman, A., Ellard, F. M., Lillico, S. G., Gilhooley, H. J., Kingsman, A. J., Mi- trophanous, K. A. and Sang, H. (2004): Efficient production of germline transgenic chick- ens using lentiviral vectors. EMBO Rep. 5, 728 LP-733.
Nakamura, Y. (2016): Poultry genetic resource conservation using primordial germ cells. J. Re- prod. Dev. 62, 2016–2052.
Nakamura, Y., Kagami, H. and Tagami, T. (2013): Development, differentiation and manipulation of chicken germ cells. Dev. Growth Differ. 55, 20–40.
Raucci, F., Fuet, A. and Pain, B. (2015): In vitro generation and characterization of chicken long- term germ cells from different embryonic origins. Theriogenology 84, 732–742.
Renner, W. A., Jordan, M., Eppenberger, H. M. (1993): Cell–cell adhesion and aggregation : influ- ence on the growth behavior of CHO cells. Biotechnol. Bioeng. 41, 188–193.
Ronen, D. and Benvenisty, N. (2014): Sex-dependent gene expression in human pluripotent stem cells. Cell Rep. 8, 923–932.
Sancho, M., Di-Gregorio, A., George, N., Pozzi, S., Sánchez, J. M., Pernaute, B. and Rodríguez, T.
A. (2013): Competitive interactions eliminate unfit embryonic stem cells at the onset of differentiation. Dev. Cell 26, 19–30.
Sztán, N., Lázár, B., Bodzsár, N., Végi, B., Liptói, K., Pain, B. and Várkonyi, E. P. (2017): Suc- cessful chimera production in the Hungarian goose (Anser anser domestica) by intracardiac injection of blastodermal cells in 3-day-old embryos. Reprod. Fertil. Dev. 29, 2206–2216.
Tóth, R., Lázár, B., Anand, M., Nagy, A., Patakiné Várkonyi, E. and Gócza, E. (2017): Compari- son the germ and stem cell specific marker expression in male and female embryo derived chicken PGCs. In: Heiszler, Zs., Hohol, R. and Éles-Etele, N. (eds) Hungarian Molecular Life Sciences Conference. Programme and Book of Abstracts. Eger, Hungary. pp. 240–241.
Van Der Sanden, B., Dhobb, M., Berger, F. and Wion, D. (2010): Optimizing stem cell culture. J.
Cell. Biochem. 111, 801–807.
Whyte, J., Glover, J. D., Woodcock, M., Brzeszczynska, J., Taylor, L., Sherman, A., Kaiser, P. and McGrew, M. J. (2015): FGF, insulin, and SMAD signaling cooperate for avian primordial germ cell self-renewal. Stem Cell Reports 5, 1171–1182.
Yao, T. and Asayama, Y. (2017): Animal-cell culture media: History, characteristics, and current issues. Reprod. Med. Biol. 16, 99–117.