Journal of Analytical and Applied Pyrolysis 135 (2018) 32-43
On the significance of potassium and chlorine content of lignocellulose during torrefaction
Eszter Barta-Rajnai, Bence Babinszki, Zoltán Sebestyén, Sándor István Czirok, Zoltán May, Emma Jakab, Zsuzsanna Czégény*
Institute of Materials and Environmental Chemistry, Research Centre for Natural Sciences, Hungarian Academy of Sciences, Magyar tudósok körútja 2, Budapest, H-1117, Hungary
*E-mail: czegeny.zsuzsanna@ttk.mta.hu ABSTRACT
In this work, the effect of inorganic content during the torrefaction of black locust wood, wheat straw, and rape straw was studied. The torrefaction experiments were carried out at five temperatures: 200, 225, 250, 275 and 300 °C using 1 h isothermal period. In order to study the influence of inorganic content, the raw samples were washed with hot water to remove the majority of the water soluble inorganic components. The inorganic ion content of the original and washed raw materials was measured by inductively coupled plasma optical emission spectrometry (ICP-OES) method. The thermal stability and the effect of torrefaction on the chlorine content of lignocelluloses were studied by the thermogravimetry/mass spectrometry method. The degree of hemicellulose and cellulose decomposition of the original and washed samples during torrefaction at different temperatures was characterized by compositional analysis of the samples. The cellulose, hemicellulose, and Klason lignin contents of the samples were determined by acidic hydrolysis and subsequent high-performance liquid chromatography analysis. The thermal degradation properties of original and washed samples have been compared. Principal component analyses (PCA) have been applied to identify the similarities and differences between the untreated and various torrefied black locust wood, rape straw, and wheat straw samples. We found that contrary to cellulose the impact of the alkaline ions on the thermal decomposition of hemicelluloses is marginal. As a result of washing the hemicellulose content of the black locust and rape straw samples became
thermally slightly more stable in the 200-300 °C temperature range, while in case of wheat straw this effect is not significant. The formation of methyl chloride was detected during thermal decomposition. We found that most of the methoxy groups of straw lignins were cleaved during torrefaction at 275 and 300 °C, hence the severely torrefied straw samples produced only small amount of methyl chloride during thermal decomposition.
KEYWORDS: torrefaction, inorganic ions, methyl chloride, potassium, chemical composition, thermogravimetry/mass spectrometry
HIGHLIGHTS:
The effect of alkali concentration on the hemicellulose decomposition is marginal
The effect of washing is more pronounced at higher torrefaction temperatures
The formation of methyl chloride was detected during thermal decomposition
The methoxy groups of straw lignins were cleaved during severe torrefaction
LIST OF ABBREVIATIONS:
BL 200 Torrefied black locust obtained by torrefaction at 200 °C
BL 200_W Washed torrefied black locust wood obtained by torrefaction at 200 °C BL U Untreated black locust
Char Char residue at 900 °C temperature DTG Derivative thermogravimetric curve
DTGmax Maximum value of the DTG curve (maximum decomposition rate) PCA Principal Component Analysis
RS Rape straw
Tpeak Temperature of the maximum of the DTG curve TG/MS Thermogravimetry/mass spectrometry
WS Wheat straw
1. INRODUCTION
Lignocellulose is an abundant carbonaceous energy source on the Earth; hence, it has attracted considerable attention as a replacement for fossil fuels.The Paris Agreement brings all nations together to fight climate change and to keep the global temperature rise this century well below 2 °C above the pre-industrial levels [1]. This strategy indicates that the utilization of biomass as source of renewable energy will have to increase considerably in the next decade. However, in energetic applications, the properties of raw lignocellulosic materials create challenges for their efficient utilization.
Several thermal conversion technologies exist to produce bioenergy from lignocellulosic biomass [2], such as combustion [3], gasification [4], liquefaction [5], pyrolysis [6, 7], as well as co-firing of biomass and coal [8].The pyrolysis of lignocellulosic biomass, such as straw and wood, is now considered a promising way to generate renewable fuels and chemical products. In the last decades, an increasing interest can be observed for torrefaction, which is a mild pyrolysis performed between 200 and 300 °C in an inert atmosphere for the partial conversion of biomass [9].A major goal of torrefaction is to upgrade the quality of the solid product by decreasing the moisture content and increasing the hydrophobicity, grindability, and energy density of biomass [10].The volumetric energy density of torrefied biomass can be improved by a combined grinding and pelletizing step after torrefaction [11, 12]. While pelletization of lignocellulose is an established technology, torrefaction is still a developable process for the production of solid energy carriers. The major technical challenges are the predictability and consistency of the product quality, the flexibility related with using different input materials, and the densification of torrefied biomass [13].
The chemical composition of the biomass material is an important factor, the quality and composition of torrefied biomass is influenced by the properties of the raw lignocelluloses. It is known that during pyrolysis, the inherent inorganic components of biomass materials have significant effect on the decomposition mechanisms. Herbaceous materials have high
inorganic content (4-16%), while wood samples contain rather low amount of inorganic materials (0.5-1.5%). Of all the metals present in lignocelluloses, potassium has the greatest effect on the thermal decomposition mechanisms, and cellulose is the most sensitive component. The presence of potassium and sodium promotes gas and char formation during cellulose pyrolysis. The levoglucosan yield is reduced in the presence of alkali metal ions, indicating that the depolymerization reactions are hindered, while the fragmentation reactions of the sugar moieties to low molecular weight components are promoted [14-16], leading to the decreased decomposition temperature and the increased char yield. Furthermore, the maximum rate of the decomposition is considerably lower in the presence of alkali ions [17, 18].
The release of chlorine may cause fouling, slagging, and corrosion problems during thermochemical conversion. The concentration and the compounds of chlorine vary in different lignocellulosic materials. In woody biomass, the concentration of Cl– is usually very low (<0.01%); however, in straws the concentration of Cl– is much higher, ranging from 0.1 to 0.6% [19]. Chlorine and potassium are usually present as KCl, which is the key inorganic constituent of lignocellulosic material [19, 20].Jensen et al. [21] observed that the chlorine was released in two steps during pyrolysis, more than half of the initial chlorine was released between 200-400 °C, and the other part of the chlorine was released between 700 and 900 °C.
Björkman and Strömberg [22] presented that less than 10% of the chlorine was evaporated at 200 °C, while 20−50% of the chlorine was released during pyrolysis of lignocelluloses of annual plants below 400 °C. Keipi et al. [23] studied the effect of torrefaction on the chlorine content of eight woody biomass materials, and they concluded that torrefaction at 260 °C reduced the chlorine content of the investigated samples. The release of methyl chloride from leaves and woody biomass in the temperature range of 150-350 °C was observed by Hamilton et al. [24]; however, Knudsen et al. [25] suggested that chlorine is released as HCl gas during pyrolysis at temperatures below 500 °C. The release of chlorine during torrefaction and the
pyrolysis of six biomass materials have been investigated in the temperature range of 150-500
°C by Saleh et al. [20]. They concluded that most of the chlorine content released at 350 °C as methyl chloride. They also found that lignocelluloses with lower chlorine content released relatively higher amount of chlorine during the pyrolysis process. This could indicate that the chlorine release is controlled by a reaction between KCl and the organic constituents. A recent study [19] presented that a significant amount of methyl chloride can be released from KCl-doped pine wood and lignin, although the release of methyl chloride from KCl-doped cellulose and xylan is negligible. They suggested that the methoxy groups in pine wood and lignin are responsible for the reaction with KCl and the formation of methyl chloride. In the above mentioned publications, the relative release of chlorine was generally calculated by the use of a mass balance and by the analysis of the biomass chlorine content before and after the heat treatment, therefore qualitative (e.g. CH3Cl or HCl) and quantitative data of the amount of chlorine from the different biomass materials is limited. The formation of methyl chloride was detected by thermogravimetry/mass spectrometry by Czégény et al. [26] during the thermal decomposition of polyvinylchloride (PVC) - wood and wood component mixtures and they concluded that the methoxy groups on the phenolic rings of lignin are the methyl source of methyl chloride.
To estimate the effect of the torrefaction pretreatment during thermochemical conversion, it is important to widen our knowledge on how the inorganic elements modify the thermal decomposition during torrefaction. In our previous work, the thermal behavior of untreated and torrefied black locust wood, wheat straw, and rape straw samples was studied with the goal of understanding better the thermal conversion process taking place during torrefaction [27]. The aim of this further work is to clarify the influence of the inorganic ion contents on the thermal degradation process during torrefaction. In the recent years, the effects of combined water washing and torrefaction pretreatments were investigated [34-38]. They found that the water washing prior to torrefaction could effectively remove a large portion of
the ash content of the biomass materials and improve the biomass characteristics to a certain extent, which related to the removal of catalytic metals (particularly potassium) by the washing method. In this study we also have chosen a water washing method to remove the majority of the water soluble inorganic components. The inorganic ion content of the original and washed raw materials was measured by inductively coupled plasma optical emission spectrometry (ICP-OES). The torrefaction of original and washed black locust wood, rape straw, and wheat straw was carried out at five temperatures: 200, 225, 250, 275 and 300 °C using 1 h isothermal period. The thermal stability and the formation of the volatile products from the untreated and torrefied samples were studied by thermogravimetry/mass spectrometry. The degree of hemicellulose and cellulose decomposition during torrefaction at different temperatures was characterized by compositional analysis of the samples. The thermal degradation properties of raw and washed samples have been compared. Principal component analyses (PCA) have been applied to identify the similarities and differences between the original and washed untreated and various torrefied black locust wood, rape straw, and wheat straw samples.
2. MATERIALS AND METHODS 2.1 Raw materials
In the experimental work, wheat straw and rape straw were used as herbaceous materials;
while black locust wood was selected as hardwood. The raw samples were dried in an oven at 105 °C for 24 h to obtain samples of similar moisture content for the experiments. The untreated samples were ground to <1mm particle size by a cutting mill and further ground to
<0.12 mm particle size. The original untreated and torrefied wheat straw, rape straw, and black locust samples were characterized in detail in our previous work [27].
2.2 Methods
2.2.1 Washing procedure
In order to study the effect of inorganic content we washed the raw samples with hot demineralized water to remove the majority of the water soluble inorganic components.
About 1 g of the ground sample was stirred with 100 mL of 60 °C distilled water for 20 min.
Afterward the samples were separated by centrifugation. These steps were repeated two more times; then the washed raw materials were dried at 105 °C for 24 hours. The efficiency of the inorganic ion removal was tested by inductively coupled plasma - optical emission spectrometry (ICP-OES) method.
2.2.2 Inductively coupled plasma-optical emission spectrometry (ICP-OES)
ICP-OES measurements were applied to determine the inorganic contents of the original and hot demineralized water washed samples. Approximately 2 g biomass samples were ashed at 550 °C in a furnace according to CEN/TS 14775:2004 standard method. The ashes were fused at 920 °C with a fusion blend (Li2B4O7:LiBO2, 2:1) and digested by 25 mL 33% nitric acid.
The potassium content of the samples was determined by a Spectro Genesis ICP-OES (Spectro Analytical Instruments) with axial plasma observation. The amounts of the ashes have been determined according to the CEN/TS 14775 EU standard method.
2.2.3 Torrefaction experiments
The torrefaction experiments were performed in nitrogen atmosphere in a horizontal tube furnace (Figure 1). About 4g samples were treated in a 200 mm long glass boat. The flow rate of the nitrogen gas was set to a relatively low value of 20 mL min−1 to avoid the removal of the smaller particles from the boat, therefore the tube furnace was flushed with the carrier gas thoroughly (approximately 40 min) before the experiments. The torrefaction experiments were performed at five different temperatures (200, 225, 250, 275, and 300 °C) using an isothermal period of 1 h.
Figure 1 Schematic diagram of experimental set-up of torrefaction in horizontal tube furnace.
2.2.4 Compositional analysis
The contents of carbohydrates were determined according to the NREL method applying slight modifications [28]. The original, hot demineralized water washed and various torrefied samples were treated in a two-step acid hydrolysis with 72% H2SO4 for 2 h at room temperature and then with 4% H2SO4 for 1 h at 121 °C. The obtained suspensions were filtered and washed with demineralized water through G4 glass filter crucibles. The sugar concentrations (glucose, xylose, and arabinose) of the filtered supernatants were analyzed with high-performance liquid chromatography (HPLC) using an Agilent 1260 system with a Hi-Plex H column (Agilent, Santa Clara, CA) at 65 °C. An eluent of 5 mM H2SO4 was used at a flow rate of 0.5 mL min−1. The solid residues obtained after washing were dried at 105 °C until a constant weight. The dried residues consisted of acid-insoluble organics and acid- insoluble ash. The amounts of total ash and acid-insoluble ash were determined by ashing the sample at 550 °C for 5 h until the sample weight was constant [29]. The Klason lignin content was calculated by subtracting the acid-insoluble ash content from the acid-insoluble residue content. All experimental data were determined using three replicates.
2.2.5 Thermogravimetry-Mass spectrometry (TG/MS)
Thermogravimetry/mass spectrometry was applied to provide information about the change in the thermal stability and composition of the samples. The used TG/MS system consists of a
modified Perkin-Elmer TGS-2 thermobalance and a Hiden HAL quadrupole mass spectrometer. About 4 mg samples were placed into the platinum sample pan and the furnace was flushed with the carrier gas thoroughly before the experiments. Then the samples were analyzed in argon atmosphere from 25 to 900 °C at a rate of 20 °C min−1 in a platinum sample pan. The evolved products were led through a glass-lined metal capillary heated at 300 °C using argon carrier gas at a flow rate of 140 mL min−1. The ion source of the mass spectrometer was operated at 70 eV electron energy. The mass range of 2-150 Da was scanned excluding the most intense ions of the argon. The ion intensities were normalized to the sample mass and to the intensity of the 38Ar isotope of the carrier gas (used as an internal standard). Since the MS intensities of various products have different magnitudes, they have been scaled to gain comparable peak heights in the plots. The curves of the individual species developed from different samples are plotted using the same scale.
2.2.6 Principal Component Analysis (PCA)
A chemometric tool, PCA, using Statistica 12 software (StatSoft, Inc., Tulsa, OK) was employed. PCA has been applied to illustrate similarities and differences between the original and the hot demineralized water washed samples [30]. PCA is a technique that decreases the data dimensionality and makes pattern visualization by converting the original measured data into new uncorrelated variables (principal components). The principal components (factors) are the linear combinations of the original measured variables. The factors explain different percentages of the total variance; generally two or three factors are enough to describe the differences and similarities between the samples. The results can be presented in the score plots, which place the samples in the space of two factors. Factor loadings show the correlation between the original data and the principal components.
3. RESULTS AND DISCUSSION
3.1 Inorganic contents of original and washed biomass
Table 1 shows the ash and potassium contents of the original and washed samples. As the data illustrate, ash contents of the two original straw samples are significantly higher in comparison to the original black locust sample; furthermore, the original wheat and rape straw samples have an order of magnitude higher K+ content than the original wood sample.
The ash content of the three studied samples is significantly decreased after the washing procedure; moreover, the potassium ion content of the samples was removed successfully.
Table 1 Ash and potassium contents of the original [27] and hot water washed samples Ash content (% m/m) K+ content (% m/m)
Original black locust wood 1.75 0.27
Washed black locust wood 1.48 0.01
Original wheat straw 5.68 1.69
Washed wheat straw 2.51 0.06
Original rape straw 6.04 1.86
Washed rape straw 1.93 0.03
The original and washed black locust wood, rape straw, and wheat straw were torrefied at five different temperatures (200, 225, 250, 275 and 300 °C) using 1 h isothermal period. The thermally untreated (original and washed) and treated samples were characterized and their thermal properties were compared.
3.2 Comparison of the chemical composition of the original and washed samples
The compositional analysis of original and hot water washed black locust wood, wheat straw and rape straw samples was performed to better understand the thermal conversion processes during torrefaction. Table 2, Table 3, and Table 4 show the compositional analysis of the original [27] and the washed black locust wood, rape straw, and wheat straw samples, respectively. To compare the degradation degree of the components in the torrefied samples, one has to take into consideration the mass loss during the torrefaction experiment as well.
Therefore, Table 2-4 also show the mass loss during the torrefaction at different temperatures.
The standard deviation values for the compositional analysis are also presented in Table 2-4.
The glucan content of the samples mainly characterizes the cellulose component of lignocellulose O-Acetyl-4-O-methylglucuronoxylan is the main building block of hemicellulose in hardwood species, while in herbaceous biomass; arabinoxylans are the dominant hemicellulose polysaccharides. The sum of the xylan and arabinan contents represents well the majority of the hemicellulose fraction of black locust and straw samples.
The changes in xylan and arabinan content indicates the decomposition of hemicellulose during torrefaction, however the total hemicellulose content may be slightly different. The Klason lignin is defined as the acid-insoluble residue of the samples without the acid- insoluble ash content. The fraction denoted “Other” represents the sum of the unquantified components (e.g. extractables, acid soluble lignin and acid soluble minerals). During torrefaction, the lignocellulose materials decompose to different degrees depending upon the applied temperature. Figure 2 presents the variation of the relative amount of glucan, and sum of xylan, and arabinan in the torrefied samples which reflects the changes in the relative amount of cellulose and hemicellulose in the samples. The presented data obtained by dividing the measured glucan or sum of xylan and arabinan content of the torrefied samples by that of the thermally untreated samples. The decreasing carbohydrate yields indicate the
progress of the thermal decomposition of hemicellulose and cellulose during torrefaction at various temperatures. Comparing the changes of carbohydrate content of the samples as a function of torrefaction temperature (Table 2-4 and Figure 2) it can be concluded that hemicellulose (measured as the sum of arabinan and xylan) is thermally less stable comparing to cellulose during torrefaction. The changes in the relative amount of hemicellulose show similar tendencies as a function of the torrefaction temperature for the original and hot water washed samples. Furthermore, the tendencies are similar in case of both the black locust and straw samples, indicating the marginal effect of alkali concentration. As a result of washing the hemicellulose content of black locust and rape straw samples became thermally slightly more stable in the whole temperature range (200-300 °C); while this effect is less visible in case of wheat straw. At 300 °C, only trace amounts of hemicellulose remained in the original samples; however the washed samples still have measurable amount of hemicellulose.
Studying the washed samples we may conclude that the hemicellulose content of the washed samples was thermally more stable, but the role of the alkali ions in the decomposition mechanism is questionable. The extracted components may be responsible for the deflection.
As discussed above, the relative amount of hemicellulose changed similarly in the original wood and straw samples as a function of the torrefaction temperature indicating no measurable effect of the different alkali ion contents in the higher concentration range. The catalytic effect of alkali ions on the thermal decomposition of cellulose is reflected in the steeply decreasing cellulose content of the high alkali ion containing original straw samples over 250 °C torrefaction temperature. The cellulose content of black locust wood decompose at moderate rate in this temperature range, while only one third of the cellulose content decompose at 300 °C in the washed samples. Irrespectively of the alkali ion concentration, the cellulose thermally stable up to 225 °C in the studied samples. The effect of alkali ion concentration was studied by Sebestyén et al. [31] on the thermal decomposition of hemp and it was concluded that the TG/MS parameters of cellulose decomposition were changing very
steeply in the low concentration range and they were levelling off in the high concentration range. The comparison of the original and washed samples of the same torrefaction temperature shows that the hot water washed samples have significantly higher amount of cellulose than the original samples, even at the torrefaction temperature of 275-300 ˚C. As Table 1 shows, the herbaceous samples have more than an order of magnitude higher potassium ion content than wood. The catalytic effect of alkali ions on the thermal decomposition of cellulose is known at higher temperatures [14, 32, 33]. The results obtained for the cellulose content of the original and hot water washed torrefied samples confirm that the alkali ions have a catalytic effect on cellulose decomposition, even at the low temperatures used in torrefaction. As Table 2-4 present, increasing the torrefaction temperatures resulted in an increase in the Klason lignin content of the studied samples.
Besides the acid-insoluble lignin, Klason lignin contains all acid-insoluble components of the sample, excluding ash. During the torrefaction experiments, some parts of the extractives, cellulose, hemicellulose, and acid soluble lignin were probably transformed into acid- insoluble carbonaceous products by cross-linking and charring reactions. The increasing torrefaction temperature promotes these reactions, resulting in the increased Klason lignin value at higher temperatures.
Table 2 Composition of the original [27] or washed untreated and torrefied black locust samples. The percentage data are corrected with the mass loss values, thus the compositional data are referred to the untreated sample masses. Standard deviations are calculated from triplicates.
Sample Glucan Xylan Arabinan Klason lignin Other** Mass loss***
(% m/m) (% m/m) (% m/m) (% m/m) (% m/m) (% m/m)
BL Original Washed Original Washed Original Washed Original Washed Original Washed Original Washed BL U 34.2 ± 0.7 38.6 ± 0.0 15.8 ± 0.2 16.3 ± 0.0 0.6 ± 0.0 2.0 ± 0.0 25.8 ± 1.1 22.4 ± 0.2 23.6 20.7 0 0 BL 200 31.2 ± 1.4 37.1 ± 0.4 14.4 ± 0.4 15.5 ± 0.1 0.8 ± 0.0 1.8 ± 0.1 23.1± 0.1 22.7± 0.4 21.5 17.9 9 5 BL 225 35.6 ± 1.1 37.6 ± 0.4 12.5 ± 0.6 15.0 ± 0.2 0.6 ± 0.0 1.5 ± 0.1 24.4 ± 0.2 24.9 ± 0.6 13.9 15.0 13 6 BL 250 31.3 ± 1.0 38.8 ± 0.5 8.0 ± 0.5 10.5 ± 0.2 0.1 ± 0.0 0.8 ± 0.2 32.8 ± 2.4 26.8 ± 0.1 6.8 10.1 21 13 BL 275 29.2 ± 1.1 34.6 ± 0.4 4.1 ± 0.2 4.4 ± 0.2 *N. D. 0.3 ± 0.1 30.4 ± 0.8 29.1 ± 0.5 4.3 6.6 32 25 BL 300 10.8 ± 1.1 23.9 ± 2.5 0.3± 0.3 1.0± 0.6 *N. D. 0.1 ± 0.2 35.0 ± 0.2 29.7 ± 3.0 2.9 5.3 51 40
*N. D.: not detected, below the detection limit
** “Other” represents the sum of the unquantified components
** *Mass loss during torrefaction
Table 3 Composition of the original [27] or washed untreated and torrefied rape straw samples. The percentage data are corrected with the mass loss values, thus the compositional data are referred to the untreated sample masses. Standard deviations are calculated from triplicates.
Sample Glucan Xylan Arabinan Klason lignin Other** Mass loss ***
(% m/m) (% m/m) (% m/m) (% m/m) (% m/m) (% m/m)
RS Original Washed Original Washed Original Washed Original Washed Original Washed Original Washed RS U 27.9 ± 0.6 33.8 ± 0.3 15.3 ± 0.3 17.9 ± 0.1 1.6 ± 0.0 2.1 ± 0.1 21.1 ± 0.5 21.0 ± 0.2 34.1 25.2 0 0
RS 200 26.2 ± 0.7 32.1 ± 0.1 14.0 ± 0.5 16.8 ± 0.1 1.3 ± 0.0 1.9 ± 0.2 23.1 ± 0.1 21.8 ± 0.3 26.4 21.4 9 6 RS 225 25.5 ± 0.7 31.7 ± 0.2 11.2 ± 1.1 15.3 ± 0.1 0.7 ± 0.1 1.4 ± 0.2 24.3 ± 0.3 23.0 ± 0.3 23.3 17.6 15 11 RS 250 24.3 ± 0.4 31.9 ± 0.2 7.7 ± 0.1 10.8 ± 0.4 0.3± 0.0 0.7 ± 0.0 28.7 ± 0.2 25.8 ± 0.6 15.0 13.8 24 17 RS 275 12.9 ± 0.2 29.4 ± 0.2 2.3 ± 0.1 5.0 ± 0.4 *N. D. 0.4 ± 0.2 35.2 ± 0.1 28.0 ± 0.4 10.6 9.2 39 28 RS 300 1.6 ± 0.0 21.6 ± 2.1 *N. D. 1.6 ± 1.4 *N. D. 0.2 ± 0.0 37.9 ± 0.1 27.8 ± 4.5 7.5 6.8 53 42
*N. D.: not detected, below the detection limit
** “Other” represents the sum of the unquantified components
** *Mass loss during torrefaction
Table 4 Composition of the original [27] or washed untreated and torrefied wheat straw samples. The percentage data are corrected with the mass loss values, thus the compositional data are referred to the untreated sample masses. Standard deviations are calculated from triplicates.
Sample Glucan Xylan Arabinan Klason lignin Other** Mass loss***
(% m/m) (% m/m) (% m/m) (% m/m) (% m/m) (% m/m)
WS Original Washed Original Washed Original Washed Original Washed Original Washed Original Washed WS U 33.9 ± 0.6 39.9 ± 0.2 21.2 ± 0.4 23.0 ± 0.1 1.7 ± 0.1 2.7 ± 0.0 19.1 ± 0.1 18.1 ± 0.1 24.1 16.3 0 0
WS 200 33.0 ± 1.0 39.3 ± 0.4 19.3 ± 0.7 22.3 ± 0.2 2.3 ± 0.1 2.6 ± 0.2 19.6 ± 0.2 18.0 ± 0.1 18.8 13.8 7 4 WS 225 32.5 ± 0.2 39.3 ± 0.3 17.7 ± 0.2 21.2 ± 0.8 2.1 ± 0.1 2.4 ± 0.0 20.2 ± 0.2 18.5 ± 0.1 16.5 12.6 11 6 WS 250 28.6 ± 0.4 38.1 ± 0.4 11.9 ± 0.3 13.5 ± 0.6 0.6 ± 0.0 1.2 ± 0.1 23.9 ± 0.1 20.7 ± 0.9 15.0 11.5 20 15 WS 275 13.6 ± 0.2 33.6 ± 0.5 2.3 ± 0.0 4.0 ± 0.5 *N. D. 0.3 ± 0.0 34.5 ± 0.3 24.8 ± 0.6 9.6 7.3 40 30 WS 300 0.7 ± 0.0 28.3 ± 0.2 0.2 ± 0.0 4.3 ± 1.6 *N. D. 0.3 ± 0.1 37.4 ± 0.3 18.4 ± 1.4 5.7 6.7 56 42
*N. D.: not detected, below the detection limit
** “Other” represents the sum of the unquantified components
** *Mass loss during torrefaction
Figure 2 Relative amount of glucan and sum of xylan and arabinan content of the torrefied original [27] and washed black locust (a), wheat straw (b), and rape straw (c) samples as a
function of torrefaction temperature (U: untreated).
3.3 Effect of torrefaction temperature on the thermogravimetric properties of original and washed black locust wood, rape straw, and wheat straw
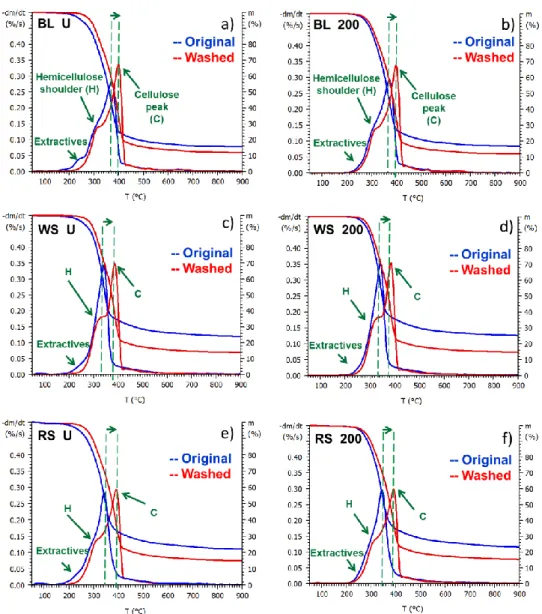
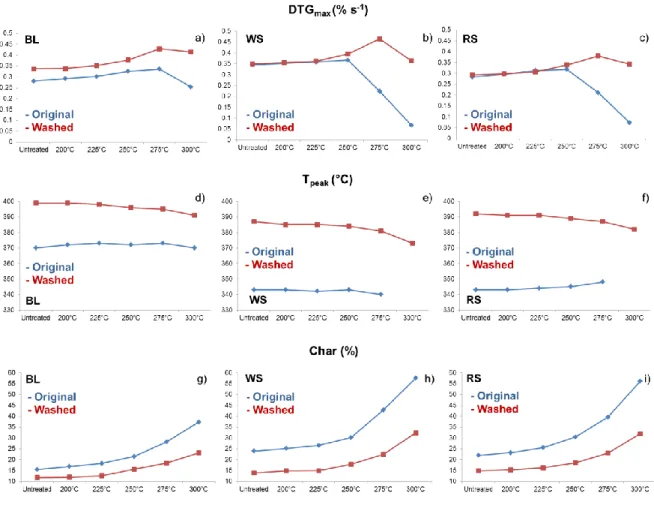
The TG and DTG curves of untreated and lightly (200 °C), mildly (225 and 250 °C) and severely (275 and 300 °C) torrefied samples can be seen in Figures 3-5, while Figure 6 presents the major thermogravimetric parameters (DTGmax, Tpeak and char obtained at 900 °C) of the original and hot water washed biomass samples. Tpeak denotes the temperature of the maximal decomposition rate (DTGmax). As Figure 3 a, c, and e shows, the shoulder of the extractives around 220 °C disappeared from the DTG curves of washed untreated samples, indicating the efficient removal of extractive content by hot water washing. It can be concluded, that the shape of the DTG curves of the untreated samples became rather similar after washing; the hemicellulose shoulder at around 300 °C shows a better separation from the cellulose peak (DTGmax) in the three washed samples. As Figure 3-6 show, the maximal rate of cellulose decomposition of the untreated and torrefied samples is shifted to a higher temperature as a result of washing procedure due to the reduced alkali ion concentration.
Furthermore, it can be concluded that the thermal stability of cellulose in the washed wood sample is raised by about 30 °C, while it is raised by about 50 °C in the hot water washed straw samples compared to the original samples (Figure 6 d, e, and f). These observations are in accordance with other TG studies where increased thermal stability was observed as a result of washing [34,36-37].
The char yield of the raw and torrefied hot water washed samples is significantly lower than for the unwashed samples (Figure 6 g, h, and i). The extent of lowering is higher than the decrease of the ash content as a result of washing. This result confirms the promoting effect
of potassium on the char formation. The char yields are changed to a larger extent in case of washed straw samples than washed wood, due to greater reduction in the alkali ion concentration of straws as a result of washing. This observation is in agreement with the chemical composition results showing that the influence of washing is more pronounced in the case of the straw samples.
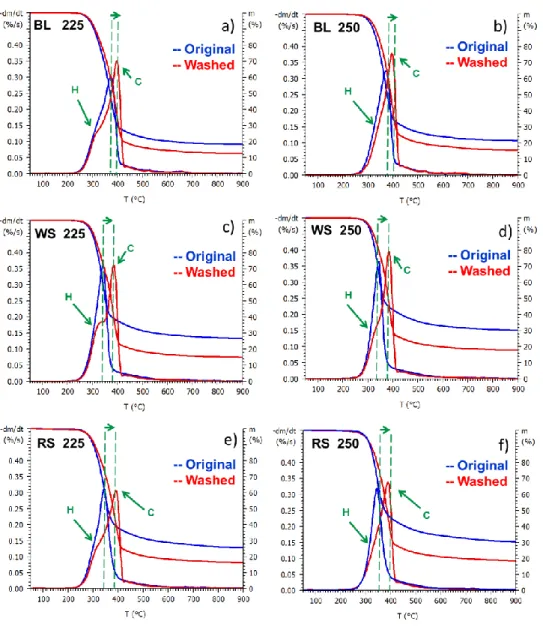
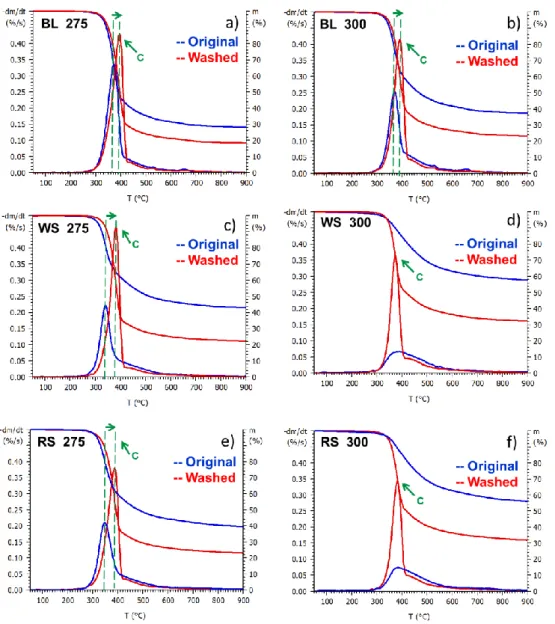
After torrefaction at 250 °C, the characteristic hemicellulose shoulder of the original samples disappeared, while the washed samples still have a shoulder (Figure 4 b, d, and f). Significant differences can be seen after severe torrefaction conditions (275 and 300 °C) between the original and hot water washed samples (Figure 5). After torrefaction at 275 °C, the maximal rate of thermal decomposition of the original straw samples are significantly reduced, while in case of the washed straw samples did not change. This indicates that torrefaction at 275 °C still -did not affect considerably the cellulose content (Figure 5 c and e) of the washed samples. After torrefaction at 300 °C, the DTG curves of the original straw samples have a wide and flat shape (Figure 5 d and f), indicating the almost complete decomposition of cellulose, while the same temperature only slightly affect the cellulose content of the washed straw samples. These observations also designate the catalytic effect of alkali ions on the decomposition of cellulose and are in agreement with the results of the compositional analysis. We can conclude, that the effect of washing is more pronounced at higher torrefaction temperatures.
Figure 3 TG and DTG curves of untreated and lightly (200 °C) torrefied black locust (BL), wheat straw (WS) and rape straw (RS) samples
a ) b )
Figure 4 TG and DTG curves of mildly (225 and 250 °C) torrefied black locust (BL), wheat straw (WS) and rape straw (RS) samples
a ) b )
Figure 5 TG and DTG curves of severely (275 and 300 °C) torrefied black locust (BL), wheat straw (WS) and rape straw (RS) samples.
Figure 6 The main thermogravimetric parameters of the samples as a function of the treatment temperatures. Tpeak cannot be defined in case of the original straw samples torrefied
at 300 °C due to the wide and flat DTG curves.
3.4 Principal component analysis based on TG parameters, and chemical composition data of the original and washed samples
The chemical composition data (Table 2-4) and the thermogravimetry parameters (Figures 3- 6) of the original and washed samples have been used in the PCA calculation as input data to illustrate the differences and similarities between the original, washed, and variously torrefied samples. The first principal component (Factor 1) describes 58.10% of the total variance of the data, while the second principal component (Factor 2) describes 18.79% of the total
variance. As Figure 7 illustrates, the first principal component differentiates the untreated and mildly and severely torrefied samples, while as a function of the second principal component (Factor 2), the original herbaceous samples are found in the upper part of the score plot, and the washed samples are found in the lower part of the score plot. This difference is apparently due to the different inorganic content and chemical composition of the samples, which are reflected in the different thermal properties of original and washed materials. The PCA results illustrate that the difference between the thermal behaviors of the untreated and torrefied washed samples (represented by the changes of Tstart, Tpeak and DTGmax) is much smaller than the difference between original and washed samples.
Figure 7 Results of PCA: score (a) and loading (b) plots based on the compositional analysis and TG parameters. The arrows show the direction of the variation of the samples with the increasing torrefaction temperature. (WS, wheat straw; RS, rape straw; and BL, black locust,
BL_225: black locust wood torrefied at 225 ˚C, BL_225_W: washed black locust wood torrefied at 225 ˚C)
3.5 Formation of methyl chloride under torrefaction
In this part the effect of torrefaction on the lignocellulose chlorine content will be studied.
Evolution of methyl chloride (CH3Cl) was detected among the decomposition products of untreated and torrefied wheat straw and rape straw samples by TG/MS experiments. In order to monitor the release of methyl chloride as a function of temperature, the evolution curves of the molecular ions at m/z 50 and 52 were selected. As Figures 8 and 9 show, the m/z 50 and 52 ion curves are similarly shaped in case of the untreated and torrefied wheat straw and rape straw samples and keep the intensity ratio of 3:1 in the whole temperature range. These facts confirm that the m/z 50 and 52 curves display the evolution of methyl chloride molecular ions correctly, since the intensity ratio of m/z 50 and 52 ions complies with that of natural isotope of chlorine atom at m/z 35 and 37 (3:1). As Figures 8 and 9 present, the amount of evolved methyl chloride was under the detection limit in case of the wood samples contrary to the straw samples. For the confirmation of the TG/MS observations, the chlorine content of the raw materials was measured by ISO 587:1997 method. The chlorine content of untreated black locust wood was 0.04%, while that of rape straw and wheat straw were 0.63% and 0.30% respectively, explaining the TG/MS results. The temperature range of methyl chloride evolution is quite wide, and corresponds to a wide temperature range of lignin decomposition. It starts already at around 200 °C, reaches its maximum at about 350 °C, and ends at around 450 °C in all cases. Considering the relative intensity of the ion curves, the formation of methyl chloride was quite similar from the untreated and torrefied straw samples at 200, 225 and 250 °C. As Figure 9 shows, the relative intensity of the evolution curves of m/z 50 and 52 halved between torrefaction at 250 and at 275 °C, while after torrefaction at
300 °C the evolution curves of methyl chloride almost totally disappeared from the straw samples. As we discussed earlier, methyl chloride is the reaction product of the inorganic chlorine with methyl groups evolved from cellulose or lignin. Recent studies [19, 26]
concluded that the methoxy groups of lignin are the methyl source of methyl chloride. Based on these papers we may conclude that methyl chloride forms analogously from straws, the wide temperature range of methyl chloride evolution also support this phenomenon. Our results revealed that most of the lignin methoxy groups of straw samples were probably cleaved during torrefaction at 275 and 300 °C, and the initial chlorine content of the straw samples was also decreased. Furthermore, we may conclude that TG/MS is an appropriate technique for the detection of methyl chloride from the variously torrefied samples.
Figure 8 DTG curves and the evolution profiles of methyl chloride (monitored at m/z 50 and 52) from untreated and torrefied (200 and 225 °C) black locust (BL), wheat straw (WS) and
rape straw (RS) during TG/MS experiments in argon atmosphere.
Figure 9 DTG curves and the evolution profiles of methyl chloride (monitored at m/z 50 and 52) from mildly and severely torrefied black locust (BL), wheat straw (WS) and rape straw
(RS) during TG/MS experiments in argon atmosphere.
4. CONCLUSION
In order to study the effect of inorganic content during the low-temperature thermal treatment (torrefaction), the raw biomass samples were washed with hot water to remove the majority of the water soluble inorganic components.
Comparing the change in the hemicellulose content of the washed and untreated wood and straw samples as a result of torrefaction, we may conclude that unlike cellulose the influence of the alkaline ions on the thermal decomposition of hemicelluloses is marginal. As a result of washing, the hemicellulose content of the black locust and rape straw samples became
thermally slightly more stable in the whole studied torrefaction temperature range (200-300
°C), while in case of wheat straw this effect is not significant.
We found that the thermal stability of cellulose in the hot water washed wood sample is raised by about 30 °C, while in case of the washed straw samples it is raised by about 50 °C compared to the original samples. The char yield of the raw and torrefied hot water washed samples is significantly lower for the three studied samples than that of the original samples.
We also concluded that the effect of washing is more pronounced at higher torrefaction temperatures. These observations confirm that alkali ions have catalytic effects on the decomposition mechanism of cellulose and lignin even under mild thermal conditions. The PCA results reveal that the difference between the thermal behaviors of the untreated and torrefied washed samples is much smaller than the difference between the original and washed samples.
The formation of methyl chloride was detected during thermal decomposition that was explained by the reaction of inorganic chlorine with the methyl groups of lignin. We concluded that most of the methoxy groups of straw lignins were probably cleaved during torrefaction at 275 and 300 °C, and at the same time the initial chlorine content of the straw samples decreased. Therefore, the severely torrefied straw samples produced only small amount of methyl chloride during thermal decomposition.
ACKNOWLEDGEMENT
The authors are grateful to the NKFIH for financing the TNN 123499 project. The research within project No. VEKOP-2.3.2-16-2017-00013 was supported by the European Union and the State of Hungary, co-financed by the European Regional Development Fund.
REFERENCES
[1] United Nations framework convention on climate change. The Paris Agreement.
www.unfccc.int/2860.php
[2] V.K. Gupta, R. Potumarthi, A. O’Donovan, C.P. Kubicek, G.D. Sharma, M.G. Tuohy, Bioenergy Research: An overview on technological developments and bioresources. In: V.G.
Gupta, M. Tuohy, C.P. Kubicek, J. Saddler, F. Xu (Eds.), Bioenergy Research: Advances and Applications, Elsevier, Waltham, 2014, pp. 23-47.
[3]M. Hupa, O. Karlström, E. Vainio, Biomass combustion technology development- it is all about chemical details. Proc Combust. Inst., 1 (2017) 113-134.
[4] S. Sarker, F. Bimbela, J.L. H.K. Sánchez Nielsen, Characterization and pilot scale fluidized bed gasification of herbaceous biomass: A case study on alfalfa pellets. Energy Convers. Manage., 91 (2015) 451-458.
[5] E. Chornet, R.P. Overend, Biomass Liquefaction: An Overview. In: R.P. Overend, Milne T.A., L.K. Mudge (Eds.), Fundamentals of Thermochemical Biomass Conversion. Springer, Dordrecht, 1985, pp: 967-1002.
[6] R.E. Guedesa, A.S. Lunaa, A.R. Torres, Operating parameters for bio-oil production in biomass pyrolysis: A review, J. Anal. Appl. Pyrol., 129 (2018) 134-149.
[7] L. Zhang, K. Li, X. Zhu, Study on two-step pyrolysis of soybean stalk by TG-FTIR and Py-GC/MS, J. Anal. Appl. Pyrol.,127 (2017) 91-98.
[8] Y.H. Chena, C.C. Chang, C.Y. Chang, M.H. Yuan, D.R. Ji, J.L. Shie, C.H. Lee, Y.H.
Chen, W.R. Chang, T.Y. Yang, T.C. Hsu, M. Huang, C.H. Wu, F.C. Lin, C.H. Ko.
Production of a solid bio-fuel from waste bamboo chopsticks by torrefaction for cofiring with coal, J. Anal. Appl. Pyrol., 126 (2017) 315-322.
[9] X. Shi, F. Ronsse, J.G. Pieters, Space-time integral method for simplifying the modeling of torrefaction of a centimeter-sized biomass particle, J. Anal. Appl. Pyrol.,124 (2017) 486- 498.
[10] P.C.A. Bergman, J.H.A. Kiel Torrefaction for biomass upgrading. ECN Report, ECN- RX--05-180, 2005
[11] N. Mišljenovic, Q.V. Bach, K.Q. Tran, C. Salas-Bringas, Ø. Skreiberg, Torrefaction influence on pelletability and pellet quality of Norwegian forest residues, Energy Fuels, 28 (2014) 2554-2561.
[12] R.A. Khalil, Q.V. Bach, Ø. Skreiberg, K.Q., Tran, Performance of a residential pellet combustor operating on raw and torrefied spruce and spruce-derived residues, Energy Fuels, 27 (2013) 4760-4769.
[13] M. Rudolfsson, E. Borén, L. Pommer, A. Nordin, T.A. Lestander, Combined effects of torrefaction and pelletization parameters on the quality of pellets produced from torrefied biomass, Appl. Energy, 191(2017) 414-424.
[14] G. Várhegyi, M.J. Antal, T. Székely, F. Till, E. Jakab, Simultaneous thermogravimetric- mass spectrometric studies of the thermal decomposition of biopolymers. 1. Avicel cellulose in the presence and absence of catalysts, Energy Fuels, 2 (1988) 267-272.
[15] D.J. Nowakowski, J.M. Jones, Uncatalysed and potassium catalysed pyrolysis of the cell-wall constituents of biomass and their model compounds, J. Anal. Appl. Pyrol., 83 (2008) 12-25.
[16]Jakab E, Analytical Techniques as a tool to understand the reaction mechanism. In: A.
Pandey, T. Bhaskar, M. Stocker, R.K. Sukumaran, Recent advances in thermo-chemical conversion of biomass, Elsevier, Amsterdam, 2015, pp: 73-106.
[17] Y. Sekiguchi, F. Shafizadeh, The effect of inorganic additives on the formation, composition and combustion of cellulosic char, J. Appl. Polym. Sci., 29 (1984) 1267-1286.
[18] I. Tanczos, Gy. Pokol, J. Borsa, T. Tóth, H. Schmidt, The effect of tetramethylammonium hydroxide in comparison with the effect of sodium hydroxide on the slow pyrolysis of cellulose, J. Anal. Appl. Pyrol., 68-69 (2003) 173-185.
[19] Y. Wang, H. Wu, Zs. Sárossy, C. Dong, P. Glarborg, Release and transformation of chlorine and potassium during pyrolysis of KCl doped biomass, Fuel, 197 (2017) 422-432.
[20] S.B. Saleh, J.P. Flensborg, T.K. Shoulaifar, Zs. Sárossy, B.B. Hansen, N. DeMArtin, P.A. Jensen, P. Glarborg, K.D. Johansen, Release of chlorine and sulfur during biomass torrefaction and pyrolysis, Fuel, 28 (2014) 3738-3746.
[21]P.A. Jensen, F.J. Frandsen, K. Dam-Johansen, B. Sander, Experimental investigation of the transformation and release to gas phase of potassium and chlorine during straw pyrolysis, Energy Fuels, 14 (2000) 1280-1285.
[22] E. Björkman, B. Strömberg, Release of chlorine from biomass at pyrolysis and gasification conditions, Energy Fuels, 11 (1997) 1026-1032.
[23] T. Keipi, H. Tolvanen, L. Kokko, R. Raiko, The effect of torrefaction on the chlorine content and heating value of eight woody biomass samples, Biomass Bioenergy, 66 (2014) 232-239.
[24] J.T.G. Hamilton, W.C. McRoberts, F. Keppler, R.M. Kalin, D.B. Haper, Chloride methylation by plant pectin: An efficient environmentally significant process, Science, 301 (2003) 206-209.
[25] J.N. Knudsen, P.A. Jensen, K. Dam-Johansen, Transformation and release to the gas phase of Cl, K, and S during combustion of annual biomass, Energy Fuels, 18 (2004) 1385- 1399.
[26] Zs. Czégény, E. Jakab, J. Bozi, M. Blazsó, Pyrolysis of wood – PVC mixtures.
Formation of chloromethane from lignocellulosic materials in the presence of PVC, J. Anal.
Appl. Pyrol., 113 (2015) 123-132.
[27] E. Barta-Rajnai, E. Jakab, Z. Sebestyén, Z. May, Zs. Barta, L. Wang, Ø. Skreiberg, M.
Grønli, J. Bozi, Zs. Czégény. Comprehensive compositional study of torrefied wood and herbaceous materials by chemical analysis and thermoanalytical methods. Energy Fuels, 30 (2016), 8019−8030.
[28] A. Sluiter, B. Hames, R. Ruiz, C. Scarlata, J. Sluiter, D. Templeton, D. Crocker, Determination of structural carbohydrates and lignin in biomass: Laboratory analytical procedure; National Renewable Energy Laboratory: Golden, CO, Technical Report, NREL/TP-510-42618.
[29] A. Sluiter, B. Hames, R. Ruiz, C. Scarlata , J. Sluiter, D. Templeton, Determination of ash in biomass: Laboratory analytical procedure; National Renewable Energy Laboratory (NREL): Golden, CO, Technical Report, NREL/TP-510-42622.
[30] S. Wold, K. Esbensen, P. Geladi, Principal component analysis, Chemom. Intell. Lab.
Syst., 2: (1987) 37-52.
[31] Z. Sebestyén, Z. May, K. Réczey, E. Jakab, The effect of alkaline pretreatment on the thermal decomposition of hemp, J. Therm. Anal. Calorim., 105 (2011) 1061-1069.
[32] T.K. Shoulaifar, N. DeMartini, O. Karlström, M. Hupa, Impact of organically bonded potassium on torrefaction: Part 1. Experimental. Fuel, 165 (2016) 544-552.
[33] W.F. DeGroot, F. Shafizadeh, The influence of exchangable cations on the carbonization of biomass, J. Anal. Appl. Pyrol., 6 (1984) 217-232.
[34] A. Saddawi, J. M. Jones, A. Williams, C.L. Coeur, Commodity fuels from biomass through pretreatment and torrefaction: Effects of mineral content on torrefied fuel characteristics and quality, Energy Fuels, 26 (2012) 6466-6474.
[35] S. Zhang, Q. Dong, L. Zhang, Y. Xiong, X. Liu, S. Zhu, Effects of water washing and torrefaction pretreatments on rice husk pyrolysis by microwave heating, Biores. Technol. 193 (2015) 442-448.
[36] S. Zhang, Q. Dong, L. Zhang, Y. Xiong, Effects of water washing and torrefaction on the pyrolysis behaviour and kinetics of rice husk through TGA and Py-GC/MS, Biores.
Technol., 199 (2016) 352-361.
[37] K. Cen, D. Chen, J. Wang, Y. Cai, L. Wang, Effects of water washing and torrefaction pretreatments on corn stalk pyrolysis: combined study using TG-FTIR and a fixed bed reactor, Energy Fuels, 30 (2016) 10627-10634.
[38] D. Chen, J. Mei, H. Li, Y. Li, M. Lu, T. Ma, Z. Ma, Combined pretreatment with torrefaction and washing using torrefaction liquid products to yield upgraded biomass and pyrolysis products, Biores. Technol. 228 (2017) 62-68.


![Table 2 Composition of the original [27] or washed untreated and torrefied black locust samples](https://thumb-eu.123doks.com/thumbv2/9dokorg/1386340.114759/14.1262.87.1228.207.554/table-composition-original-washed-untreated-torrefied-locust-samples.webp)
![Table 3 Composition of the original [27] or washed untreated and torrefied rape straw samples](https://thumb-eu.123doks.com/thumbv2/9dokorg/1386340.114759/15.1262.81.1244.208.585/table-composition-original-washed-untreated-torrefied-straw-samples.webp)
![Table 4 Composition of the original [27] or washed untreated and torrefied wheat straw samples](https://thumb-eu.123doks.com/thumbv2/9dokorg/1386340.114759/16.1262.76.1236.176.553/table-composition-original-washed-untreated-torrefied-wheat-samples.webp)