Edited by:
Jennifer L. Robinson, Auburn University, United States
Reviewed by:
Dong-Hoon Lee, Yonsei University, South Korea Elisabetta C. del Re, Harvard Medical School, United States
*Correspondence:
Boldizsár Czéh czeh.boldizsar@pte.hu
†These authors have contributed equally to this work
Specialty section:
This article was submitted to Brain Imaging Methods, a section of the journal Frontiers in Neuroscience
Received:14 January 2020 Accepted:16 April 2020 Published:03 June 2020
Citation:
Nagy SA, Vranesics A, Varga Z, Csabai D, Bruszt N, Bali ZK, Perlaki G, Hernádi I, Berente Z, Miseta A, Dóczi T and Czéh B (2020) Stress-Induced Microstructural Alterations Correlate With the Cognitive Performance of Rats: A Longitudinal in vivo Diffusion Tensor Imaging Study.
Front. Neurosci. 14:474.
doi: 10.3389/fnins.2020.00474
Stress-Induced Microstructural Alterations Correlate With the
Cognitive Performance of Rats: A Longitudinal in vivo Diffusion Tensor Imaging Study
Szilvia Anett Nagy1,2,3,4,5†, Anett Vranesics1,6,7†, Zsófia Varga1, Dávid Csabai1, Nóra Bruszt8,9, Zsolt Kristóf Bali8,10, Gábor Perlaki2,3,4, István Hernádi8,9,10,11, Zoltán Berente6,7, Attila Miseta5, Tamás Dóczi2,3,4and Boldizsár Czéh1,5*
1Neurobiology of Stress Research Group, Szentágothai Research Centre, University of Pécs, Pécs, Hungary,2MTA-PTE, Clinical Neuroscience MR Research Group, Pécs, Hungary,3Department of Neurosurgery, Medical School, University of Pécs, Pécs, Hungary,4Pécs Diagnostic Centre, Pécs, Hungary,5Department of Laboratory Medicine, Medical School, University of Pécs, Pécs, Hungary,6Research Group for Experimental Diagnostic Imaging, Medical School, University of Pécs, Pécs, Hungary,7Department of Biochemistry and Medical Chemistry, Medical School, University of Pécs, Pécs, Hungary,8Translational Neuroscience Research Group, Centre for Neuroscience, Szentágothai Research Centre, University of Pécs, Pécs, Hungary,9Department of Physiology, Medical School, University of Pécs, Pécs, Hungary,10Grastyán Translational Research Centre, University of Pécs, Pécs, Hungary,11Department of Experimental Zoology and Neurobiology, Faculty of Sciences, University of Pécs, Pécs, Hungary
Background:Stress-induced cellular changes in limbic brain structures contribute to the development of various psychopathologies. In vivo detection of these microstructural changes may help us to develop objective biomarkers for psychiatric disorders.
Diffusion tensor imaging (DTI) is an advanced neuroimaging technique that enables the non-invasive examination of white matter integrity and provides insights into the microstructure of pathways connecting brain areas.
Objective: Our aim was to examine the temporal dynamics of stress-induced structural changes with repeatedin vivoDTI scans and correlate them with behavioral alterations.
Methods: Out of 32 young adult male rats, 16 were exposed to daily immobilization stress for 3 weeks. Four DTI measurements were done: one before the stress exposure (baseline), two scans during the stress (acute and chronic phases), and a last one 2 weeks after the end of the stress protocol (recovery). We used a 4.7T small-animal MRI system and examined 18 gray and white matter structures calculating the following parameters: fractional anisotropy (FA), mean diffusivity (MD), axial diffusivity (AD), and radial diffusivity (RD). T2-weighted images were used for volumetry. Cognitive performance and anxiety levels of the animals were assessed in the Morris water maze, novel object recognition, open field, and elevated plus maze tests.
Results: Reduced FA and increased MD and RD values were found in the corpus callosum and external capsule of stressed rats. Stress increased RD in the anterior commissure and reduced MD and RD in the amygdala. We observed time-dependent changes in several DTI parameters as the rats matured, but we found no evidence of
stress-induced volumetric alterations in the brains. Stressed rats displayed cognitive impairments and we found numerous correlations between the cognitive performance of the animals and between various DTI metrics of the inferior colliculus, corpus callosum, anterior commissure, and amygdala.
Conclusions: Our data provide further support to the translational value of DTI studies and suggest that chronic stress exposure results in similar white matter microstructural alterations that have been documented in stress-related psychiatric disorders. These DTI findings imply microstructural abnormalities in the brain, which may underlie the cognitive deficits that are often present in stress-related mental disorders.
Keywords: chronic stress, magnetic resonance imaging, DTI, fractional anisotropy, mean diffusivity, radial diffusivity, Morris water maze, novel object recognition test
INTRODUCTION
Stress is an important element of our everyday life as all living organisms need to overcome external and internal challenges to succeed in life. However, when stress is too severe, or when it becomes chronic, then it may lead to the development of various somatic and mental disorders (McEwen, 1998; Kendler et al., 1999; Chandola et al., 2006; Dube et al., 2009; Lanius et al., 2010; Steptoe and Kivimaki, 2012). It is well-documented that chronic stress can induce morphological and functional changes of specific limbic brain areas, and these alterations are believed to contribute to the development of various psychopathologies (Pittenger and Duman, 2008; MacQueen and Frodl, 2011;
Popoli et al., 2011). Numerous postmortem histopathological studies have documented that stress can modify the dendritic architecture of pyramidal neurons, inhibits adult hippocampal neurogenesis, and affects glial cells, as well as GABAergic interneurons (Lucassen et al., 2014; McEwen et al., 2015, 2016;
Fogaca and Duman, 2019). These neuroanatomical alterations contribute to the disturbed functioning of synaptic contacts (Popoli et al., 2011), which in turn leads to disrupted structural and functional connectivity of neuronal networks and eventually results in impaired emotional and cognitive functioning (de Kloet et al., 1999; Evans and Schamberg, 2009; Kim et al., 2013; Sousa, 2016; Duman et al., 2019).
The rapid methodological developments in magnetic resonance imaging (MRI) allows us to investigate the stress- induced structural changes directly in living organisms. This opportunity inspired numerous research groups to examine the impact of chronic stress on brain activity and morphology in living animals. Henckens and co-workers were the first to carry out a detailed investigation of the consequences of 10 days of repeated immobilization stress on the structural integrity and functional connectivity patterns in the rodent brain, using
Abbreviations:AC, anterior commissure; AD, axial diffusivity; BG, basal ganglia;
CC, corpus callosum; DI, discrimination index; DTI, diffusion tensor imaging;
EC, external capsule; EPM, elevated plus maze test; FA, fractional anisotropy;
HI, habituation index; IC, inferior colliculus; MD, mean diffusivity; MDD, major depressive disorder; MR, magnetic resonance; MRI, magnetic resonance imaging;
MWM, Morris water maze; NOR, novel object recognition test; OFT, open field test; RD, radial diffusivity; ROI, regions of interest.
high-resolution structural MRI, diffusion kurtosis imaging, and resting-state functional MRI (Henckens et al., 2015). They reported that chronic stress exposure can alter large-scale functional connectivity networks by increasing connectivity in the somatosensory, visual, and default mode networks, but it does not induce any major changes in gray matter volumes of the rat brain (Henckens et al., 2015). Later studies, however, found hippocampal atrophy in rats subjected to a 4-weeks chronic unpredictable mild stress paradigm (Li et al., 2017).
More recently, a longitudinal neuroimaging study examined the effects of chronic unpredictable stress on the structure and functional connectome of the rat brain in stress-susceptible and stress-resilient animals (Magalhaes et al., 2018). They found stress-induced structural atrophy of several limbic and non-limbic brain areas, which was associated with increased functional connectivity in a network formed by these specific regions (Magalhaes et al., 2018).
Overall, these MRI studies confirm and further extend the earlier histopathological findings documenting disrupted connectivity between key limbic structures that are known to regulate the stress response. Diffusion tensor imaging (DTI) is an MRI-based neuroimaging technique, which enables the examination of white (and gray) matter integrity and provides insights into the microstructure of pathways connecting different brain areas. The typical readouts of DTI studies are mean diffusivity (MD) and fractional anisotropy (FA), which represent the overall diffusion regardless of directionality (i.e., the degree to which tissue organization limits the diffusion of water molecules) and the degree of diffusion anisotropy (i.e., directionality of diffusion related to tract integrity and the alignment of neuronal fibers), respectively. Other DTI-related parameters, such as axial diffusivity (AD) and radial diffusivity (RD), indicate axonal, and myelin microstructural changes. Therefore, developmental alterations (e.g., myelination), fiber organization, as well as structural integrity of the white matter can be detected by DTI (Yoshida et al., 2013). More recently, advanced diffusion- weighted imaging techniques were developed, such as high angular resolution diffusion (including diffusion spectrum and q- ball imaging) and diffusion kurtosis imaging to model diffusion signal more precisely (Tuch, 2004; Wedeen et al., 2005; Jensen and Helpern, 2010). However, these advanced methods typically
require substantial increase in image acquisition time compared to DTI and therefore cannot be properly applied for in vivo animal studies. Consequently, DTI is by far the most commonly used method to characterize the microstructural changes affecting white and gray matter areas.
So far, only a handful of studies have used diffusion MRI to examine structural alterations in the brains of experimental animals exposed to chronic stress, and the outcome of these studies are inconsistent. Delgado y Palacios and co-workers were the first to report on subtle substructural changes in the hippocampus of chronically stressed rats usingin vivodiffusion kurtosis imaging (Delgado y Palacios et al., 2011). Later, the same research group investigated diffusion properties in the prefrontal cortex, caudate putamen, and amygdala and found that mean kurtosis in the striatum was significantly different between the stress-susceptible and stress-resilient animals (Delgado y Palacios et al., 2014). Parallel to these findings, Vestergaard-Poulsen et al. conducted a high-field (16.4 T) diffusion-weighted MRI in combination with quantitative biophysical modeling of the hippocampal dendritic loss using rats subjected to 3 weeks of restraint stress and found that diffusion-weighted MRI data could sensitively detect regional dendritic loss (Vestergaard- Poulsen et al., 2011). Another research group found significant changes in MD, FA, AD, and RD values in numerous brain areas suggesting demyelination and axonal damage (Hemanth Kumar et al., 2014). Yet, another research group found no evidence for white matter microstructural changes in rats exposed to 10 days of repeated immobilization stress (Henckens et al., 2015). Another study using a tract-based spatial statistics analysis approach reported that stress can increase FA and reduced MD and RD in several white matter bundles of the brain after 2 weeks of repeated inescapable stress (Magalhaes et al., 2017). Others reported increased FA in the hypothalamus and hippocampal CA3 in stress-susceptible mice after 10 days of social defeat stress (Anacker et al., 2016).Ex-vivodiffusion MRI and diffusion kurtosis imaging studies documented specific microstructural changes in the hippocampus, amygdala, and several cortical areas of rats exposed to chronic stress (Khan et al., 2016a,b, 2018).
These findings have been confirmed by a recentin vivoimaging experiment (Liu X. et al., 2018).
To address these discrepancies, we designed an experiment to examine the temporal dynamics of the stress response using repeated DTI measurements of rats subjected to 3 weeks of daily restraint stress. Our hypothesis was that we should observe different microstructural parameters before, during, and after the stress exposure and that the DTI results should be able to differentiate between theacuteandchronicphases of the stress response. We used a chronic stress paradigm, which is known to be stressful for rodents and reliably induce structural changes in the hippocampus and prefrontal cortex including dendritic atrophy of pyramidal cells and reduced neurogenesis in the adult dentate gyrus (Cook and Wellman, 2004; Radley et al., 2004;
McLaughlin et al., 2007; Perez-Cruz et al., 2009a,b; Veena et al., 2009). We carried out repeated DTI measurements at four time points: once before the stress, twice during the stress procedures, and a last one after a recovery period of 2 weeks (Figure 1). In addition, through behavioral profiling, we extensively assessed
the effects of chronic stress on the animals’ cognitive capacity and anxiety levels as numerous studies have documented that these behavioral outcomes are influenced by chronic stress exposure (Katz et al., 1981; Baker and Kim, 2002; Bowman et al., 2003;
Gouirand and Matuszewich, 2005; Rygula et al., 2005; Bondi et al., 2008). The cognitive performance of the animals was assessed in the Morris water maze and novel object recognition tests and we conducted elevated plus maze and open field tests to assess anxiety levels. Our hypothesis was that stress should influence the behavior and that the DTI results should correlate with the behavioral performance of the animals.
MATERIALS AND METHODS Ethics
All animal procedures were carried out in accordance with the guidelines of Decree No. 40/2013 (II. 14) of the Hungarian Government and the EU Directive 2010/63/EU. The experiments were approved by the Hungarian Ethical Committee on Animal Research according to the Ethical Codex of Animal Experiments (License No. BA02/2000-12/2015). Throughout the entire experiment, adequate measures were taken to minimize pain, or discomfort for the experimental animals.
Animals
Thirty-two young male Sprague–Dawley rats (Charles River Laboratories, Sulzfeld, Germany) aged 4 weeks (50–80g) upon arrival were group housed in plastic cages (378×217×180 mm, equipped with feeder and bottle container) under standard animal room conditions (temperature 22–24◦C; humidity 45–
55%; 12 h light/dark cycle; milled chow and waterad-libitum).
Experimental Design
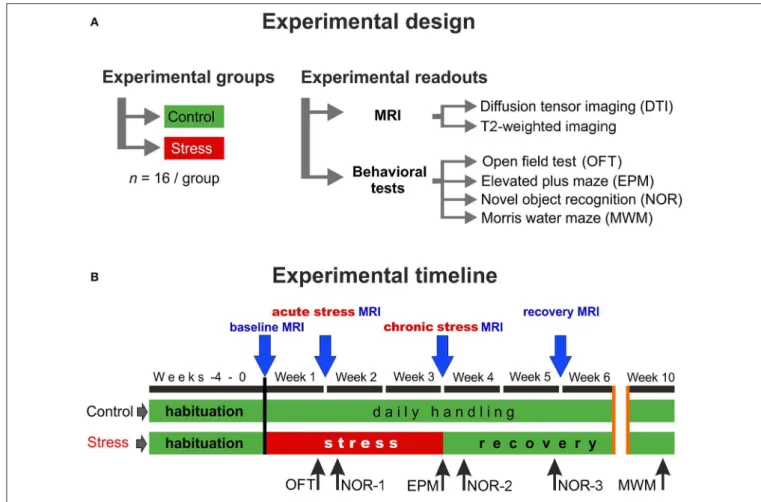
The experimental design and the timeline of the procedures are depicted in Figure 1. First, the animals were allowed to habituate to the new housing conditions for 4 weeks. During this habituation period and throughout the entire experiment, all animals were handled daily. After the 4-weeks habituation period, when animals were 8 weeks old young adults, they were randomly selected and divided into two groups: the control group (n = 16) contained animals that were left completely undisturbed, while the stress group (n = 16) received daily restraint stress for 21 days (Figure 1A). MRI measurements were performed at four time points: the first scan was done before the stress procedure (baselinemeasurements), the second scan was carried out 7 days after the beginning of the stress exposure (acute stress effect), the 3rd scan was done at the end of the 3-weeks stress protocol (chronicstress effect), and the last scan was done 2 weeks after the end of stress procedures (recovery period) (Figure 1B).
Restraint Stress Procedures
Restraint stress protocol was used since it has been demonstrated that this is stressful for rodents and results in pronounced structural changes in the hippocampus and prefrontal cortex including dendritic atrophy and reduced neurogenesis in the adult dentate gyrus (Cook and Wellman, 2004; Radley et al.,
FIGURE 1 |Experimental design and the timeline of the procedures.(A)In this study, two groups of young adult male Sprague–Dawley rats were used (n=16 controls andn=16 stressed animals). We did repeatedin vivoMR imaging and detailed behavioral profiling to assess the effects of chronic stress.(B)MRI measurements were performed on four occasions: first before the stress (baseline), second during the 1st week of the stress exposure (acutestress effect), the third one on the last week of the stress (chronicstress effect), and the last one after 2 weeks of recovery period (recoveryeffect). We used various behavioral tests to assess the emotional and cognitive status of the animals. Blue arrows indicate the timing of MRI scans and the black arrows specify the behavioral tests.
2004; McLaughlin et al., 2007; Perez-Cruz et al., 2009a,b; Veena et al., 2009). During the restraint stress protocol, the animals were immobilized daily for 6 h, between 07:00 a.m. and 1:00 p.m.
using well-ventilated acrylic tubes (Harvard Apparatus, USA) in accordance with our previous protocol (Perez-Cruz et al., 2009a,b). Control rats were kept in a different room and were not subjected to any kind of stress except daily handling.
In vivo MRI
All acquisitions were performed using a 4.7T small-animal MRI system running Paravision 6.0.1 (Pharmascan 47/16 US;
Bruker BioSpin MRI GmbH, Ettlingen, Germany) with a gradient strength of 380 mT/m and a slew rate of 3,420 T/m/s, a circularly polarized hydrogen transmit only volume coil (outer/inner diameter = 89/72 mm), and a circularly polarized hydrogen receive only surface coil anatomically shaped for rat brain.
MRI measurements were performed under inhalation anesthesia using 1.8–2.5% (3% for induction) isoflurane (Forane; Abbvie, Budapest) in 1:2 mixture of O2/N2O, administered via a nosecone. Each rat was placed in prone position on a heated water pad to maintain rectal temperature at∼37◦C, while a head
holder with ear and bite bars were used to prevent head motion.
Respiration was monitored using a pressure sensor placed below the abdomen (SA Instruments, Inc., Stony Brook, NY, USA) and was stable at the range of 50–60 breaths/min under anesthesia.
After a gradient-echo localizer scan in three directions, the imaging protocol included fat-suppressed T2-weighted two dimensional fast-spin echo imaging (2D RARE) in axial, sagittal and coronal planes. Axial T2-weighted images were used for volumetric purposes with the following parameters: TR = 2,429 ms; TE=36 ms; echo spacing=12 ms; echo train length
=8; field of view (FOV)=35×35 mm2; matrix=256×256;
slice thickness=0.7 mm; interslice gap=0.3 mm.
In order to optimize B0 field homogeneity, DTI was performed after field map-based shimming using Bruker MAPSHIM protocol. Fat-suppressed DTI data were obtained using a four-shot segmented spin-echo echo planar imaging sequence with 30 diffusion gradient directions sampled on a half sphere (TR = 2,000 ms; TE= 31.35 ms; b-value = 1,000 s/mm2, five reference images with no diffusion gradients applied;
diffusion gradient’s duration and separation=4.3 and 10.5 ms, respectively, number of averages=2; 15 axial slices; FOV=30×
FIGURE 2 |Data processing of the DTI measurements. After pre-processing of the raw data, (1) brain extraction was made to calculate fractional anisotropy (FA), mean diffusivity (MD), first (L1), second (L2), and third (L3) eigenvalues and (2) to improve registration accuracy to a rat brain atlas (3), which was used for gray and white matter segmentation (4–5). Finally, FA, MD, radial diffusivity (RD), and axial diffusivity (AD) were calculated, and statistical analyses were made in 18 bilateral brain areas (6).
30 mm2; matrix=240×240; slice thickness=1 mm; interslice gap=0.2 mm).
Data Analysis of the MR Imaging
Preprocessing
After careful inspection of the acquired MR data, a few animals had to be excluded due to considerable motion artifacts. In total, 27 rats (n= 13 stressed andn = 14 controls) were used for diffusion analysis and 26 animals (n=12 stressed andn=14 controls) were involved in MR volumetry.
In order to analyze volumetric and diffusion-related alterations, MRI data were first converted from Bruker format to NIfTI using a Python script. The voxel size of the images was scaled up individually by the factor of 10 to better approximate human dimensions. Then, to improve image registration and segmentation, Brain Extraction Tool provided by FMRIB Software Library (FSL) was applied on the raw MRI data to eliminate non-brain tissues including skull, skin, fat, muscles, and other surrounding tissues (Smith, 2002). Here, the fractional intensity threshold was set to 0.65 and the coordinates (in voxels) for center of initial brain surface sphere were individually chosen to further improve brain extraction. Skull stripping errors were manually corrected when it was necessary by FSLview.
The CUDA implementation of FSL eddy (eddy_cuda7.0) was used to correct diffusion data for susceptibility-induced distortions, eddy currents, and subject motion, and to perform positive and negative outlier detection and replacement for slices with average intensity at least two standard deviations lower than expected (Andersson and Sotiropoulos, 2016; Andersson et al., 2016). Using FMRIB’s diffusion toolbox (FDT v3.0, https://
fsl.fmrib.ox.ac.uk/fsl/fslwiki/FDT), DTIFIT was applied to fit a single tensor model at each voxel of the preprocessed diffusion- weighted data and to calculate maps of FA, MD, eigenvalues (L1,2,3), and eigenvectors (V1,2,3).
Diffusion Analysis
To evaluate diffusion alterations, 18 gray and white matter structures were segmented based on a brain-extracted three- dimensional DTI rat brain atlas (Rumple et al., 2013) using the following steps:
(1) Brain-extracted FA image was registered to atlas space (seven degrees-of-freedom linear fit) using FMRIB’s Linear Image Registration Tool (Jenkinson and Smith, 2001) and sinc interpolation.
(2) The inverse of the spatial transformation from diffusion space to atlas space was applied to align the 18 brain
FIGURE 3 |Processing pipeline of thein vivovolumetric analysis. After pre-processing of the raw data as a first step, brain extraction was made to improve registration accuracy to a rat brain atlas (2 and 3), which was used for gray and white matter segmentation. Finally, volumetric analysis was performed on manually corrected brain areas using FSLstats (4).
masks to native diffusion space, where diffusion analyses were performed.
The native space masks were eroded using a 2D kernel of 3×3× 1 voxels to avoid partial volume effects and to minimize possible impacts of misregistration. All segmentation outputs were visually inspected and corrected manually if necessary. Besides FA and MD, RD and AD were also calculated (using eigenvalues) and statistical analyses were performed for the following bilateral eroded gray and white matter regions of interest (ROIs):
hippocampus, amygdala, neocortex, corpus callosum, corpus callosum genu, anterior commissure, external and internal capsule, inferior colliculus, fornix, fimbria, substantia nigra, hypothalamus, basal ganglia, thalamus, and central gray. We also included the rest of forebrain and midbrain as ROIs. Major steps of diffusion data processing are depicted inFigure 2.
MR Volumetry
Volumetric analysis was performed in gray and white matter structures, where diffusion abnormalities were found (amygdala, corpus callosum, anterior commissure, external capsule, inferior colliculus, basal ganglia, and thalamus). For MR volumetry, T2-weighted images were spatially registered into a rat brain
DTI atlas (Rumple et al., 2013) space using seven degrees- of-freedom linear image registration. Then, the inverse of the transformation from T2 space to atlas space was applied to align the segmented brain masks to T2 space, where volumetric analyses were performed. After that, all segmentation outputs were visually inspected and corrected manually if necessary and the volume of each segmented brain area was calculated by FSLstats, a part of the FSL. Details of MR volumetry can be seen inFigure 3.
Behavioral Assessment
Open Field Test
Locomotor activity was measured using the open field test (OFT) in theacutephase of the stress protocol (Week 1, seeFigure 1).
The OFT arena was a black-colored plywood box with a size of 57.5 × 57.5 cm (length × width) surrounded by 39.5 cm high walls. The floor of the arena was divided with light gray painted lines to four by four equal squares. The four squares in the middle of the arena, which were not bordered by walls, were considered together as the center area of the arena. The rats were allowed to explore the OFT arena for 5 min. After each session, the box was thoroughly cleaned using 20 v/v% ethanol.
The sessions were recorded using a high-speed video camera
(JVC super LoLux, JVC KENWOOD, Yokohama, Japan), and Ethovision XT10 software (Noldus, Wageningen, Netherlands).
During the sessions, the number of line crossings and center area entries of the rats were registered.
Novel Object Recognition Test
Recognition memory performance of the animals was tested in the novel object recognition test (NOR) in three occasions: once during the stress procedures and twice during therecoveryperiod (Figure 1). The same apparatus (box) was used in the NOR test as in the OFT with the same video tracking system. The NOR test consisted of two trials. In the 1st trial (acquisition), two identical objects were put in the arena, and the rats were allowed to explore them for 3 min. After either 30 min or 3 h retention time, a 2nd trial (recognition) was run with one object kept from the 1st trial (familiar object) and a novel object was introduced, which had never been seen by the animal before. Observation behavior of the animals in the second trial was recorded for 3 min. During the retention period, rats were not transferred back to the animal house but were kept in normal home cages in a dark room located next to the testing room. In both trials, time spent with the exploration of one and the other object was recorded. The animal was considered to explore a given object, when he sniffed the object or put his nose close to it while facing the object.
Three different object pairs were used. The object pairs were distributed randomly between animals and experimental sessions in a counterbalanced latin-square design. In theacutestress phase and shortly after the end of the stress protocol (Week 2 and 4, respectively, see Figure 1), the NOR test was run with 30 min retention time between the two trials, while in the stressrecovery phase (Week 5), 3 h retention time was used.
In the 1st and the 2nd trials of each NOR test session, overall exploratory activity (SumE1and SumE2, respectively) was measured by summing the exploration times for the two objects.
In the 2nd trial, the time spent with the exploration of the novel (En) and the familiar (Ef) objects were compared by calculating a discrimination index (DI) using the following equation: DI
= (En −Ef)/(En +Ef). The DI was a positive number if the novel object was observed longer, while the DI was negative if the familiar object was observed longer, and the DI was around zero if the two objects were observed for an equally long time.
Furthermore, a habituation index (HI) was also calculated using the following equation: HI=(SumE1/2)−(E∗fSumE1/SumE2).
The habituation index indicated the extent of decrease in the interest toward the familiar object in the 2nd trial of the NOR test. Only those rats were included in the statistical analysis, who observed both objects and observed them together for at least 5 s in the 2nd trial.
Elevated Plus Maze Test
Anxiety-like behavior was tested in the conventional elevated plus maze test (EPM) on the last day of the stress protocol (Week 3, seeFigure 1). The EPM apparatus consisted of a central square (11.5×11.5 cm) and of four orthogonally situated and equally long arms (45 cm long and 11.5 cm wide) forming a symmetrical plus shape. Two arms had no walls (open arms) and two were
enclosed by walls 37 cm in height. The maze stood on an about 100 cm high stand. Rats were placed in the center of the plus maze (i.e., where the four arms met), and they were allowed to explore the maze for 5 min. Time spent in the open arms was recorded during the experiments to assess anxiety-like behavior of the rats.
Morris Water Maze Test
Short- and long-term spatial memory of the rats was tested in the Morris water maze apparatus (MWM) 7 weeks after the end of the stress protocol (Week 10 on Figure 1). For the MWM test, we used a blue, circular pool, 180 cm in diameter and 90 cm in height (Ugo Basile, Gemonio, Italy). Four points around the circumference of the pool were designated as North, South, East, and West. On this basis, the area of the pool was divided into four virtual quadrants (NW, SW, SE, and NE). The maze was filled with room-temperature tap water up to the height of 30 cm, and the water was made opaque by mixing 200 g of milk powder and 30 ml of blue food coloring (E131) in it.
The rats were trained in the MWM for four consecutive days with one training session per day and four trials per session for each animal on each day. On each trial, a hidden platform was placed in the center of one of the pool quadrants. In each trial, rats were put in the water and were allowed to search for the hidden platform for 120 s. The swimming time elapsed until finding the platform (i.e., sitting on it) was measured as escape latency. If the platform was not found, rats were transferred to the platform and the cutoff time (120 s) was recorded as escape latency. Platform locations were randomly and equally assigned to rats and remained the same for a given rat in every trial on the same day. The quadrant from where the animal started swimming was changed clockwise in the four consecutive trials on a given day. Experiments were recorded using a Basler GenI acA1300 GigE camera (Basler AG, Ahrensburg, Germany). Data were processed onto a computer, where Ethovision X10 software (Noldus, Wageningen, Netherlands) was used for video image recording and data analysis. Short-term learning curves were established by analyzing changes in escape latency from trial to trial on the 1st day of training. Furthermore, escape latency in individual trials were averaged day by day (DayAVG), and long-term learning curves were established by analyzing changes in average escape latency from day to day in the 4-days-long training course.
Statistical Analysis
Data analyses were performed using IBM SPSS Statistics for Windows, Version 23.0 (IBM Corp., Armonk, NY, USA).
Before using statistical tests, the homogeneity of variance was inspected by Levene’s test, while the normality of data was assessed by Shapiro–Wilk statistics. Welch’s correction was applied for data demonstrating unequal variances. Prior to the analysis of variance, the data were tested for normality, outliers, and sphericity to ensure the assumptions of repeated measures test. The assumptions of mixed design ANOVA were satisfied, as judged by testing for normality, outliers, homogeneity of variances, and sphericity.
One-way repeated measures ANOVA was performed for each group and structure separately to compare changes in diffusion and volumetric metrics among the time points.
A mixed design ANOVA was used to determine whether any change in MRI metrics is the result of the interaction between the type of group (control vs. stressed) and time. Short- term and long-term learning curves of control and stressed animals were also compared using a mixed design ANOVA, where main effects of TRAINING trials/days (repeated measures) and STRESS (between-subject) and TRAINING × STRESS interaction were tested.
Differences between stressed and control groups were assessed in each time point with independent samplest-test (MRI metrics, EPM, DI, and HI in the NOR) or Mann–WhitneyU-test (OFT).
In the NOR test, normal recognition memory performance of a rat was assessed by comparing the difference between the time spent with the novel and with the familiar object using pairedt-test.
Finally, within-group correlations between MRI metrics and behavioral data were measured separately in the control and the stressed groups using Pearson’s or Kendall’s tests depending on the normality of the data. Behavioral data were analyzed in pairs with the corresponding (time-matched) MRI data. Thus, results of OFT and NOR-1 experiments were compared with theacute phase MRI data, results of EPM and NOR-2 experiments were compared with thechronicphase MRI data, and results of NOR- 3 and MWM experiments were compared with therecoveryphase MRI data.
Bonferroni correction was applied for one-way repeated measures and mixed design ANOVA to adjust for multiple comparisons. For one-way repeated measures ANOVA, a level of p<0.002 (p′=0.05/18≈0.002) was defined significant in case of DTI metrics, while it was setp<0.007 (p′=0.05/7≈0.007) in MR volumetry. Otherwise, results were considered significant atp≤0.05.
RESULTS
Stress-Induced Changes in White Matter Structures
As expected, the most pronounced stress-induced changes were observed in the white matter. Our MRI measurements revealed that stress significantly altered diffusion properties of the following white matter structures: corpus callosum (CC), external capsule (EC), and anterior commissure (AC).
Corpus Callosum
In control animals, the FA values significantly increased over time as the animals matured [F(3, 36)=11.897,p=0.000015], but this developmental change was hindered in the stressed rats [F(3, 36)= 4.331,p=0.010] (Figure 4A). MD values decreased significantly over time in controls [F(3, 39) = 9.866, p = 0.000057], and again this progressive change was not significant in the stressed group [F(3, 36)= 5.062,p= 0.005] (Figure 4B). RD showed a remarkable decrease over time in both the control [F(3, 39) = 18.126,p <0.0000001] and stressed animals [F(3, 36) = 7.181, p = 0.000672] (Figure 4C), while none of the groups showed
time-related AD change. Significant between-group differences were found in FA [F(1, 24) =4.584,p=0.043], MD [F(1, 25) = 8.382,p=0.008], and RD values [F(1, 25)=8.555,p=0.007]
without any group × time interaction. In the chronic stress period, FA values were significantly lower in stressed rats, but no differences were found in thebaseline,acute, orrecoveryphases (Table 1 and Figure 4A). In the recovery period, the MD and RD values were significantly higher in the stressed rats (Table 1 andFigures 4B,C). The volume of CC did not show any change (Table 1).
External Capsule
FA values increased significantly in a time-dependent manner both in control [F(3, 39) = 13.871,p= 0.000003] and stressed [F(3, 36)=8.831,p=0.000161] rats, without a significant group
×time interaction, while MD was decreased rapidly in control subjects only [F(3, 39 = 10.368,p= 0.000038] (Figures 4D,E).
Here, the between-group difference was significant for FA [F(1, 25)
=5.109,p=0.033], but not for MD [F(1, 25)=2.999,p=0.096].
In the recovery period, FA was significantly lower, and mean MD was higher in stressed rats (Table 1andFigures 4D,E). RD showed remarkable decrease over time both in control [F(3, 39)= 30.157,p<0.0000001] and in stressed animals [F(3, 36)=9.261,p
=0.000113] and we found a significant between-group difference [F(1, 25) = 9.127, p = 0.006] and a group × time interaction [F(3, 75)= 2.996,p =0.036] (Figure 4F). In thechronic stress period and in the recovery phase, RD was significantly higher in stressed rats compared to controls (Table 1and Figure 4F).
The volume of the EC increased significantly as the animals matured both in control [F(3, 39)=11.405,p=0.000017] and in stressed [F(3, 33)=15.108,p=0.000002] rats, and there was also a between-group difference [F(1, 24)=5.477,p=0.028] without group×time interaction probably due to the initial difference in thebaselinemeasurements (p=0.032). This difference remained constant over the time (Table 1).
Anterior Commissure
AD was significantly increased in the stressed rats [F(3, 33) = 12.085,p=0.000017] (Figure 4G), but remained constant in the control group. We found a group× time interaction [F(3, 69)
= 3.396, p = 0.023] without a between-group difference. In thebaselineperiod, AD was significantly higher in control rats compared to stressed animals, which most likely contributed to the group × time interaction (Table 1 and Figure 4G).
RD significantly decreased in controls [F(3, 39) = 13.655, p = 0.000003], but not in stressed rats (Figure 4H) and we found a significant between-group difference [F(1, 25)=4.800,p=0.038]
as well. In thechronicphase, the RD was significantly higher in stressed rats, while no differences were found in the baseline, acute, orrecovery phases (Table 1andFigure 4H). The volume of AC did not change.
Stress-Induced Changes in Gray Matter Structures
We could observe stress-induced microstructural alterations in a few gray matter areas as follows: amygdala, inferior colliculus (IC), thalamus, and the basal ganglia (BG).
FIGURE 4 |Stress-induced changes of DTI metrics in white matter structures. Longitudinal within- and between-group differences of DTI metrics in the corpus callosum(A–C), external capsule(D–F), and anterior commissure(G,H). Note that most values changed significantly over time as the animals matured. Data are means±SD. Asterisks indicate significant differences between the control and stress groups at the given time point. FA, Fractional anisotropy; MD, Mean diffusivity;
RD, Radial diffusivity; AD, Axial diffusivity.
TABLE 1 |Diffusion and volumetric data of white matter structures with between group differences at different time points.
MRI metrics Brain structure Group (n) Baseline p-value Acute stress p-value Chronic stress p-value Recovery p-value
FA CC Control (13) 0.50±0.05 ns 0.54±0.04 ns 0.57±0.03 0.04c 0.56±0.03 ns
Stress (13) 0.50±0.04 0.52±0.03 0.54±0.05 0.55±0.04
EC Control (14) 0.41±0.02 ns 0.43±0.02 ns 0.44±0.02 ns 0.45±0.02 0.007
Stress (13) 0.41±0.02 0.42±0.02 0.43±0.02 0.43±0.01
AC Control (14) 0.49±0.03 ns 0.51±0.03 ns 0.55±0.03 ns 0.53±0.03 ns
Stress (13) 0.48±0.03 0.50±0.03 0.52±0.04 0.53±0.03
MDa CC Control (14) 7.55±0.26 ns 7.39±0.21 ns 7.23±0.20 ns 7.18±0.16 0.011
Stress (13) 7.64±0.20 7.49±0.22 7.33±0.20 7.38±0.22
EC Control (14) 7.29±0.11 ns 7.28±0.11 ns 7.10±0.15 ns 7.13±0.09 0.024d
Stress (13) 7.31±0.14 7.29±0.12 7.19±0.13 7.27±0.19
AC Control (14) 7.16±0.21 ns 7.11±0.22 ns 6.97±0.18 ns 7.02±0.30 ns
Stress (10) 7.03±0.24 7.09±0.17 7.08±0.08 7.19±0.31
ADa CC Control (14) 12.18±0.72 ns 12.36±0.72 ns 12.36±0.54 ns 12.38±0.50 ns
Stress (13) 12.27±0.74 12.37±0.71 12.29±0.56 12.47±0.47
EC Control (14) 10.77±0.18 ns 10.95±0.30 ns 10.81±0.34 ns 10.95±0.20 ns
Stress (13) 10.75±0.30 10.88±0.30 10.81±0.32 10.99±0.28
AC Control (13) 11.69±0.37 0.003 11.66±0.43 ns 11.91±0.50 ns 11.90±0.62 ns
Stress (12) 11.18±0.42 11.63±0.49 12.11±0.61 12.10±0.58
RDa CC Control (14) 5.23±0.33 ns 4.91±0.20 ns 4.67±0.33 ns 4.58±0.14 0.019
Stress (13) 5.32±0.30 5.05±0.23 4.86±0.33 4.84±0.36
EC Control (14) 5.55±0.14 ns 5.44±0.10 ns 5.25±0.14 0.027 5.23±0.11 0.001
Stress (13) 5.58±0.12 5.50±0.10 5.37±0.13 5.42±0.16
AC Control (14) 4.94±0.23 ns 4.81±0.25 ns 4.46±0.20 0.004 4.57±0.27 ns
Stress (13) 4.95±0.26 4.87±0.18 4.79±0.33 4.69±0.30
Volumeb CC Control (14) 5.24±0.59 ns 5.25±0.51 ns 5.42±0.54 ns 5.62±0.42 ns
Stress (12) 5.18±0.57 5.30±0.65 5.79±0.64 5.79±0.69
EC Control (14) 50.88±5.12 0.032 53.76±4.55 0.032 55.34±6.67 0.062 55.83±5.30 0.032
Stress (12) 55.46±5.09 58.41±5.90 59.98±5.19 61.30±6.96
AC Control (14) 3.35±0.87 ns 3.07±0.86 ns 3.83±0.95 nsc 3.50±0.84 ns
Stress (11) 3.16±0.84 3.02±0.56 3.66±0.89 3.03±0.49
A few subjects were excluded from the analysis when assumptions like no significant outliers or normality were not met.
CC, corpus callosum; EC, external capsule; AC, anterior commissure.
aValues are expressed in units of×10−4mm2/s.
bValues are expressed in units of mm3without scaling.
cWelch-corrected p-values.
dWithout or with marginally significant between-group difference assessed by mixed design ANOVA.
Amygdala
Stress reduced MD and RD of the amygdala [F(3, 30)=6.076,p
=0.002 andF(3, 30)=5.999,p=0.002, respectively], but these values remained constant in control rats. We found no between- group differences or group× time interaction (Figures 5A,B).
The stress-induced decrease of AD was close to the level of significance [F(3, 30) = 4.703,p =0.008], while this value did not change in the controls (Figure 5C). We found no between- group differences or group × time interaction. Neither stress nor time affected FA or the volume of the amygdala (see data in theSupplementary Table S1).
Inferior Colliculus
As the animals developed, the FA values significantly increased in the control rats [F(3, 39) = 7.005,p = 0.0007], but did not
change in the stress group (Figure 5D). We found no between- group differences or group × time interaction. MD and RD values showed a nearly significant decrease in the stressed rats [F(1.52, 18.25) = 6.833, p = 0.010 and F(1.41, 16.86) = 7.376, p
= 0.009 both with Greenhouse–Geisser correction], while no change was found in the controls (Figures 5E,F). None of the groups showed significant time-related volume change in the IC; however, there was a between-group difference [F(1, 24) = 5.866,p = 0.023] without group× time interaction probably due to the initial difference at the baseline measurements (p=0.003) (Supplementary Table S1).
Thalamus
FA values tended to increase both in the control [F(3, 39)=4.198, p=0.011] and in the stress group over time [F(3, 36) =3.295, p = 0.031], but these changes could only approach the level
FIGURE 5 |Stress-induced changes of DTI metrics in gray matter areas I. Longitudinal within-group differences of DTI metrics in the amygdala(A–C)and inferior colliculus(D–F). Note that most values changed significantly as the animals matured. Data are means±SD. FA, Fractional anisotropy; MD, Mean diffusivity; RD, Radial diffusivity; AD, Axial diffusivity.
of significance (Figure 6A). A similar effect was found in MD, where a nearly significant decrease was observed in both the stressed [F(3, 36) = 3.321,p =0.030] and the control animals [F(3, 39) =4.504,p=0.008] (Figure 6B). AD of thalamus was
not altered in any way, but RD decreased significantly in control rats [F(3, 39)=7.782,p=0.0003] over time, while it was only close to the level of significance in the stressed animals [F(3, 36)
=4.575,p=0.008] (Figure 6C). The volume of the thalamus
FIGURE 6 |Stress-induced changes of DTI metrics in gray matter areas II. Longitudinal within- and between-group differences of DTI metrics in the thalamus(A–C) and basal ganglia(D,E). Note that most values changed significantly over time as the animals matured. Data are means±SD. Asterisk shows significant between-subject differences per time point. FA, Fractional anisotropy; MD, Mean diffusivity; RD, Radial diffusivity; AD, Axial diffusivity.
did not change and none of the MRI metrics showed any group
× time interactions or between group differences (see data inSupplementary Table S1).
Basal Ganglia
FA values gradually increased in both the stressed [F(3, 36) = 7.852,p=0.00037] and control [F(3, 39)=7.292,p=0.000537]
animals without any significant group × time interaction or between-group difference (Supplementary Table S1). MD did not change over time either in the control or in the stressed rats. AD was increased significantly in the stress group [F(3, 36)
= 7.866, p = 0.00036], but did not change in the controls (Figure 6D). Here, there was no significant group × time interaction and between-group difference. In contrast to that,
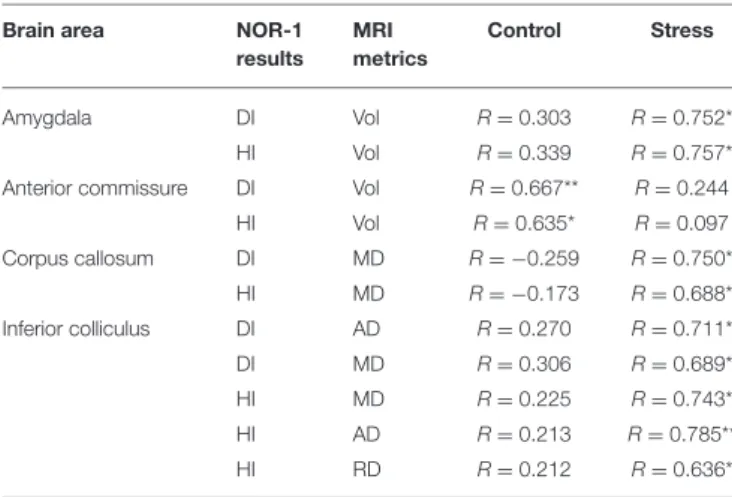
TABLE 2 |Correlations between MRI metrics and cognitive performance in the acutestress period.
Brain area NOR-1
results MRI metrics
Control Stress
Amygdala DI Vol R=0.303 R=0.752*
HI Vol R=0.339 R=0.757*
Anterior commissure DI Vol R=0.667** R=0.244
HI Vol R=0.635* R=0.097
Corpus callosum DI MD R= −0.259 R=0.750*
HI MD R= −0.173 R=0.688*
Inferior colliculus DI AD R=0.270 R=0.711*
DI MD R=0.306 R=0.689*
HI MD R=0.225 R=0.743*
HI AD R=0.213 R=0.785**
HI RD R=0.212 R=0.636*
NOR-1, novel object recognition test performed on the 10th day of the stress exposure; DI, discrimination index; HI, habituation index; AD, axial diffusivity; MD, mean diffusivity; RD, radial diffusivity; Vol, volume; R, Pearson’s correlation coefficient;*p<0.05;**p<0.01.
RD significantly decreased in controls [F(3, 39) = 7.292, p
= 0.000537], but did not change over time in the stressed rats (Figure 6E). For RD values, we found nearly significant between-group difference [F(1, 25)=3.339,p=0.080] without group × time interaction. In the recovery phase, the RD was higher in the stressed rats compared to the controls, while no alterations were found in the baseline, acute, or chronic phases (Supplementary Table S1 and Figure 6E). The volume of BG showed significant time-dependent increase in both the stressed [F(1,99,19,87) = 7.665, p = 0.003 with Greenhouse–
Geisser correction and control rats [F(3, 39)=4.898,p=0.0055]
without group×time interaction and between-group differences (Supplementary Table S1).
Behavioral Assessment
Stress exposure had no influence on the cognitive performance, anxiety-like behavior, or locomotor activity of the animals during theacuteandchronicstress periods. We performed an OFT and a NOR test at the end of the 1st week of the stress protocol (acute stressperiod,Figure 1), and an EPM test in the last day of the chronic stress procedures (chronic stressperiod,Figure 1).
None of these tests yielded any difference between the control and stressed rats (for details, please see theSupplementary Material).
Stress-induced behavioral differences emerged only in the recoveryperiod (Figure 1). In the NOR-3 test, we applied longer retention times—making the task more difficult for the animals—
which probably contributed to the higher sensitivity for detecting a cognitive impairment in the stressed rats. In Week 5, stressed animals (n = 15) showed no discrimination behavior in the NOR-3 test after a 3-h retention period (observation of novel vs.
familiar object: 9.8±1.3 vs. 6.6±0.9,t=1.895,p=0.078), while control animals (n=16) spent significantly more time with the exploration of the novel object (10.5±1.0 vs. 6.5±0.5 s,t = 3.270,p=0.006).
TABLE 3 |Correlations between MRI metrics and cognitive performance in the chronicstress period.
Brain area NOR-2
results MRI metrics
Control Stress
Amygdala DI Vol R= −0.186 R=0.665*
Anterior commissure HI FA R=0.079 R= −0.614*
HI RD R=0.063 R=0.603*
Inferior colliculus DI FA R= −0.172 R=0.666*
DI MD R=0.028 R=0.669*
DI AD R= −0.024 R=0.733*
HI AD R=0.160 R=0.649*
NOR-2, novel object recognition test performed few days after the end of the chronic stress exposure; DI, discrimination index; HI, habituation index; AD, axial diffusivity; FA, fractional anisotropy; MD, mean diffusivity; RD, radial diffusivity; Vol, volume; R, Pearson’s correlation coefficient;*p<0.05.
A similar difference was present between the control and stressed rats in the MWM, which was done 7 weeks after the end of the stress procedures. Stressed rats showed impaired short-term memory performance in the MWM as the mixed ANOVA indicated a significant main effect of STRESS on the escape latency on the 1st day of the training [F(1, 30)=10.144, p = 0.003; n = 16 for both groups]. Stressed animals could also learn the location of the platform during the 4 days of training; however, their escape latency was longer during the whole training procedure [main effect of STRESS:F(1, 30)=4.945, p=0.034].
Correlation Analysis Between the MRI Data and Behavioral Performance
While stress resulted only in mild cognitive impairments, we found that numerous parameters of the cognitive performance showed significant correlations with the DTI and volumetric data (seeTables 2–4).
Acute Stress Period
We found significant correlations between specific parameters of the MRI data and results of the NOR-1 and OFT. DI and HI of the NOR-1 test correlated with the volume of the amygdala in the stressed rats and with the volume of the AC in the control animals (Table 2). DI and HI values of the NOR-1 test correlated with MD in the CC of the stressed rats and with AD, MD, and RD values of the IC in the stressed rats (Table 2).
We also found significant correlations between specific parameters of the DTI data and results of the OFT. Entries to the center area correlated with FA (τ=0.486,p<0.05) and RD (τ=
−0.509,p<0.05) values of the AC in the control rats.
Chronic Stress Period
We found significant correlations between specific parameters of the MRI data and results of the NOR-2 and EPM tests. DI of the NOR-2 test correlated with the volume of the amygdala in the stressed rats (Table 3). In the AC, FA and RD values correlated with the HI of the NOR-2 test of the stressed animals (Table 3).
TABLE 4 |Correlations between MRI metrics and cognitive performance in therecoveryperiod.
Brain area Behavioral task Behavioral parameter MRI metrics Control Stress
Amygdala MWM Day2 escape latency MD τ=0.322 τ= −0.474*
MWM Day2 escape latency RD τ=0.429* τ= −0.500*
Anterior commissure NOR-3 HI FA τ=0.103 τ=0.487*
MWM Trial2 escape latency FA τ= −0.501* τ= −0.118
MWM Trial3 escape latency MD τ=0.478* τ= −0.295
MWM Trial3 escape latency AD τ=0.454* τ= −0.113
MWM Day1 escape latency AD τ=0.055 τ= −0.460*
Basal ganglia NOR-3 HI MD τ=0.431* τ= −0.051
MWM Trial4 escape latency Vol τ= −0.035 τ= −0.510*
MWM Day1 escape latency Vol τ=0.033 τ= −0.557*
MWM Day4 escape latency Vol τ=0.331 τ= −0.485*
MWM Day4 escape latency FA τ=0.486* τ=0.103
Corpus callosum MWM Trial2 escape latency FA τ= −0.426* τ= −0.024
MWM Trial3 escape latency FA τ= −0.408* τ=0.113
MWM Trial3 escape latency AD τ= −0.478* τ= −0.033
MWM Day3 escape latency MD τ=0.187 τ= −0.458*
MWM Day3 escape latency AD τ=0.275 τ= −0.452*
MWM Day4 escape latency AD τ= −0.022 τ= −0.555**
External capsule MWM Day1 escape latency Vol τ= −0.143 τ= −0.522*
MWM Day1 escape latency AD τ= −0.253 τ= −0.489*
MWM Day3 escape latency MD τ=0.416* τ= −0.231
Inferior colliculus MWM Trial4 escape latency FA τ=0.046 τ=0.496*
MWM Day1 escape latency FA τ=0.033 τ=0.633**
MWM Day4 escape latency FA τ= −0.398* τ= −0.077
Thalamus MWM Day1 escape latency RD τ=0.033 τ= −0.449*
MWM Day2 escape latency Vol τ= −0.099 τ= −0.688**
MWM Day4 escape latency AD τ=0.000 τ= −0.436*
NOR-3, novel object recognition test which was performed on the 2nd week of the recovery period; MWM, Morris water maze test, which was done on the 7th week of the recovery period; HI: habituation index; AD, axial diffusivity; FA, fractional anisotropy; MD, mean diffusivity; RD, radial diffusivity; Vol, volume; R, Pearson’s correlation coefficient;τ, Kendall’s tau coefficient.
*p<0.05;**p<0.01.
Furthermore, DI and HI values of the NOR-2 test correlated with AD, FA, and MD values in the IC of the stressed rats (Table 3).
Significant correlations between DTI data and behavior were found also in the EPM. In control rats, FA values of the AC correlated with the time spent in the open arms of the EPM (R
= −0.539,p<0.05).
Recovery Period
Surprisingly, most of the correlations between behavior and MRI data were found in therecoveryperiod (Table 4). In this phase, we did a NOR test 2 weeks after the end of the stress (NOR-3) and a MWM test 7 weeks after the end of the stress (Figure 1).
The HI of the NOR-3 test correlated with the FA value of the AC in stressed rats and with the MD value of the BG in the control animals (Table 4). Most of the correlations were found between the animal’s performance in the MWM and between the MRI data (for details, seeTable 4). In the amygdala, RD and MD values correlated with escape latencies of the control (RD,τ = 0.429,p<0.05) and stressed (MD,τ= −0.474,p<0.05; RD,τ
= −0.500,p<0.05) rats. In the anterior commissure, the AD, FA,
and MD values correlated with the cognitive performance of the control rats and with the AD value of the stressed rats (Table 4).
The volume of the BG in the stressed animals correlated with escape latencies, whereas in controls, the FA value correlated with the escape latency (Table 4). In the corpus callosum, the AD and FA values correlated with escape latencies of the control rats and AD and MD values correlated with escape latencies of the stressed rats (Table 4). In the EC, the volume and AD of the stressed rats correlated with escape latency, whereas in the controls, the MD correlated with escape latency (Table 4). In the inferior colliculus, FA values correlated with escape latencies of both the control and stressed rats (Table 4). In the thalamus, the volume as well as AD and RD values of the stressed rats correlated with their escape latencies (Table 4).
DISCUSSION Main Findings
Here, we report that chronic stress exposure results in pronounced microstructural changes in white matter structures