Introduction
Currently, the COVID-19 pandemic is a critical chal- lenge across the globe. Prior to vaccines becoming available, the world has been in crisis due to the lack of a definitive medicine or a method to cure the disease. In this situation, one contentious recommended method has been to maintain a good nutritional status to fight against the virus. “Immune boosting” is also a trending topic correlated with the COVID-19 pandemic, appearing alongside numerous specu- lative cures, treatments, and preventative strategies. Also, there is no current evidence that any product or practice will provide enhanced “immune-boosting” protection against COVID-19. However, the public health experts continue to advise that the individual’s immune system will need to adapt unaided to COVID-19 as it is the body’s multi-level defence network against potentially harmful bacteria, viruses, and other organisms (Coelho-Ravagnani et al., 2021). Hence, this COVID-19 pandemic has indirectly turned the world’s attention towards boosting the immune system as a defen- sive force against disease-causing bacteria, viruses, and other organisms (Ferrarezi et al., 2013).
The nutritional status of individuals has been sug- gested as a possible bulwark, capable of destabilising the COVID-19 pandemic. As many doctors have pointed out, vitamin C possesses antioxidants and other properties that protect the cells from substances that damage the body (Aman and Masood, 2020). A deficiency of vitamin C can lead to delayed wound healing, an inability to properly fight infections and an impaired immune response. Fortunately, orange juice and citrus juice contains more than enough of the recommended daily intake of vitamin C. Orange juice is the most consumed fruit juice world-wide and in India is no exception to this trend. It is obtained from the endocarp of the Mandarin orange (Citrus reticulate) fruit.
The mandarin orange is most common among citrus fruits grown in India. It occupies nearly 43 percent of the total area under citrus cultivation in India (2017-18). The area under orange cultivation in India has increased drastically from 0.12 million hectares in 1991-92 to 1 million hectares in 2017-18 and the production rose from 0.11 to 1.26 million tonnes (MA, 2018). Oranges are predominantly produced in the States of Andhra Pradesh, Maharashtra, Madhya Pradesh, Telangana, Tamil Nadu, and Punjab. Andhra Pradesh leads other states, accounting for 45 of India’s orange cultiva- tion and 61 percent of orange juice production (MA, 2018).
Several varieties of oranges are cultivated in India to make orange juice. The orange juice contains substantial amounts of several micronutrients such as vitamin C, folate and poly- phenols (e.g. hesperidin, which is a flavanone) and may con- tribute significantly to boosting the immune system.
With an increasing number of COVID-19 positive cases both in India in general and in Andhra Pradesh in particu- lar, the demand for consumption of orange juice is on the rise. Currently, the unforeseen and significant increase in the demand for orange juice has exceeded the available supply in the Indian market. This spike in orange juice consump- tion can be attributed to consumers seeking out immunity- boosting food and drinks, like vitamin C-rich citrus, during the pandemic. Differences in social status, culture, environ- mental influences, purchasing power, motivation, and life- style give rise to different consumer behaviour in relation to orange juice consumption. These conditions simultaneously create opportunities for producers and processors to market a wide variety of orange juices with different attributes like flavour, brand, taste, pulp, and price, according to the needs and desires of consumers as well as the market segments tar- geted by traders. The consumption of orange juice has been the focus of increased public attention in times of COVID-19 due to its perceived capacity to boost the immune system.
K. Nirmal Ravi KUMAR* and Suresh Chandra BABU**
An analysis of consumers’ preferences for orange juice in India during COVID-19
Boosting the immune system’s response through better nutrition has been suggested as a coping strategy to help fight COVID- 19. Among other food products, orange juice, a rich source of Vitamin C, has been in huge demand in India since the outbreak of COVID-19. Panic buying has further added to this increased demand for orange juice. Using data collected through online surveys, this paper applies both conjoint and market simulation analysis to study consumers’ preferences when purchasing orange juice. Nine important product attributes (flavour, preservatives, sweetener, brand, taste, pulp concentration, container, production method of orange and price) as well as different levels for each attribute are considered for the analysis. Among the selected attributes, relatively respondents gave more importance to the ‘method of production’ of orange, followed by
‘brand’, ‘pulp concentration’, ‘sweeteners’, and ‘preservatives.’ The market simulation analysis showed that a new product with the desired levels (high mean utility values) across the selected attributes would stand to enjoy a market share of around 32 percent. These findings support product differentiation as a strategy by firms in the food processing sector under conditions of intense competition.
Keywords: COVID-19, nutrition, orange juice, consumer preference, conjoint analysis, market simulation JEL classifications: M21, M31, M37
* National Institute of Agricultural Extension Management (MANAGE), Ministry of Agriculture & Farmers’ Welfare, Government of India, Rajendranagar, Hyderabad-500030, India. Corresponding author: drknrk@gmail.com
** Senior Research Fellow and Head of Capacity Strengthening, International Food Policy Research Institute, 1201 Eye Street, NW Washington, DC 20005, USA.
Received: 4 May 2021; Revised: 23 June 2021; Accepted: 25 June 2021.
Thus, it is vitally important to analyse consumers’ prefer- ences for different attributes and concentrations of orange juice, as well as to highlight how orange juice can be pro- moted in respect of the product attributes that matter most to consumers. Consequently, conjoint analysis and market simulation analysis have been employed in this study with a view to sustaining the marketability of new products.
Review of literature
Many studies have been conducted on consumer prefer- ence for food products; here, an attempt has been made to pre- sent a critical review of the literature relating to orange juice.
Ferrarezi et al. (2013) analysed the impact of label informa- tion on the consumer intent to purchase ready-to-drink orange juice and nectar by applying conjoint analysis to data from Brazil. A convenience sample of 149 consumers and a facto- rial design featuring four characteristics, price, brand, infor- mation about the product and kind of beverage, were used.
Three levels were established for brand and product informa- tion, and two for price and kind of beverage. Findings of the study revealed that low price, product information and the market leading brand had a positive impact on buying inten- tions. ‘No preservatives/natural’ was the information that most influenced consumer’s purchase intent. The authors also sug- gested that these results could be useful for the strategic plan- ning of consumer education and might also have important implications for Brazilian orange juice manufactures.
Sriratana and Limsombunchai (2010) analysed the fac- tors influencing the pure orange juice purchasing decisions of consumers in the Bangkok Metropolitan area by employ- ing both descriptive analysis techniques and conjoint analy- sis. Their survey, which was conducted among 400 sample consumers, revealed that being able to see a certificate of standard and quality assurance was the most important fac- tor influencing the pure orange juice purchasing decisions of consumers, followed afterwards by nutrition and price factors, respectively. Types of oranges and packaging were found to be relatively insignificant factors by comparison.
Luckow and Delahunty (2004) analysed the consumer acceptance of orange juice containing functional ingredients, performing a descriptive sensory analysis on four functional orange juices and seven conventional orange juices. The survey conducted on 100 consumers revealed that they gen- erally preferred the sensory characteristics of conventional juices. The study also revealed the existence of a small con- sumer segment (11%) that significantly preferred the sen- sory attributes of functional juices. Annunziata and Vecchio (2013) applied conjoint analysis to explore consumers’ eval- uation of four attributes of probiotic functional foods: base product (yoghurt, orange juice and biscuits), health claim (generic, psychological and prevention), price (high, regular and low) and brand (familiar and unfamiliar). Their analysis revealed that consumers considered the base product as the most important attribute in selecting a probiotic functional food, followed afterwards by the prevention claim. Further, customer groups differ significantly in their evaluation of the perceived healthiness of functional foods and in the impor- tance that they attach to price and brand.
Windhita et al. (2017) analysed the quality attributes and factors that influence consumers’ preferences for local oranges and imported oranges in Indonesia. Conjoint analy- sis revealed that the taste of local oranges is the most impor- tant attribute, followed by colour and size; meanwhile, for imported oranges colour and size are the major attributes. In terms of flavour, local oranges were considered superior to imported oranges. However, where colour and size attributes were concerned, imported oranges were viewed as being superior to local oranges. Consequently, the researchers concluded that consumers prefer local oranges to imported oranges on account of their flavour and taste.
Methodology
Food choice and consumption are complex phenomena, influenced by various psychological and sensory-categorical factors associated with marketing. The initial product evalu- ation and satisfaction after use are the factors that consumers generally consider when selecting a food product. The qual- ity of the product, which can be considered to be an impor- tant factor in this context, can be perceived in various forms such as flavour, preservatives, sweeteners, taste and so on (intrinsic cues). When it is difficult to assess a product from its intrinsic cues, consumers often rely on extrinsic cues such as price, brand name, container, or method of production to infer the quality of the product indirectly (Sethuraman and Cole, 1999; DelVecchio, 2001). The qualities or attributes can contribute to a market-oriented approach in developing new products since it is a broad concept and is well recog- nised in terms of marketing and consumer behaviour (Ophuis and van Trijp, 1995).
Literature research and in-depth interviews with sec- tor experts were carried out to determine the definitions of important orange juice attributes to be included in this study.
Research attributes and attribute levels were limited based on the information obtained and accordingly, nine attributes and 27 levels (3 levels/attribute) were identified to study their effects on the purchase of orange juice for conjoint measure- ment (Table 1). Conjoint analysis has been widely used to assess the consumer’s preference for and purchase intention towards various food products (see e.g. Asioli et al., 2014;
Ferrarezi et al., 2013; Mann et al., 2012; Ares et al., 2008;
Haddad et al., 2007; Helgesen et al., 1998; Gil and Sanchez, 1997). It is a multivariate technique that models the purchase decision-making process by analysing consumer trade-offs among hypothetical multi-attribute products. Thus, in a con- joint analysis, a product can be described as a combination of a set of attribute levels, where a utility is estimated for each level to quantify the value that an individual gives it. The utility values contributed by each attribute level determine purchasers’ total utility or overall judgment of a product (Green and Srinivasan, 1978). Consequently, in this study, the conjoint analysis was deemed appropriate to measure the consumers’ preferences of orange juice. This research was intended to describe and analyse the consumers’ socio- economic profile, consumers’ preferences for the combination of desirable orange juice attributes as well as to provide a market simulation analysis for introducing a new product
with the desired levels of attributes based on the higher aver- age utility values. A discrete conjoint model was selected for this study, and no assumptions were made regarding the rela- tionships between attributes and product scores.
The research was conducted in East Godavari, West Godavari, Chittoor, Guntur and Ananthapuramu districts of Andhra Pradesh purposively as the number of COVID-19 cases had begun to increase alarmingly in these districts since March 2020. The sample required to collect the requisite data was drawn in accordance with the formula proposed by Yamane (1967):
(1)
Accordingly, 500 sample respondents (100 respondents from each district) were selected through the convenience sampling method (in view of COVID-19 pandemic) for getting the requisite data. The respondents visiting ‘more’
supermarkets in each district to purchase orange juice (on the dates of data collection) were interviewed with the help of a pre-tested schedule. The selected respondents were the end consumers who decided to buy orange juice. They were found in a condition of preferring to buy orange juice to boost their immunity against COVID-19.
The primary data considered in this study were collected from sample respondents through online questionnaires.
The first online questionnaire was employed to identify the attributes and attribute levels desired by respondents.
The next questionnaire involved choosing a combination of attributes from the popular attributes (Table 1) selected in
the first questionnaire. Therefore, by employing the orthogo- nal procedure, 20 combinations (profiles) of attributes and levels were obtained. This methodology was followed because although a full factorial design (39= 19683 profiles) in conjoint analysis would provide all the effects that can be obtained from the parameters corresponding to the main effects, such a huge amount of information might overload the interviewee or cause them to lose interest, adversely affecting the quality of their answers.
For this reason, researchers often use fractional factorial designs that are less than full factorial designs (Wehmeyer and Lankenau, 2005). To help obtain reliable data, two basic principles of orthogonality and equilibrium have been applied. By employing the orthogonal design, participants’
fatigue can be reduced to a minimum; thereby, 19683 combi- nations are reduced to 20. The rule of thumb is the minimum number of choice sets should be equal to [(1 + Total number of attribute levels) – Number of attributes] = [(1 + 27) – 9] = 19. With the orthogonal design, the number of combinations of attributes and attribute levels is simplified to 20 (Appen- dix 1) to make it easier for the consumers to describe their orange juice preferences. The resultant combinations were again offered back to the respondents by means of the sec- ond online questionnaire, whose purpose was to measure the likelihood of buying orange juice. The respondent’s task was to assess product attributes on a twenty-point scale, where 1 is “would definitely not purchase” and 20 is “would defi- nitely purchase”. Consumer appraisal (intention to buy) rep- resents the dependent variable and attribute levels represent independent variables in conjoint analysis.
Utility is a conceptual basis for measuring value in a conjoint analysis, which is an assessment of subjective pref- erences that are unique for each respondent. The conjoint analysis’s main output is a series of utility values for each level of the attributes considered above. Each attribute that enjoys higher utility value will have a higher preference and a higher chance of being selected and vice versa. The predicted preference for each level of selected attributes of orange juice would be obtained from the merging of these utilities across the respondents. This is given by:
(2) where the independent variables on the RHS are the attributes of orange juice. These independent variables are non-metric (ranked) data for different profiles of the orange juice, con- sidering different levels across the selected attributes. While the dependent variable, Y is the overall or total utility pref- erence of the respondent to different levels across different attributes. This dependent variable also includes consumer ratings of the importance of levels across the attributes of a product. Thus, in this study,
Total utility = Utility X1 (attribute level 1 to i) + + Utility X2 (attribute level 2 to i) + + Utility X3 (attribute level 3 to i) + + Utility X4 (attribute level 4 to i) + + Utility X5 (attribute level 5 to i) + + Utility X6 (attribute level 6 to i) + + Utility X7 (attribute level 7 to i) + Table 1: Attributes and levels used in conjoint analysis.
Attributes Levels
Flavour • Similar to fresh orange
• Stronger than fresh orange
• Weaker than fresh orange Preservatives
• Sodium Benzoate (SB) or Potassium Sorbate (PS), or Citric Acid (CA) in 500 PPM
• SB or PS or CA in 750 PPM
• SB or PS or CA in 1000 PPM Sweeteners • Low calories, Natural sweetener
• No calories, Artificial sweetener
• High calories, Sugar/Honey
Brand • B Natural
• Patanjali
• Tropicana
Taste • More sour than sweet
• More sweet than sour
• Balanced sweet and sour
Pulp • More pulp
• Medium pulp
• No pulp
Container • Plastic Bottle with screw cap
• Plastic Pouch with screw cap
• Paper Pouch with Straw Method of Production
of Orange
• Fully Organic
• Conventional use of PPC
• Reduced use of PPC Price (Rs/litre) • >100
• 75-100
• <75 Source: Own composition
+ Utility X8 (attribute level 8 to i) +
+ Utility X9 (attribute level 9 to i) + Constant where, Y = total utility, X1 to X9 = Predicted utility values of (nine) selected attributes and Constant = the constant value in the analysis. The mean utility values across all the selected profiles serve as the analysis summary. They are used to derive the importance and relative importance of an attribute. Attribute importance is the difference between the highest and lowest utility levels of the attribute. The relative importance of an attribute is essentially its share of impor- tance. If the distance between the utility levels of an attribute is large (i.e. the difference between highest and lowest utility levels of the attribute), then that attribute will have a larger bearing on the respondents’ choice of product than another attribute, where the distance is not as large. The distance, therefore, reflects the importance of the attribute in deter- mining consumer preferences.
As this study aims at concerning the consumers’ prefer- ences for different levels across selected attributes of orange juice consumption in selected districts of Andhra Pradesh, it will provide a clear picture for designing an effective mar- keting strategy for this product in tune with the consumers’
preferences. The knowledge about various attributes’ rela- tive importance can help analyse marketing simulation (and even advertising decisions). Thus, a market simulation anal- ysis is also carried out to make it possible for firms to direct attention and resources for improving the product towards the attributes and desired attribute levels that are of greatest importance to target consumers.
Results
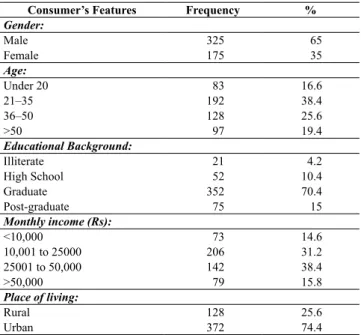
Table 2 summarises the respondents’ demographic pro- file. Out of the total sample, 65 percent are male, and the remaining 35 percent are female. Around 38 percent of the
participants are of ages 21 – 35 years, 26 percent are of ages 36 – 50 and about 20 percent are aged over 50 years. Most of the participants are educated to at least graduate level (85%), and only four percent of the selected respondents are illiterate. Around 54 percent of the respondents are engaged in the service industry, and they enjoy a monthly income in excess of Rs. 25000 (appr. $330). It seems that the tendency to consume orange juice remained biased towards this higher income group. A further classification was also made in to consider the effect of residential locality on orange juice consumption. It was noticed that almost three quarters of the sample respondents (74%) were urban consumers. Thus, in contrast to consumers from rural areas, urban consumers were well represented in this study.
Table 2: Socio-economic profile of orange juice preferring selected respondents (n = 500).
Consumer’s Features Frequency %
Gender:
Male 325 65
Female 175 35
Age:Under 20 83 16.6
21–35 192 38.4
36–50 128 25.6
>50 97 19.4
Educational Background:
Illiterate 21 4.2
High School 52 10.4
Graduate 352 70.4
Post-graduate 75 15
Monthly income (Rs):
<10,000 73 14.6
10,001 to 25000 206 31.2
25001 to 50,000 142 38.4
>50,000 79 15.8
Place of living:
Rural 128 25.6
Urban 372 74.4
Source: Own composition
Table 3: Utility value of each attribute level (consumers in general).
Attributes Levels Mean
Utilities SE Flavour Similar to Fresh Orange 0.061** 0.025
Stronger than fresh
orange 0.024 0.100
Weaker than fresh
orange -0.085* 0.101
Preservatives SB or PS or CA in 1000
PPM -0.147* 0.101
SB or PS or CA in 500
PPM 0.064 0.092
SB or PS or CA in 750
PPM 0.083** 0.094
Sweeteners High calories, Sugar/
Honey -0.137* 0.086
Low calories, Natural
sweetener 0.125** 0.095
No calories, Artificial
sweetener 0.012 0.103
Brand B Natural -0.162* 0.098
Patanjali 0.172** 0.089
Tropicana -0.01 0.097
Taste Balanced sweet and sour 0.094** 0.095 More sour than sweet -0.097* 0.098 More sweet than sour 0.003 0.095
Pulp Medium pulp 0.147** 0.100
More Pulp 0.032 0.100
No pulp -0.179* 0.101
Container Plastic bottle with screw
cap -0.024* 0.105
Plastic pouch with
screw cap -0.02 0.092
Paper pouch with straw 0.044** 0.099 Method of Production
of Orange Conventional use of
PPC -0.007 0.091
Fully Organic 0.184** 0.088
Reduced use of PPC -0.177* 0.100
Price (Rs/litre) <75 0.017 0.105
>100 -0.052* 0.095
75-100 0.035** 0.108
Constant 10.508 0.025
** The highest utility values represent more value from the consumer’s perspective.
* The lowest utility values represent less value from the consumer’s perspective.
Source: Own composition
Where utility estimates are concerned, the greatest posi- tive value from the consumer’s preferences indicates the most preferred attribute level by the consumer, whereas the smallest negative value indicates the least favourable attrib- ute level by the consumer. Meanwhile, the total value of util- ity with the largest positive value shows the most preferred combination of attributes.
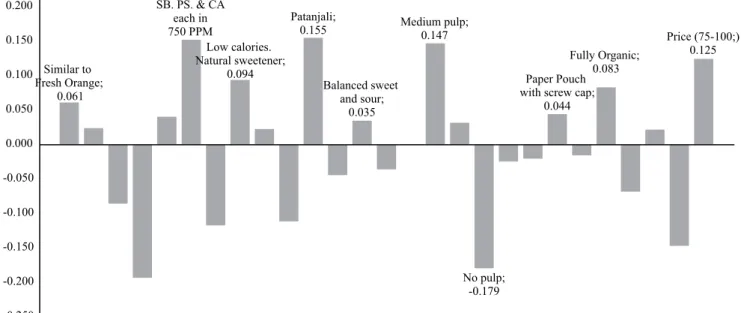
From Table 3 and Figure 1 shows that in general, the most preferred attribute level is ‘fully organic’ (0.184) from the ‘method of production of orange’ attribute, and the least favoured level is ‘no pulp’ (-0.179) which is in the ‘pulp’
attribute. The ‘fully organic’ level concerning the ‘method of production’ of orange attribute recorded the highest (positive) utility value whereas by contrast, the remaining two levels
‘conventional use of PPC’ and ‘reduced use of PPC’ recorded negative utility values of -0.007 and -0.177, respectively.
For ‘brand’, the consumers preferred ‘Patanjali’ (0.172), while the least popular one is ‘B Natural’ with a utility value of -0.162. The consumers preferred the Patanjali brand because of the strong perception that the product is ‘organic’
(close to the nature); that is, ‘pesticides/chemical-free’ and
‘without adulteration’. Further, in view of the ongoing slow- down of the Indian economy amid the COVID-19 crisis, consumers now prefer Swadeshi products as they wish to revive it. This company has limited advertising expenses (only through regional newspapers, some digital advertis- ing, etc.) and consequently, offer a quality product at lower prices. The firm is also offering this product through its web- site where the customers can order it and can take advantage of free delivery if the order value exceeds Rs. 499 (around
$7). Interestingly, other companies that also sell orange juice online do not offer such discounts.
For the ‘pulp’ attribute, the ‘medium pulp’ level is pre- ferred to ‘no pulp’ by the consumers with the highest utility value of 0.147. For the attribute, ‘sweeteners’, the consumers preferred ‘low calories, natural sweetener’ with the highest utility value of 0.125 against ‘high calories, sugar/honey’.
Reasons for this include increasing concerns surrounding health and nutrition, enhance palatability, high stability in food and a significant expansion in sucralose availability in India since 2002 (Allison and Kristina, 2016).
For ‘taste’ and ‘preservatives’ attributes, the consum- ers preferred ‘balanced sweet and sour (0.094)’ and ‘SB, PS and CA each in 750 PPM (0.083)’ levels, respectively.
The survey highlighted that the consumers blame carbo- hydrates, and specifically sugar, for weight gain. This is because (artificial) sugars continue to be the most cited cause of weight gain. Hence, they preferred natural sweet- eners in the orange juice, but not at the expense of the great taste of ‘balanced sugar and sour’ in the orange juice, as taste is, and will remain, one of the biggest drivers of pur- chase intent. Nowadays, the preservation of fruit juice has become a business activity of great significance, especially in COVID-19. This is because the demand for orange juice is currently rising sharply and outstrips its supply, mean- ing that if producers wish to make the product available to the consumers even during the off-season without suf- fering from microbial spoilage during storage, the use of preservative chemicals is inevitable. However, though the consumers are largely uninformed about the selected pre- servatives’ chemical properties, they prefer to have them in medium concentration in the orange juice.
Even among the different levels of flavour attribute, the consumers preferred ‘similar to fresh orange’ with the highest utility value of 0.061 compared to the other two levels, stronger than ‘fresh orange’ and ‘weaker than fresh orange’. This implies that they prefer natural flavours and are against adding artificial (non-natural) ingredients in the orange juice. It is also interesting to observe that the con- sumers showed interest in paper pouch containers (with a utility value of 0.044) instead of plastic pouch containers for orange juice given environmental health and safety fac- tors. Further, this paper pouch (aseptic package) provides excellent protection for the ready to serve fruit juices. They
Similar to Fresh Orange;
0.061
SB. PS. & CA each in 750 PPM
Low calories.
Natural sweetener;
0.094
Patanjali;
0.155 Medium pulp;
0.147
No pulp;
-0.179
Paper Pouch with screw cap;
0.044
Fully Organic;
0.083
Price (75-100;) 0.125 Balanced sweet
and sour;
0.035
-0.250 -0.200 -0.150 -0.100 -0.050 0.000 0.050 0.100 0.150 0.200
Figure 1: Mean utility values of each attribute level.
Source: Own composition
are made by combining thermoplastic with paperboard and aluminium foil. Their multi-layered construction ena- bles the carton to protect the contents from various fac- tors responsible for spoilage. The aluminium foil layer is a strong barrier for O2 and light. The inner plastic layer made of polyethylene makes it possible to seal through the liquid.
The outer paper layer provides stiffness making it possible for the cartons in a brick shape, thus, enabling maximum utilisation of available storage and transportation space.
Excellent graphics may also lead to good display and shelf appeal and may also permit the printing of technical ingre- dient details on the container.
It is important to note that because of inelastic demand for the orange juice during the post-COVID regime, the levels of the ‘price’ attribute recorded very low utility values. Though the ‘price’ of the product is a crucial topic in marketing literature, it seems that this attribute has lim- ited importance in the orange juice purchasing decision, especially during the post-COVID regime, given the per- sistent increase in demand for this product market. Even the reputed online stores are displaying non-availability of orange juice on their respective websites due to a sharp increase in demand. Interestingly, from a marketing per- spective, the orange juice with less fresh orange flavour, very high level (1000 PPM) of preservatives, higher doses of sweeteners (honey), plastic containers, the total absence of pulp, reduced use of PPCs in the method of production of the orange and higher market price are negatively per- ceived by the consumers. Thus, personal health benefits and the opportunity to purchase a brand (Swadeshi) that manufactures orange juice from organically produced oranges are given more weight and assigned higher utility values by consumers.
The above findings are quite different to the results of ear- lier studies conducted by Luckow and Delahunty (2004) and Anisa et al. (2017), as the current study indicates consum- ers’ preferences for orange juice in the light of COVID-19 pandemic. It has been shown that, in the Indian context during the pandemic, consumers are exhibiting increased quality consciousness focusing first on the ‘method of production of the produce’ (organic production) followed afterwards by the ‘Brand’ producing the orange juice (close to the nature), and the presence of medium fruit pulp, with low calories and natural sweeteners. Consequently, the attributes relevant to the health consciousness of the con- sumers outweighed other attributes like flavour, preserva- tives, price, taste and shape of the container. However, the present findings are in tune with the study conducted by Ferrarezi et al. (2013), where the consumers (selected through Convenience sampling method) preferred ‘natural’
product of orange juice.
It therefore becomes apparent that the choice of attribute levels has a critical bearing on perceived attribute impor- tance, and this highlights why both the highest and the low- est prevalent levels should preferably be included in the research design to get unbiased estimates of the importance of attributes. If the range of levels within an attribute is stretched beyond the market’s prevailing levels, its impor- tance will be inflated. Since it may not always be desir- able or feasible to cover a realistic range of levels within
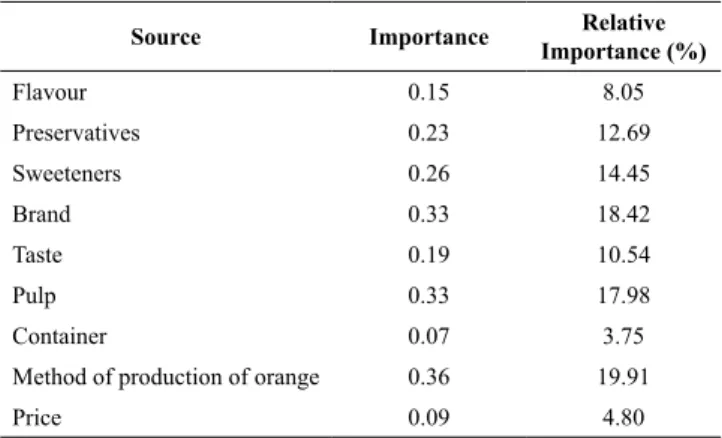
attributes, the correct interpretation should be in terms of the relative importance of the selected attributes. The find- ings are shown in Table 4.
It was observed that for the average consumer, given the attribute properties tested in terms of relative importance,
‘method of production’ has the strongest influence with 19.91 per cent on the decision-making, followed by brand, pulp, sweeteners, taste, preservatives, flavour, container, and price. This shows that consumers are aware of the ben- efits of organic food that contribute to better health through reduced pesticide residues and increased nutritional qual- ity. Accordingly, the consumers considered ‘Brand’ as the next important attribute for the firm that market orange juice manufactured from organically produced oranges.
The other attributes like pulp, sweetener, preservatives, taste, flavour, price, and container are followed in the order of preference. Contrary to the expectations, ‘price’
was accorded less priority in choosing the product, as the respondents’ health consciousness outweighed the expendi- ture incurred on it implying that there is inelastic demand for the product in the market in view of the COVID-19 pan- demic. This knowledge concerning the relative importance among various attributes as perceived by the consumers can assist the firms in planning marketing and advertising decisions of the product. Consequently, other factors being equal, one would devote greater attention and resources to improving a product in respect of attributes that are of greatest importance to target consumers.
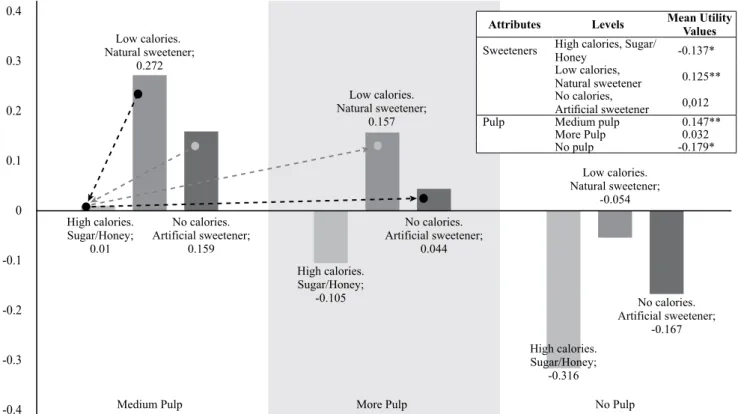
Product developers are always faced with trade-offs. For instance, using lesser sugar and honey in the orange juice would result in a decline in its price. Whether this could increase demand for the product in the market could be gauged by examining the trade-offs that consumers are will- ing to make.
Figure 2 illustrates trade-off analysis across the two attributes, pulp, and sweeteners. Assume the firm that cur- rently produces orange juice with medium pulp and sweet- eners comprising high calories, sugar/honey is considering switching to medium pulp with low calories, natural sweet- eners, or going for more pulp with no calories, artificial sweeteners. The utility improves by + 0.262 (= 0.272 – 0.01) if the firm maintains medium pulp but switches to low calo- ries and natural sweeteners. Likewise, the utility improves by + 0.034 (= 0.044 – 0.01) if the firm uses more pulp along
Table 4: Relative Importance among selected attributes.
Source Importance Relative
Importance (%)
Flavour 0.15 8.05
Preservatives 0.23 12.69
Sweeteners 0.26 14.45
Brand 0.33 18.42
Taste 0.19 10.54
Pulp 0.33 17.98
Container 0.07 3.75
Method of production of orange 0.36 19.91
Price 0.09 4.80
Source: Own composition
with no calories and artificial sweeteners in the orange juice.
Comparing these, the firm can deduce that an average con- sumer will prefer the increase in natural sweeteners in the orange juice over the increase in pulp quantity.
Similarly, assume the firm currently produces orange juice with medium pulp and sweeteners comprising high calories, sugar/honey is considering whether to retain with medium pulp, but with no calories, artificial sweeteners, or going for more pulp with low calories, natural sweeteners.
The utility improves by + 0.149 (= 0.159 – 0.01) if the firm maintains medium pulp but with no calories, artificial sweet- eners. Likewise, the utility improves by + 0.147 (= 0.157 – 0.01) if the firm uses more pulp with low calories, natural sweeteners in the orange juice. Comparing these, the firm can deduce that an average consumer will prefer the increase in artificial sweeteners in the medium pulp orange juice over the increase in pulp quantity and use of low calories, natural sweeteners. Thus, the firm can apply the trade-off analysis to make important product design and marketing decisions to boost the product’s demand.
In analysing the issue further, the main advantage of con- joint analysis is that it allows one to simulate a market even if the consumers have not tested the product(s). In this case, the market for orange juice concerning different profiles is analysed. This helps one to compare the market shares asso- ciated with the new (desired) product (named Product 4 with all desired levels across selected attributes, as concluded in Appendix 1) with the existing products in the market. Thus, on running the market simulation model (Appendix 2), the new Product 4 enjoys the highest market share of around 32 percent compared to other products. This result seems satisfactory to launch this Product 4 in the market with the
levels preferred across the respondents’ attributes. The firms are even further interested in eliciting the consumers’ prefer- ences for another new Product 5 with different intrinsic cues (taste, pulp, preservatives, sweeteners) and extrinsic cues (method of production of orange, price, and brand). Regard- ing Simulation 2, the market share of new Product 5 to be introduced into the market with changed intrinsic and extrin- sic cues enjoy a lower share (27.50) than Product 4 (32.00) of Simulation 1. Consequently, it would be better to include the attributes and attribute levels of orange juice as desired by the consumers (i.e. Product 4).
Conclusions
With the onset of the COVID-19 pandemic, there is increasing awareness among the public to consume orange juice to boost their immune against the COVID-19 pan- demic. This study investigated consumers’ preferences relat- ing to orange juice purchasing decisions (through employing conjoint analysis) and further provided a simulation of the market for a new product to be released with the attributes and attribute levels desired by them. The findings revealed that the ‘method of production of orange’ is the most impor- tant attribute followed by the ‘brand’ being available in the market, and the presence of medium fruit pulp, with low calories and natural sweeteners. It is interesting that the pri- ority where the brand is concerned is methods of producing the orange juice that are close to the nature (using natural sweeteners in the final product). This result could be per- ceived as an expected one because, consumers have become more health conscious in the light of COVID-19 pandemic.
High calories.
Sugar/Honey;
0.01
High calories.
Sugar/Honey;
-0.105 Low calories.
Natural sweetener;
0.272
Low calories.
Natural sweetener;
0.157
Low calories.
Natural sweetener;
-0.054
-0.4 -0.3 -0.2 -0.1 0 0.1 0.2 0.3 0.4
No calories.
Artificial sweetener;
0.159
No calories.
Artificial sweetener;
0.044
No calories.
Artificial sweetener;
-0.167
Medium Pulp More Pulp No Pulp
High calories.
Sugar/Honey;
-0.316
Figure 2: Trade-off analysis across the levels of Pulp and Sweeteners Attributes of orange juice.
Source: Own composition
Attributes Levels Mean Utility Values Sweeteners High calories, Sugar/
Honey -0.137*
Low calories,
Natural sweetener 0.125**
No calories,
Artificial sweetener 0,012
Pulp Medium pulp 0.147**
More Pulp 0.032
No pulp -0.179*
However, and contrary to expectations, the product’s ‘price’
was assigned lesser importance by the consumers, as there is inelastic demand for orange juice in the market. In contrast to earlier studies, attributes pertaining to health conscious- ness (like method of production of orange, a ‘brand’ produc- ing orange juice using methods that are close to the nature, medium fruit pulp, with low calories and natural sweeteners) outweighed other attributes like flavour, preservatives, price, taste, and shape of the container in the light of COVID-19 pandemic.
Market simulation analysis revealed that the proposed new product (Product 4) with the desired attributes and attribute levels perceived by the respondents might expect to enjoy a market share of around 32 percent, and this is encour- aging for the firms to launch such a product into the market.
These results could also be useful for strategic planning of consumer instruction and have important implications for orange juice manufactures in the study area (Ferrarezi et al., 2013). However, this research suffers from few limitations, such as the limited number of product attributes and attribute levels, while the survey respondents were selected through convenience sampling method and were also frequently con- tacted through emails and mobile phones (to cross-check the data supplemented by them) because of the COVID-19 pan- demic. Furthermore, the effects of demographic factors were not analysed with respect to demand and orange juice attrib- utes. Hence, there is scope for further research that takes into account more attributes and attribute levels and is applied to a wider geography.
References
Aman, F. and Masood, S. (2020): How Nutrition can help to fight against COVID-19 Pandemic. Pakistan Journal of Medical Sci- ences, 36, S121–S123.
https://doi.org/10.12669/pjms.36.COVID19-S4.2776
Annunziata, A. and Vecchio, R. (2013): Consumer perception of functional foods: A conjoint analysis with probiotics. Food Quality and Preference, 28 (1), 348–355.
https://doi.org/10.1016/j.foodqual.2012.10.009
Ares, G., Giménez, A. and Gámbaro, A. (2008): Influence of nutri- tional knowledge on perceived healthiness and willingness to try functional foods. Appetite, 51 (3), 663–668.
https://doi.org/10.1016/j.appet.2008.05.061
Asioli, D., Næs, T., Granli, B.S. and Almli, V.L. (2014): Consumer preferences for iced coffee determined by conjoint analysis: an exploratory study with Norwegian consumers. International Journal of Food Science and Technology, 49 (6), 1565–1571.
https://doi.org/10.1111/ijfs.12485
Coelho-Ravagnani, de Faria C., Corgosinho, F.C., Sanches, F.F.Z., Prado, C.M.M., Laviano, A. and Mota, J.F. (2021): Dietary rec- ommendations during the COVID-19 pandemic. Nutrition Re- views, 79 (4), 382–393. https://doi.org/10.1093/nutrit/nuaa067
DelVecchio, D. (2001): Consumer perceptions of private label qual- ity: the role of product category characteristics and consumer use of heuristics. Journal of Retailing and Consumer Services, 8 (5), 239–249. https://doi.org/10.1016/S0969-6989(00)00030-8 Ferrarezi, A., Minim, V.P., dos Santos, K.M. and Monteiro, M.
(2013): Consumer attitude towards purchasing intent for ready to drink orange juice and nectar. Nutrition & Food Science, 43 (4), 304–312. https://doi.org/10.1108/NFS-03-2012-0021 Gil, J.M. and Sánchez, M. (1997): Consumer preferences for wine
attributes: a conjoint approach. British Food Journal, 99 (1), 3–11. https://doi.org/10.1108/00070709710158825
Green, P.E. and Srinivasan, V. (1978): Conjoint analysis in consum- er research: issues and outlook. Journal of Consumer Research, 5 (2), 103–123. https://doi.org/10.1086/208721
Haddad, Y., Haddad, J., Olabi, A., Shuayto, N., Haddad, T. and Toufeili, I. (2007): Mapping determinants of purchase intent of concentrated yogurt (Labneh) by conjoint analysis. Food Qual- ity and Preference, 18 (5), 795–802.
https://doi.org/10.1016/j.foodqual.2007.01.009
Helgesen, H., Solheim, R. and Næs, T. (1998). Consumer purchase probability of dry fermented lamb sausages. Food Quality and Preference, 9 (5), 295–301.
https://doi.org/10.1016/S0950-3293(98)00008-1
Luckow, T. and Delahunty, C. (2004): Consumer acceptance of orange juice containing functional ingredients. Food Research International, 37 (8), 805–814.
https://doi.org/10.1016/j.foodres.2004.04.003
Mann, S., Ferjani, A. and Reissig, L. (2012): What matters to con- sumers of organic wine? British Food Journal, 114 (2), 272–
284. https://doi.org/10.1108/00070701211202430
Ministry of Agriculture (MA) (2018): Horticultural Statistics at a Glance. Horticulture Statistics Division, Ministry of Agricul- ture and Farmers Welfare, Department of Agriculture, Coopera- tion and Farmers Welfare, Government of India
Ophuis, P.A.M. O. and Van Trijp, H.C.M. (1995): Perceived qual- ity: a market driven and consumer oriented approach. Food Quality and Preference, 6 (3), 177–183.
https://doi.org/10.1016/0950-3293(94)00028-T
Sethuraman, R. and Cole, C. (1999): Factors influencing the price premiums that consumers pay for national brands over store brands. Journal of Product & Brand Management, 8 (4), 340–
351. https://doi.org/10.1108/10610429910284319
Sriratana, W. and Limsombunchai, V. (2010): Factors Affecting Pure Orange Juice Purchasing Decisions of Consumers, Work- ing Papers 2010/02, Kasetsart University, Department of Agri- cultural and Resource Economics.
Wehmeyer, K. and Lankenau-Müller, C. (2005): Mobile Coupon- ing–Measuring Consumers’ Acceptance and Preferences with a Limit Conjoint Approach. In: Proceedings of the 18th Bled eConference, 6–8 June, 2005. Bled, Slovenia.
Windhita, A. Winoto, J. and Sahara, M. (2017): Competitiveness Measurement of Oranges Based on Consumer Preference.
International Journal of Science and Research, 6 (9), 1224–1228.
Yamane, T. (1967): Statistics: An Introductory Analysis, 2nd edition. New York: Harper and Row, USA.
Appendix
Appendix 1: Profiles used to evaluate the buying preferences of orange juice.
Profile Flavour Preservatives Sweeteners Brand Taste Pulp Container Mehod of
Production Price (Rs/litre) Profile 1 Weaker than
fresh orange SB or PS or CA in 1000 PPM
No calories, Artificial
sweetener B Natural More sour
than sweet More
Pulp Paper Pouch
with Straw Reduced use
of PPC >100 Profile 2 Stronger than
fresh orange SB or PS or CA in 500 PPM
Low calories, Natural
sweetener B Natural More sweet
than sour Medium
pulp Paper Pouch
with Straw Conventional
use of PPC 75-100 Profile 3 Similar to
Fresh Orange SB or PS or CA
in 500 PPM High calories,
Sugar/Honey Patanjali Balanced
sweet and sour Medium
pulp Paper Pouch
with Straw Conventional use of PPC >100 Profile 4 Similar to
Fresh Orange SB or PS or CA in 500 PPM
No calories, Artificial
sweetener Patanjali More sour
than sweet More Pulp
Plastic bottle with screw
cap
Conventional
use of PPC 75-100 Profile 5 Stronger than
fresh orange SB or PS or CA in 1000 PPM
Low calories, Natural
sweetener Patanjali Balanced
sweet and sour No pulp
Plastic bottle with screw
cap
Reduced use
of PPC >100 Profile 6 Weaker than
fresh orange SB or PS or CA
in 500 PPM High calories,
Sugar/Honey B Natural More sour
than sweet Medium pulp
Plastic Pouch with screw
cap
Fully
Organic <75 Profile 7 Stronger than
fresh orange SB or PS or CA in 500 PPM
No calories, Artificial
sweetener B Natural More sweet
than sour No pulp Plastic bottle with screw
cap
Reduced use of PPC <75 Profile 8 Stronger than
fresh orange SB or PS or CA
in 750 PPM High calories,
Sugar/Honey Tropicana More sweet
than sour More Pulp
Plastic Pouch with screw
cap
Conventional use of PPC >100 Profile 9 Weaker than
fresh orange SB or PS or CA
in 750 PPM High calories,
Sugar/Honey Patanjali More sweet
than sour More Pulp
Plastic bottle with screw
cap
Reduced use
of PPC 75-100 Profile 10 Stronger than
fresh orange SB or PS or CA in 1000 PPM
No calories, Artificial
sweetener Patanjali More sour
than sweet Medium pulp
Plastic Pouch with screw
cap
Fully
Organic 75-100 Profile 11 Weaker than
fresh orange SB or PS or CA in 1000 PPM
No calories, Artificial
sweetener Tropicana More sweet
than sour Medium pulp
Plastic bottle with screw
cap
Conventional use of PPC <75 Profile 12 Similar to
Fresh Orange SB or PS or CA in 1000 PPM
Low calories, Natural
sweetener B Natural Balanced
sweet and sour More Pulp
Plastic Pouch with screw
cap
Conventional use of PPC <75 Profile 13 Stronger than
fresh orange SB or PS or CA
in 750 PPM High calories,
Sugar/Honey B Natural More sour
than sweet No pulp Plastic bottle with screw
cap
Conventional
use of PPC 75-100 Profile 14 Stronger than
fresh orange SB or PS or CA in 750 PPM
Low calories, Natural
sweetener Tropicana More sour
than sweet No pulp Paper Pouch with Straw Reduced use of PPC <75 Profile 15 Similar to
Fresh Orange SB or PS or CA
in 1000 PPM High calories,
Sugar/Honey Tropicana More sweet
than sour No pulp Paper Pouch with Straw Fully
Organic 75-100 Profile 16 Weaker than
fresh orange SB or PS or CA in 500 PPM
Low calories, Natural
sweetener Patanjali More sour
than sweet No pulp Plastic Pouch with screw
cap
Conventional use of PPC >100 Profile 17 Similar to
Fresh Orange SB or PS or CA in 750 PPM
No calories, Artificial
sweetener B Natural Balanced
sweet and sour Medium pulp
Plastic Pouch with screw
cap
Reduced use
of PPC 75-100 Profile 18 Weaker than
fresh orange SB or PS or CA in 500 PPM
No calories, Artificial
sweetener Tropicana Balanced
sweet and sour More Pulp
Plastic bottle with screw
cap
Fully
Organic 75-100 Profile 19 Weaker than
fresh orange SB or PS or CA in 750 PPM
No calories, Artificial
sweetener Patanjali Balanced
sweet and sour No pulp Paper Pouch
with Straw Fully
Organic <75 Profile 20 Similar to
Fresh Orange SB or PS or CA in 750 PPM
Low calories, Natural
sweetener B Natural More sweet
than sour Medium pulp
Plastic bottle with screw
cap
Fully
Organic >100 Source: Own composition.
Appendix 2: Simulation of market and shares of products.
Product
ID Flavour Preserva-tives Sweeteners Brand Taste Pulp Container Method of Production of orange
Price (Rs/lit)
Market Share (%) (Simulation
1)
Market Share (%) (Simulation
2) Product
1
Similar to Fresh Orange
SB, PS, &
CA each in 500
PPM
Low calori- es, Natural sweetener
NaturalB
Balanced sweet and
sour
More Pulp
Plastic bottle with
screw cap
Fully
Organic >100 29.00
(0.29) 26.50
(0.265)
Product 2
Stronger than fresh orange
SB, PS, &
CA each in 750
PPM
No calories, Artificial
sweetener Patanjali More sweet than sour
dium Me- pulp
Plastic Pouch with
screw cap
Conventio- nal use of
PPC 75-100 25.00
(0.25) 24.00
(0.240)
Product 3
Weaker than fresh orange
SB, PS, &
CA each in 1000
PPM
High calo- ries, Sugar/
Honey
Tropi- cana
More sour than
sweet pulpNo
Paper Pouch with
Straw
Reduced
use of PPC <75 14.00
(0.14) 22.00
(0.220)
Product 4
Similar to Fresh Orange
SB, PS, &
CA each in 500
PPM
Low calori- es, Natural
sweetener Patanjali Balanced sweet and
sour
dium Me- Pulp
Paper Pouch with
Straw
Fully
Organic Rs.75-
100/lit 32.00
(0.32) --
Product 5
Similar to Fresh Orange
SB, PS, &
CA each in 1000
PPM
High calo- ries, Sugar/
Honey
Tropi- cana
More sweet than sour
More pulp
Paper Pouch with
Straw
Reduced
use of PPC >100 -- 27.50
(0.275) Note: Figures in parentheses indicate utility values.
Source: Own composition