Low carbon scenarios for higher thermal comfort in the residential building sector of South Eastern Europe
Aleksandra NOVIKOVA, Tamás CSOKNYAI, Zsuzsa SZALAY
Abstract
The paper presents the residential sector building topology, thermal energy balance, and scenarios prepared at several levels of sector segmentation to assist the design of low-carbon development policies for Albania, Serbia, and Montenegro. The research is breakthrough for developing Europe and could be replicated in its countries.
The paper describes methodological steps and selected results. First, representative building types were identified; their energy performances by end-use, retrofit packages, as well as associated costs were assessed. Second, this information was inserted into a bottom-up simulation model prepared in the Long range Energy Alternatives Planning System (LEAP) software. Using it, sector energy balances, the reference scenario, as well as moderate and advanced low-carbon high- thermal-comfort scenarios were prepared. The low-carbon scenarios assumed ambitious regulatory and financial policies.
It was found that due to fuel poverty partial and intermittent heating is a typical problem; therefore sector thermal energy demand is much higher than its actual consumption. Also, actual consumption by energy source was found not fitting official energy balances because households use more wood and more heating systems than officially reported.
In 2030, the moderate and ambitious scenarios lead to a reduction of CO2 emissions by 23%-73%
and 16-73% respectively versus the reference, offering higher thermal comfort. The priority is to retrofit small buildings constructed after 1991 in Albania and those built in 1971-1990 in Montenegro and Serbia. Assuming the discount rate of 4% and counting saved energy costs as benefits, almost all scenarios are cost-effective as a whole on the country level, however not for many building categories. Therefore other benefits should also be counted that presents the next research opportunity.
Keywords
Residential buildings, energy efficiency, building typology, low carbon development scenarios, fuel poverty, thermal comfort, bottom-up modeling, South East Europe.
Abbreviations
ADA Austrian Development Agency
BAU Business As Usual
BEAM Built Environment Analysis Model
CDD Cooling Degree Days
CO2 Carbon dioxide
DH District Heating
DHW Domestic Hot Water
EER Energy Efficiency Ratio
ECRAN Environment and Climate Regional Accession Network ESM Electronic Supplementary Material
EU European Union
EPBD Energy Performance of Buildings Directive
GHG Greenhouse Gas Emissions
HDD Heating Degree Days
LEAP Long range Energy Alternatives Planning System
LPG Liquid Petroleum Gas
SEER Seasonal Energy Efficiency Ratio
SLED Support for Low-Emission Development in South Eastern Europe
REC Regional Environmental Center of Central and Eastern Europe
VAT Value Added Tax
Introduction
Addressing thermal energy demand of the residential sector and reducing fuel poverty of households is a big challenge for the countries of South Eastern Europe (Legro, Novikova, and Olshanskaya 2014). The present paper aims to contribute to the discussion how to address this challenge in Albania, Montenegro, and Serbia avoiding higher greenhouse gas (GHG) emissions.
In these countries, the residential sector contributed 27% - 52% to the final energy consumption and 32% - 54% to electricity consumption in 2015 (EUROSTAT 2017).
The quality of energy services delivered in these households is much lower than in the European Union (EU). The continued use of outdated wood stoves in homes results in high air pollution.
Cutting down forests for household energy services brings numerous environmental problems (Legro, Novikova, and Olshanskaya 2014).
Our research purpose was to provide useful policy analysis and advice regarding low emission development planning and corresponding investment into the residential building sector of Albania, Montenegro, and Serbia. In particular, the research questions were what key low-carbon technologies and practices are possible to address thermal energy demand in the residential buildings, how much energy they can save and carbon dioxide (CO2) emissions avoid, how much efforts are required from the countries to implement scenarios realizing this potential, and which sector segments are the priority for these actions.
To address these questions, representative building types were identified; their energy performances by end-use, retrofit packages, as well as associated costs were assessed. Using this information as an input, a bottom-up model was prepared to simulate sector energy balances and scenarios for the sector’s low energy and carbon transformation. The model was designed in such a way that it could be further used by national policy-makers and experts according to their needs.
The paper describes key methodological steps and selected results.
The paper is structured in five sections. After the introduction, a literature review discusses barriers for low-carbon development in the focus countries, policies to overcome these barriers, and techniques which could be used to model the impact of these policies ex-ante. The methodological section describes the approach used, including main assumptions, equations, data sources, as well as research uncertainties. The next section presents and discusses the assessment
results and it also draws messages for policy- and decision-makers. Finally, the conclusion summarizes the key points of the paper.
Literature review
Barriers to penetration of low-carbon technologies and policies to overcome these barriers The penetration of energy efficiency and renewable energy technologies integrated into buildings is hindered by numerous barriers in South Eastern Europe (Singh, Limaye, and Hofer 2014a;
Ryding and Seeliger 2013; Simaku, Thimjo, and Plaku 2014a; Legro, Novikova, and Olshanskaya 2014). These are market failures, including imperfect information, organizational problems, technological risks, financial barriers, and hidden costs. The households do not behave rationally because they do not have a good foresight of prices; they are often not able to obtain the best technology; and are not able to make a choice that maximizes their utility in the long-term under the budget constraint.
The history of energy efficiency policies in Albania, Montenegro, and Serbia starts back to 2000s.
Becoming contracting parties of the Energy Community Treaty was however the biggest push towards more energy efficiency and climate change mitigation policies. According to the Treaty, the countries are obliged to introduce selected energy-related EU legislation.
The literature attests the significant progress that the countries have made in adopting and implementing this legislation1 . These efforts however are not yet enough to achieve the targets
1 (Simaku 2011; Simaku, Thimjo, and Plaku 2014a; Islami 2013; Energy Charter Secretariat 2013;
Republic of Albania 2003, 2011, 2014a, 2014b; Republic of Albania. Ministry of Environment 2014; Energy Community Secretariat 2012; Singh, Limaye, and Hofer 2014b; Energy Community Secretariat 2014, 2015; Banjac 2014; Solujić 2014; Republic of Serbia 2004; Republic of Serbia.
Ministry of Mining and Enegry 2005; Republic of Serbia 2007, 2009, 2010a, 2010b, 2012, 2013;
Republic of Serbia, Ministry of Agriculture and Environmental Protection 2014; Republic of Serbia, Ministry of Energy, Development, and Environmental Protection 2012; European Agency for Reconstruction 2005; Ministry of Economic Development 2007; Ministry of Economy 2010, 2012, 2013; Ministry of Economy of Montenegro 2013; Ministry of Economy 2014; Republic of Montenegro 2010, 2014).
required by the EU energy efficiency acquis (Legro, Novikova, and Olshanskaya 2014). The review of EU and global literature suggests that a more comprehensive mix of policies including regulatory, financial, and information is required (Lucon et al. 2014; Ürge-Vorsatz et al. 2012;
Bürger 2012; Ryding and Seeliger 2013; Singh, Limaye, and Hofer 2014a).
Modelling low-carbon development scenarios
Scenarios for policy-making in the area of sustainable energy are used since 1970s and in low carbon development since 1980s. By today, there are hundreds of energy- and climate- related scenarios developed on local, national, and global level and used for policy design and implementation.
The aim of low carbon development scenarios is to provide an understanding of the change in GHG emissions due to the realization of the low-carbon technology potential, behavioral change, or policy impact (Ghanadan and Koomey 2005). There could be descriptive scenarios, which explore paths into the future without any preconceived endpoint, and prescriptive, which explore the routes to desired endpoints.
Top-down versus bottom-up modeling
Literature distinguishes two approaches to the modelling of the energy system, and thus low- carbon scenarios: top-down and bottom-up. Top-down models examine interactions between the energy consumption of the residential sector and macro-economic variables on the national level (e.g. gross domestic product, unemployment rate, inflation, energy price, etc.). For example, Cellura et al. (2013) developed an energy and environmental input-output model to assess the role of building sector in CO2 emissions, and the benefits from a tax deduction policy.
Bottom-up models calculate the energy consumption of end-uses of representative individual buildings and extrapolate the results for a geographical jurisdiction. The main advantage of the bottom-up modelling is a high level of detail and a possibility to model technological improvement options. The challenge of this modeling is that its input data requirement is much greater than for top-down models.
Methods of bottom-up modeling
Bottom-up approaches can be further classified into statistical and engineering methods (Swan and Ugursal 2009). Statistical methods are based on historical measured data and regression analysis to
attribute energy consumption to different end-uses. Engineering methods calculate the energy consumption of end-uses based on thermodynamic relationships or power values and use schedules.
There is a significant amount of literature for bottom-up modelling of the low-carbon development scenarios with engineering methods. The models differ in their scope, scale, type and resolution of input data and modelling complexity.
Analysis on a smaller scale, for example for municipalities, makes it possible to acquire highly detailed data based on in-field surveying (Dall’O’, Galante, and Pasetti 2012). While these models deliver reliable results on real energy saving potential, on a larger scale such level of detail is usually not available. For example, the Built Environment Analysis Model (BEAM) developed by Ecofys is not very detailed but has been successfully implemented for the analysis of national and international building stocks and scenarios, such as in policy making for the European Commission (Bettgenhäuser et al. 2013).
Modelling techniques can also be applied in large-scale energy planning and energy policies (Guarino et al. 2016; Fonseca et al. 2016). Input data quality can be improved if national datasets, for example dwelling characteristics from a large number of Energy Performance Certificates are available (Dineen, Rogan, and Ó Gallachóir 2015). However, the main problem with energy certificates is that they often represent dwelling units and not entire buildings.
Bottom-up models can be evaluated depending on whether the model includes future projections.
Most engineering bottom-up models in literature develop a detailed typology of the building stock, extrapolate the energy demand by multiplying the energy demand by the number of buildings or total floor area, validate the results against the national energy balance and calibrate the model if necessary, with the goal of evaluating the effect of different energy saving measures, e.g. (Dall’O' et al. 2012), (Dineen et al. 2015), (Filogamo et al. 2014), (Fracastoro & Serraino 2011) (Dascalaki et al. 2011) (Mata et al. 2015) (Mata et al. 2014).
Some papers extend the model by incorporating a projection of future building stock changes (Gouveia et al. 2012), (Ghedamsi et al. 2016). Sartori, Wachenfeldt, and Hestnes (2009) considered the activities of construction, demolition and renovation when developing a model to study the effect of different approaches to reduce electricity and energy demand in the Norwegian
building stock. Such a model can be used for developing long-term energy scenarios to evaluate the effect of energy policy instruments. (McKenna et al. 2013) established a highly disaggregated bottom-up model for the German residential building stock to analyse whether political goals aiming at the reduction of energy use can be achieved. The model consists of a building stock model with projections on new build and demolition until 2050, and an energy demand model.
Modeling uncertainties
Many authors emphasize the difficulties in handling modelling uncertainties (Kavgic et al. 2010;
van Ruijven et al. 2010). To deal with uncertainties, research may carry out a sensitivity analysis to identify the parameters with the most significant influence on the energy demand. For instance, (Fracastoro and Serraino 2011; Kavgic et al. 2010; Gouveia, Fortes, and Seixas 2012) developed a Monte Carlo model to investigate and quantify the uncertainties in the building stock model and scenario assumptions.
Methodology
Research approach and boundaries
The present research relied on the bottom-up approach simulating energy consumption and CO2
emissions of representative building types based on thermodynamic equations and aggregating these figures to the sector energy balance. Modeling low-carbon scenarios implied the replacement of currently installed or installed in the business-as-usual case building components and systems with advanced options due to regulatory policies and/or financial incentives.
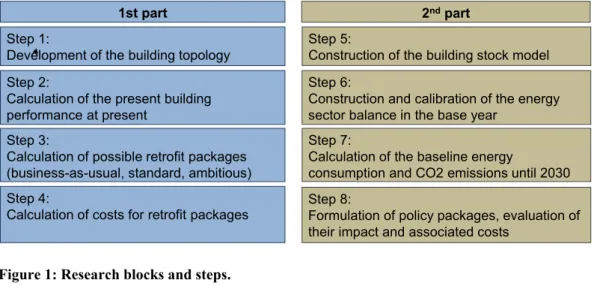
The methodology consisted of two blocks (Figure 1). The first block prepared by architects specialized in building energetics was about the development of building typologies, the calculation of energy performance by end-use on the individual building level, the assessment of possible retrofit packages and the associated costs. The second block prepared by an economist included the aggregation of the building level information to the sector level, the construction of the buildings stock model to the future, and the assessment of energy consumption and GHG emissions according to the reference and low-carbon scenarios.
Figure 1: Research blocks and steps.
Development of the building stock typologies
First, representative building types were identified, country building typologies were described, and the number of buildings and their structure according to the typologies were estimated. The main criteria to build the typologies was to be able to model space heating as precise as possible, because it represents the most important thermal energy end-use. The same typologies were used for the assessment of space cooling and hot water production.
Factors defining the topologies
Bottom-up modelling of thermal energy consumption in the residential building stock is usually based on a representative set of houses (Swan and Ugursal 2009) or, in case of lack of data, on a selection of real example buildings. The TABULA project, which aimed to create a harmonized structure for building typologies, defined three approaches to classifying building types (Ballarini, Corgnati, and Corrado 2014):
- “Real example building”: the most representative building selected by a panel of experts, usually applied if statistical data are not available;
- “Real average building”: real building with similar characteristics to the mean geometrical and construction features of a statistical sample;
- “Synthetical average building”: a virtual building or an archetype that is a “statistical composite of the features found within a category of buildings in the stock” (IEA Annex 31 2004).
1st part 2ndpart
Step 1:
Development of the building topology
Step 3:
Calculation of possible retrofit packages (business-as-usual, standard, ambitious)
Step 5:
Construction of the building stock model Step 6:
Construction and calibration of the energy sector balance in the base year
Step 7:
Calculation of the baseline energy
consumption and CO2 emissions until 2030 Step 2:
Calculation of the present building performance at present
Step 8:
Formulation of policy packages, evaluation of their impact and associated costs
Step 4:
Calculation of costs for retrofit packages
There is a broad consensus in the literature on the factors that are the most significant when disaggregating a building stock into typologies. These include construction period, geometrical features, construction materials, building service systems and climatic conditions (Filogamo et al.
2014; Fracastoro and Serraino 2011). In the present research, “real example buildings” were selected, as the available statistical data was limited. The main considerations for the building typology were the following:
- building geometry - building type,
- construction characteristics - construction period, - meteorological data - climate zones,
- building service systems and energy sources, - internal conditions and user behaviour.
The typology development was an iterative process. For Albania and Montenegro no building typology had been developed before. Therefore, for Albania, the first ever matrix was developed.
For Serbia, the typology matrix was prepared based on the previous typology of Jovanovic Popovic et al. (2013). This original typology was slightly simplified by the present project by merging some building types.
On the decision of, the expert panel, the Serbian typology was applied to Montenegro with slight modifications (for the information on the expert panel, please see the next section). The building stocks in Montenegro and Serbia are similar as these countries used to be the members of Yugoslavia for a long period and implemented similar regulatory steps since separation. While the building stock of these two countries is similar, their technical building systems and energy sources are not the same. This fact is not reflected by the matrices, but the calculation procedures for building energy performance due to different technical building systems.
Calculating the building number according to the topologies
The number of buildings and their structure according to the typologies was estimated based on a combination of statistical data, literature and the input from the national expert panels. The main source of statistical data was the openly available censuses conducted during the last fifteen years and provided by Statistical Offices (INSTAT 2001; INSTAT 2011; Monstat 2003; Monstat 2011;
SORS 2011).
This set of statistics was comprehensive, but as the censuses were not designed specifically to provide data for the energy performance evaluation of the building stocks, some data was not available at the required level of detail. For example, the breakdown of buildings by heating system type and its energy source was available in Albania at the national and prefecture levels, but was not assigned to building types.
To work through uncertainties in the building statistics, the national expert panels were involved.
The panel consisted of renowned local experts familiar with the characteristics of the building stock. With the help of the national expert panels, the research team could make and validate assumptions for the breakdowns for each country. These and other methodological challenges as well as the way in which they were overcome were described in detail in the series of books issued by the research (Novikova, Csoknyai, Jovanovic Popovic, et al. 2015; Novikova, Csoknyai, Miljanic, et al. 2015; Novikova, Szalay, et al. 2015).
Breaking down the building stock by climate zone
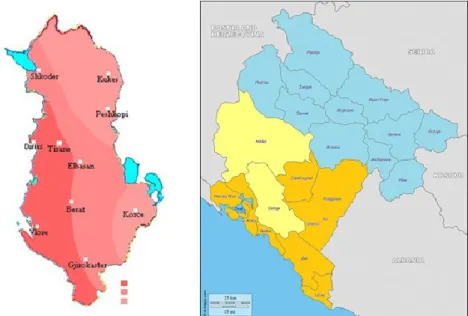
The territories of Albania and Montenegro are divided into three climate zones as illustrated in Figure 2 and Table 1. These are a mildest zone along the sea coast, a moderate zone between the sea coast and mountains, and a coldest zone in the mountainous area.
The impact of the local climatic characteristics was taken into account on the basis of heating degree days (HDD) provided by the national rulebooks. In Montenegro, the values were provided for climate zones, but for Albania and Serbia for prefectures/ cities, hence a weighted HDD was determined for the climate zones/ country taking into account the number of dwellings in each prefecture.
Figure 2: Climate zones and prefectures in Albania (Simaku, Thimjo, and Plaku 2014b), and Montenegro (Zone I: orange, Zone II: yellow, Zone III: blue)
Table 1: Characteristics of climate zones in Albania, Montenegro and Serbia
Albania Montenegro Serbia
zone name HDD (17,5 oC) zone name HDD (20 oC) HDD (20 oC)
Mildest zone zone A 1330 zone I 1623
2658
Moderate zone zone B 1534 zone II 2528
Coldest zone zone C 2600 zone III 3388
Source: constructed based on Simaku, Thimjo, and Plaku 2014b, Ministry of Economy of Montenegro 2013, Republic of Serbia 2013.
Breaking down the building stock by building service system and energy source
The building stock was further broken down depending on which building service systems and which energy sources were used. In Albania and Montenegro, local heating systems such as stoves, electric heaters and inefficient air-to-air heat pumps were found to be common. Central heating exists only in an insignificant number of dwellings, and even in those there is a lack of metering and temperature controls (Simaku, Thimjo, and Plaku 2014a). In Serbia, although similar low-efficient decentralized systems are the most general, central district heating also occurs in prefabricated buildings.
In the whole region, space cooling systems are typically single reversible split units and they are often used also for space heating. The statistics on the penetration of air-conditioning lacked in Serbia, was contradictory in Albania (INSTAT 2011, Kelemen et al. 2015), and was incomplete in Montenegro.
Individual electric hot water boilers are the most common in all three countries. In Serbia, these are applied even in buildings supplied with district heating (SORS 2011). In households with gas heating, there is a significant percentage with an integrated domestic hot water (DHW) system. In Albania, especially in the mountainous area, DHW with wood is also common. Solar water heating is not widespread.
The assumptions related to the share of energy sources, types of space heating system, water heating systems, and cooling systems were prepared together with the local expert panels because the statistics was very limited and/or contradictory.
Definition of retrofit packages and their costs
Next, possible low-carbon retrofit packages improving thermal comfort and the associated costs were assessed on the level of individual representative buildings. Only thermal energy services, e.g. space heating, space cooling, and water heating, were assessed. The impact of climate change on space heating and cooling patterns was not considered. Energy use for electrical appliances, lighting and cooking were not covered by the research.
The retrofit options included both the improvement of thermal envelope and the exchange of technical systems, which often imply a fuel switch. The improvement of thermal envelope implied the retrofit of walls, roofs, floors, and windows. Better technical systems were better mechanisms for water heating, space heating, and space cooling. Depending on technical and economic feasibility, households might switch to solar, biomass, electricity, or natural gas (Serbia only).
Three building retrofit packages for each individual building type were designed:
- The “business-as-usual” option (BAU improvement) included the currently most frequently applied retrofit measures (e.g. changing of windows, improving the heating system controls). In Albania, the installation of standard heat pumps was also assumed in every building type.
- The “standard” option included upgrading the building envelope in order to comply with the minimum requirements of the national building codes for major renovation. In addition, efficient technical systems were introduced, also involving fuel switch in some cases.
In Albania and Montenegro, high-efficiency wood pellet stoves and single-room air-to-air reversible split systems are introduced depending on building type and climate zone, and solar water heating systems for covering part of the DHW demand. In Serbia, a shift from individual heating systems to central heating with low-temperature gas boiler or biomass was assumed. In buildings with district heating standard retrofit involves improving the control and efficiency of the existing system by installing thermostatic valves on radiators and upgrading the substation and heat supply control based on external air temperature.
- The “ambitious” option went beyond building regulations regarding the building envelope, to a level that was foreseen in the future building codes. For the technical systems, better heating system efficiencies were considered, and solar hot water heating was assumed.
In line with expert observations, it was assumed that the comfort expectations of the occupants would increase after the installation of the retrofit packages. As the households would need space heating systems allowing heating larger dwelling areas and a lower amount of fuel, they will heat more hours per day and more rooms (the details for each building type by climate zone are included in the ESM).
While the European literature argues that the rebound effect may partially offset the impact of energy efficiency improvements (Cellura et al. 2013), it is unlikely that the effect will be significant in case of Southern Europe. Given that the most households in Albania, Montenegro, and Serbia heat only one room for a few hours a day and the temperature of the rest of the dwellings is much lower than health standards, the offset of energy savings by higher consumption represent the provision of necessary thermal comfort services rather than the rebound effect.
The investment costs of retrofit packages per building type and measure were calculated in consultation with the national expert panels (Jovanovic Popovic et al. 2013; Simaku, Thimjo, and Plaku 2014b; Miljanic 2015) (included in the ESM). While prices included all system elements, there could be some additional work to remove the old installations depending on the initial state of the building. The investment costs also included labour and value added tax (VAT).
Calculation methods for energy and carbon performance of buildings and systems
For space heating, space cooling and water heating energy, in each representative building, net (useful) and delivered (final) energy demand was calculated. Energy use for operating electrical appliances, lighting and cooking was not considered in the model. The net energy demand for space heating and cooling was carried out according to the seasonal method of EN ISO 13790 for all countries utilizing previous results of (Popovic et al 2013) for Serbia. The assumptions are in line with the new building codes required by the Energy Performance of Buildings Directive (EPBD) (European Commission 2010). Where applicable, calculations were implemented per climate zone. As a first step full heating to 20 oC was assumed, which was then modified in the calibration process as explained later.
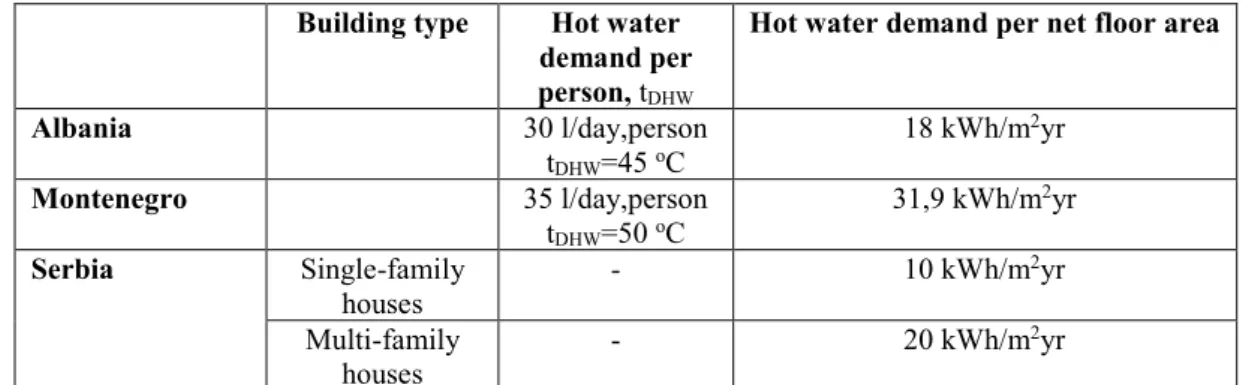
The net energy demand for DHW was calculated based on the national rules and practices. As a consequence, significant differences could be noticed for the specific demands, as illustrated in Table 2.
Table 2: Input parameters to estimate net energy demand for domestic hot water Building type Hot water
demand per person, tDHW
Hot water demand per net floor area
Albania 30 l/day,person
tDHW=45 oC 18 kWh/m2yr
Montenegro 35 l/day,person
tDHW=50 oC
31,9 kWh/m2yr
Serbia Single-family
houses - 10 kWh/m2yr
Multi-family
houses - 20 kWh/m2yr
Source: Simaku,Thimjo and Plaku (2014b), Republic of Montenegro (2010), Republic of Serbia (2013).
Delivered energy demand was calculated using the net heating energy demand (QND) per energy source:
The system efficiency (t) of the energy supply systems was calculated as follows:
t delivered ND
Q Q
c p b
t
where
b = boiler (source) efficiency
p = piping (distribution) efficiency
c = control (regulation) efficiency
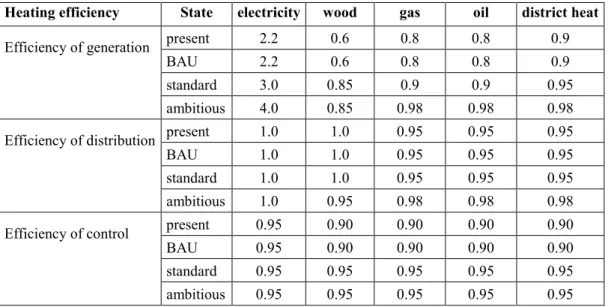
For technical building service systems providing space heating, three subtypes were modelled in Albania, two in Montenegro, and six in Serbia, pertaining to the most typical energy sources for the current situation. These were electricity (air-to-air heat pumps and direct electric heating), wood (mostly wood stoves), liquefied petroleum gas (LPG) (LPG stoves) or natural gas (mostly individual boilers), oil (boilers), coal (coal stoves), and district heating (INSTAT 2011, Kelemen et al. 2015; Monstat 2011; SORS 2014). The typical efficiencies are summarized in Table 3 and Table 4. DHW system efficiencies were defined in a similar way.
Table 3: Heating system efficiencies
Heating efficiency State electricity wood gas oil district heat Efficiency of generation
present 2.2 0.6 0.8 0.8 0.9
BAU 2.2 0.6 0.8 0.8 0.9
standard 3.0 0.85 0.9 0.9 0.95
ambitious 4.0 0.85 0.98 0.98 0.98
Efficiency of distribution
present 1.0 1.0 0.95 0.95 0.95
BAU 1.0 1.0 0.95 0.95 0.95
standard 1.0 1.0 0.95 0.95 0.95
ambitious 1.0 0.95 0.98 0.98 0.98
Efficiency of control
present 0.95 0.90 0.90 0.90 0.90
BAU 0.95 0.90 0.90 0.90 0.90
standard 0.95 0.95 0.95 0.95 0.95
ambitious 0.95 0.95 0.95 0.95 0.95
Source: developed with national expert panels.
Table 4: Cooling system efficiencies
State Efficiency (EER)
present state 2.0
BAU retrofit 2.0
standard retrofit 3.0
ambitious retrofit 3.0 Source: developed with expert panels
Annual CO2 emissions for each energy end-use were calculated as the sum of the delivered energy (Qdelivered) multiplied by CO2 emission factors (fCO2,source) of the energy commodities, respectively.
where
= the CO2 emission factor of the energyware used by heat generator i
As there was no information available for the specific CO2 emissions, standard values were used for wood and LPG (Table 5). The values for electricity were determined based on the electricity sector modelling described in Szabo et al. (2015). In the table “not relevant” means that the considered energy source is not used in the country or negligible. The low values for electricity for Albania are explained by the fact that its electricity supply is based on hydro generation.
Table 5: CO2 emission factors (kg/kWh)
CO2 emission factors (kg/kWh)
Albania Montenegro Serbia
natural gas not relevant not relevant 0.202
LPG 0.227 not relevant 0.227
wood 0.1 0.1 0.1
electricity 0.000 0.578 1.041
solar 0 0 0
coal lignite not relevant not relevant 0.364
diesel oil not relevant not relevant 0.267
district heating not relevant not relevant 0.330
Sources: (Ministry of Economy 2013; Szabo et al. 2015; IPCC NGGIP online)
Building stock modelling
In order to project the building stock and its structure by building type to the future, the building stock turnover model was prepared in Excel spreadsheets. For Albania, this model was constructed until 2050 and for Serbia and Montenegro until 2070.
Q f kg year
m
CO2 delivered CO2,sourceii source
f
CO2,Within this task, the number of households and their demand for dwellings over the modelling period were calculated. To estimate the number of households, the population growth rates were applied according to the medium variant of the population projections provided by the Statistical Office of Serbia (SORS online), Albania (INSTAT 2014b), and the energy strategy of Montenegro (Ministry of Economic Development 2007). Beyond these years, the continuation of the past population trends was assumed.
In line with the overall European trends (European Commission 2011), it was assumed the average number of persons per households in Serbia and Montenegro would decrease to 2.3/2.4 and 2.0 persons per household in 2050 and 2070 respectively and in Albania - to 3.0 per household in 2050. The value of 2.0 is the average number of persons per households in Europe by 2050 (European Commission 2011). According to the latest census (SORS 2011), 1.03 households populated one dwelling and this number was assumed to be constant.
The demolition rate of residential buildings was calculated based on the comparison of previous censuses using a Weibull curve, which describes a fraction of remaining units over time (Weibull 1951):
𝐹𝑟𝑎𝑐𝑡𝑖𝑜𝑛 𝑜𝑓 𝑢𝑛𝑖𝑡𝑠 𝑟𝑒𝑚𝑎𝑖𝑛𝑖𝑛𝑔 (𝑡) = 𝑒−(𝑡−𝑐𝑎)𝑏 where
𝑡- year 𝑎 - scale factor 𝑏 - shape factor 𝑐 - location parameter
The mean lifetime of units could be estimated as:
𝑀𝑒𝑎𝑛 𝑙𝑖𝑓𝑒𝑡𝑖𝑚𝑒 = 𝑎 × 𝛾(1 +1 𝑏) 𝛾 – the value of the Gamma function
Figure 3 illustrates the Weibull curves for different shape factors assuming the location parameter 0. Since there was not enough data to estimate all parameters of the Weibull curve, an assumption for the shape parameter as 2.5 and for the location parameter as 0 was made.
Figure 3: The Weibull curve
Source: (Welch and Rogers 2010).
Using the Weibull curve, the average lifetime of the existing residential buildings was modelled.
For instance, in Serbia for the buildings built before 1945, the building lifetime was found to be 75 years. For the buildings built in 1946 – 1980, in 1961 -1970, 1971 – 1980, and 1981 – 1990, it was found to be 80, 65, 75, and 65 years respectively.
Using the Weibull curve and these assumptions, the number of remaining dwellings by each age category until 2070 was calculated. Applying assumptions on the number of dwellings per building made using the data of censuses, the number of remaining buildings by each age category until 2050/2070 was computed. The construction of new dwellings was estimated as a gap between the demand for dwellings represented by the number of households and the remaining stock of existing dwellings. The calculated dwellings stock was also corrected for inhabitance rates provided by country censuses.
Selection of the modeling software
For the analysis on the sector level, a bottom-up simulation model was designed and applied.
With the help of the model, energy balances and CO2 emissions on the sector level in the base year
were calculated. Only CO2 emissions, both direct and indirect, were considered. Indirect emissions were defined as those which include emissions from electricity and district heat (DH).
In order to select the scenario modelling tool, the existing capacities of the focus countries to understand and replicate such analysis independently were analyzed. It was found that the Environment and Climate Regional Accession Network (ECRAN) financed by the EU was conducting a series of regional trainings for policy-makers on the construction of low-carbon development scenarios using quantitative models. Operationally, the beneficiaries were performing a series of exercises with the help of the Long range Energy Alternatives Planning System (LEAP) software.
LEAP offers an integrated bottom-up and top-town tool to model energy consumption, production and resource extraction in all economic sectors. On the demand side, i.e. including the building sector, it uses the bottom-up approach offering segmentation to the energy use, technology, and energy carrier levels. It could also be used to account for both energy sector and non-energy sector greenhouse gas emission sources and sinks. Furthermore, it allows for integrating the cost and benefit analysis and the cost-effectiveness analysis.
Due to the existing capacity of the countries to operate LEAP, it was decided to prepare the model in this software. After the project was completed, the models with the underlying input data were provided to national policy-makers and experts. Following the ECRAN training, they were able to run and modify the models according to their needs.
LEAP is a widely-used software tool for energy and climate policy analysis. It has often been employed for modelling policies in the transportation sector (Hong et al. 2016; Sadri, Ardehali, and Amirnekooei 2014; Shabbir and Ahmad 2010), different industry sectors (Ates 2015) or national emissions (Puksec et al. 2014). However, detailed modelling of the building stock is rare.
An example is a case study for Tehran where LEAP software was used to model long-term development policies for the household sector (Abbaspour et al. 2013), but their model was not disaggregated on the level of building types. The present piece of research therefore represents the first attempt to apply LEAP to modelling the low-carbon development of the building sector on a highly disaggregated level.
Using LEAP, the energy demand per square meter floor area of each representative building in each climate zone was estimated as a sum of its energy demand per end-use. Then, the floor area of representative buildings was multiplied with their energy demand in each climate zone and the results were summed up across all climate zones, building types, and building age categories.
Calibration of sector energy balances
As described above, the final energy demand of representative building types was calculated based on their net energy demand and the assumptions about the technical building systems and sources which they use. Then, the final energy demand was calculated on the national level and it was compared to the official sector energy balances available and/or other statistics. These figures were compared and calibrated to official energy balances and/or other statistics available for 2010- 2013. The calibration process had many iterations during which we came to a few conclusions;
this is why the reasons for the difference and the actual difference is discussed in details in the respective section of the “results” chapter.
The calculated energy consumption was also corrected for inhabitance rates provided by country censuses (INSTAT 2011; Monstat 2011; SORS 2011). To avoid overestimating energy consumption for buildings with temporarily non-inhabited dwellings, correction factors for inhabitance were introduced. It is not clear from the statistics how temporarily vacant dwellings are distributed among buildings by type and age category. This is why the same factors to correct for inhabitance were applied for different buildings sector segments.
Scenario modeling
Using the model, the reference scenario, as well as moderate and advanced low-carbon high- thermal-comfort scenarios were prepared. The low-carbon scenarios assumed additional regulatory and financial policy packages. The calculations were made until 2030 because the bottom-up detail-rich analysis does not make sense for the long-term.
In order to formulate the scenarios, the barriers for energy efficiency penetration in the residential buildings of the countries were reviewed. Existing, planned and further relevant policies to overcome these barriers were also analyzed (please see Literature review section for details).
Based on this review, three policy scenarios were developed and validated with national policy- makers (Table 6 and Table 7):
- In the reference scenario, business-as-usual technological, policy, and market changes were assumed. In particular, it was assumed that existing buildings are retrofitted at least once during their lifetime with a decrease of their energy demand by 20%.
- In the moderate scenario, it was assumed that the energy performance of all new and existing buildings by 2050 in Albania, and by 2070 in Montenegro and Serbia would achieve the level of standard improvement. For this, all existing buildings, which will remain by these time points, will be retrofitted with help of financial incentives.
- In the ambitious scenario, it was assumed that by 2050 the largest part of the new and existing buildings of all three focus countries will achieve the level of ambitious improvement. Similar to the moderate scenario, all existing buildings, which will remain by 2050, will be retrofitted with help of financial incentives.
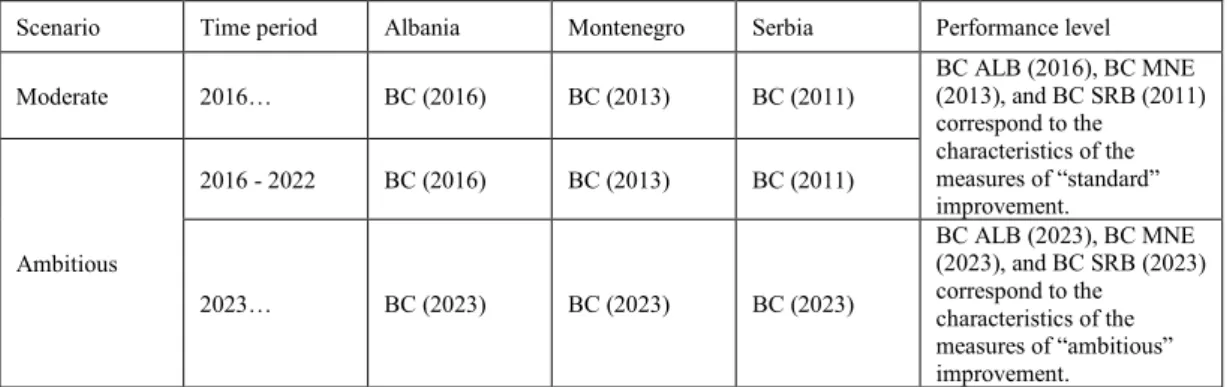
The key policy tool for new buildings was the introduction and/or implementation of building codes as it is presented in Table 6. In the moderate scenario, new buildings comply with the codes, which were recently adopted or which are in the process of adoption. In the ambitious scenario, new buildings comply with the codes, which were recently adopted or which are in the process of adoption until 2022. After 2023, they comply with the new, even more stringent building codes. Until 2022, new buildings are eligible for low-interest loans, if their building performance achieves the latter code.
Table 6: The schedule of introduction and implementation of building codes in the moderate and ambitious scenarios
Scenario Time period Albania Montenegro Serbia Performance level
Moderate 2016… BC (2016) BC (2013) BC (2011)
BC ALB (2016), BC MNE (2013), and BC SRB (2011) correspond to the
characteristics of the measures of “standard”
improvement.
Ambitious
2016 - 2022 BC (2016) BC (2013) BC (2011)
2023… BC (2023) BC (2023) BC (2023)
BC ALB (2023), BC MNE (2023), and BC SRB (2023) correspond to the
characteristics of the measures of “ambitious”
improvement.
Note: BC (year) - building code introduced in the given year.
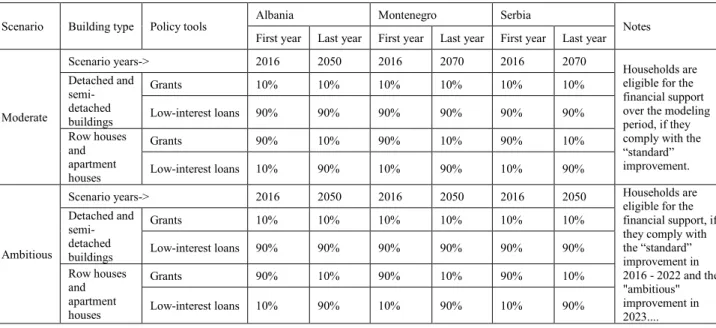
Financial incentives for the building retrofit include low interest loans and grants. It was assumed that the financial incentives will be provided to cover the share of eligible investment costs of better buildings, which approximately equals to the share of incremental investment costs into improvements as compared to the business-as-usual improvement.
The structure of the financial incentives depended on the building type as well as on the maturity of the market as it is presented in Table 7. We assumed a higher share of low interest loans for small buildings whereas for large buildings – a larger share of grants. In the long-term, we allowed for a higher share of loans versus a higher share of grants at present. In the moderate scenario, investors are eligible for financial support over the modeling period, if the retrofits comply with the “standard” improvement. In the moderate scenario, investors are eligible for are eligible for financial support in 2016-2022, if the retrofits comply with the “standard”
improvement, and after 2023, if the retrofits comply with the “ambitious” improvement.
Table 7: Financial incentives for building retrofit: shares of households affected by financial incentives in the first and last scenario years
Scenario Building type Policy tools Albania Montenegro Serbia
Notes First year Last year First year Last year First year Last year
Moderate
Scenario years-> 2016 2050 2016 2070 2016 2070
Households are eligible for the financial support over the modeling period, if they comply with the
“standard”
improvement.
Detached and semi- detached buildings
Grants 10% 10% 10% 10% 10% 10%
Low-interest loans 90% 90% 90% 90% 90% 90%
Row houses and apartment houses
Grants 90% 10% 90% 10% 90% 10%
Low-interest loans 10% 90% 10% 90% 10% 90%
Ambitious
Scenario years-> 2016 2050 2016 2050 2016 2050 Households are
eligible for the financial support, if they comply with the “standard”
improvement in 2016 - 2022 and the
"ambitious"
improvement in 2023....
Detached and semi- detached buildings
Grants 10% 10% 10% 10% 10% 10%
Low-interest loans 90% 90% 90% 90% 90% 90%
Row houses and apartment houses
Grants 90% 10% 90% 10% 90% 10%
Low-interest loans 10% 90% 10% 90% 10% 90%
The financial evaluation of the scenarios was based on the comparison of annualized investment costs of a scenario and the benefits associated with this scenario. The annualized investment costs
were calculated as the product of scenario investment costs and the annuity factor calculated using the formula below. Only saved energy costs were assessed as scenario benefits. The saved energy costs were calculated based on the prices of energy carriers for the residential end-users over the modeling period. The dynamic of the energy prices is described in detail for each country in (Novikova, Csoknyai, Jovanovic Popovic, et al. 2015; Novikova, Csoknyai, Miljanic, et al. 2015;
Novikova, Szalay, et al. 2015).
1
1 1
j
j
n
j n
DR DR
a DR
, where is a discount rate and
n
j is the lifetime of retrofit technology j assumed as 30 years. The discount rate assumed was 4% in line with the recommendations of the European Commission (online).To make sure the research results are used, the work on the design and assumptions of the models was conducted closely with national policy-makers. To receive additional data, comments, and wishes, they were interviewed at the beginning of the project. Their feedback to preliminary results was also gathered in the middle and towards the end of the project.
Uncertainty analysis
Easy changing of key assumptions within given intervals and thus obtaining results, when an additional uncertainty analysis is needed, was included into the models. These assumptions were discount rate, business-as-usual retrofit rate, the target year when the whole stock is retrofitted, the year of building code adoption, the shares of loans and grants and the share of eligible costs in the package of financial incentives, as well as other variables.
Results
It was estimated that in 2011 the number of residential buildings in the three analysed countries was 3.0 million and the number of dwellings was 4.6 million for a population of 10.6 million (INSTAT 2011; INSTAT 2013; INSTAT 2014; Monstat 2011; SORS 2011; Monstat 2014a;
Monstat 2012). The unregistered building stock was included into this accounting. Small buildings, e.g. detached and semi-detached houses, contain 65% in the dwelling stock. Medium buildings and large apartment buildings include 20% and 15% of dwellings respectively.
A remarkable characteristic of the building stock is the high number of dwellings classified as non- inhabited, accounting for about 27% on average among the three countries. These also include
DR
dwellings for secondary purposes or seasonal use. The share of vacant and seasonal dwellings is particularly high in Montenegro and Albania. The first reason is the large share of the stock serving as holiday resorts at the sea coast. The second reason is that a large number of dwellings were left empty due to emigration in the 1990s; while some of them in central areas were later populated again, many of them in less central areas still remain non-inhabited.
It was found that the building stock of the countries is relatively young: in Albania only 7 % was constructed before 1960, while in Montenegro 6% and in Serbia 15% of the existing building stock was built before 1945. After World War II, and from 1960 in particular, there was an upswing in the construction sector, especially in the construction of large, multi-family apartment blocks built with industrialized technology. After 1990, in Albania another boom can be observed, although there is a shift towards detached houses. In Serbia and Montenegro, in the nineties there was a fall in the construction sector, particularly for detached houses. After 2000, the number of new apartment buildings began to rise. (INSTAT 2011, MONSTAT 2011, MONSTAT 2012, SORS 2011).
The energetic quality of the building stock is low as buildings in general are poorly insulated. The majority of the building stock was constructed from brick and stone but clay and adobe should also be mentioned such as prefabricated buildings from the communist era. Apartment buildings constructed using prefabrication technology usually have some insulation, as this was part of the sandwich wall construction. Even relatively young buildings are insufficiently insulated as building codes were not strict enough and compliance was not checked.
Part of the building stock has already been refurbished. The most common interventions have been roof insulation and the replacement of windows (Jovanovic Popovic et al. 2013; Simaku, Thimjo, and Plaku 2014a)
Building stock typologies
The calculated building stock was broken down into typical representative building types based on the analysis of the building stock, construction periods and typical construction material according to the methodology described in the respective section. All technical data of the building types including the considered geometries, materials, and thermal transmittances can be found in the attached Electronic Supplementary Material (ESM).
Altogether twenty representative building types were considered in Albania, fifteen in Montenegro, and twenty four in Serbia. Figure 4 and Figure 5 present the building type matrix for Albania and Montenegro developed by the research project.
Figure 4: Albanian residential building typology Figure 5: Montenegrin residential building typology
As discussed in the relevant methodological sections, the matrix was further broken down by climate zones where relevant Table 8 presents the estimated breakdown of dwellings by climate zone. .
Table 8: Estimated breakdown of dwellings by climate zone in 2011
Albania Montenegro
Mildest zone 34.8% 64.0%
Moderate zone 51.0% 11.4%
Coldest zone 14.2% 24.6%
Source: own estimates.
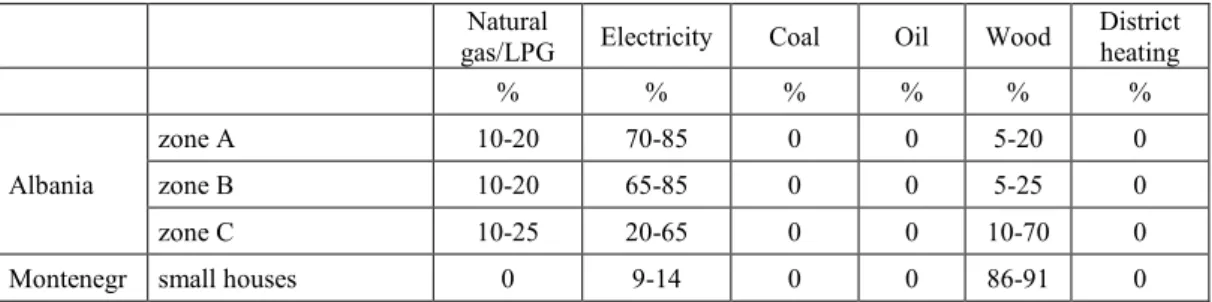
Table 9 presents the results of research on energy source mix for space heating at present. As Table illustrates, there was a large difference between building types and climate zones. In Albania the given ranges cover different subtypes and the minimum and maximum values might belong to different sub-types, this is why the average of range does not add up to 100. The energy mix for DHW production was prepared. The details could be found in Electronic Supplementary Material (ESM).
Table 9: Energy source mix for space heating in 2015
Natural
gas/LPG Electricity Coal Oil Wood District heating
% % % % % %
Albania
zone A 10-20 70-85 0 0 5-20 0
zone B 10-20 65-85 0 0 5-25 0
zone C 10-25 20-65 0 0 10-70 0
Montenegr small houses 0 9-14 0 0 86-91 0
o medium buildings 0 27-68 0 0 32-73 0
large buildings 0 46-92 0 0 8-54 0
Serbia
general case 9 17 7.5 3 63.5 0
buildings with district
heating 0 0 0 0 13 83
Source: own estimates in consultation with national expert panels.
Building stock at present and in the future according to the topologies
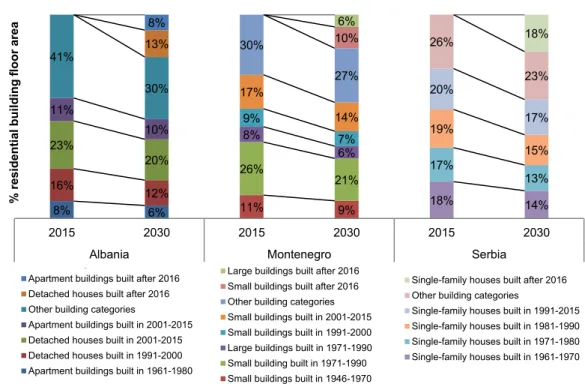
Figure 6 presents the structure of the residential building floor area in focus countries by building type and building age in 2015 and in 2030 prepared with the help of the building stock model.
Those representative buildings are named, whose share in the total area in 2030 will be more than 5%. Building groups, which constituted less than 5% in 2030 are grouped into the “others”
category.
Figure 6: The structure of residential building floor area by building age and type in Albania, Montenegro, and Serbia in 2015 and in 2030
As the figure shows, the three largest building categories in 2030 are detached buildings built in 2001-2015, 1991-2000, and after 2016 in Albania, small buildings built in 1970-1991, 2001 – 2015, and after 2016 in Montenegro, and single family houses built after 2016, in 1991-2015, and
8% 6%
16% 12%
23%
20%
11%
10%
41%
30%
13%
8%
11% 9%
26% 21%
8%
6%
9%
7%
17%
14%
30%
27%
10%
6%
18% 14%
17%
13%
19%
15%
20%
17%
26%
23%
18%
2015 2030 2015 2030 2015 2030
Albania Montenegro Serbia
% residential building floor area
0%
10%
20%
30%
40%
50%
60%
70%
80%
90%
100%
2015 2030 2015 2030 2015 2030
AlbaniaMontenegro Serbia
% residential building floor area
Single-family houses built after 2016 Other building categories
Single-family houses built in 1991-2015 Single-family houses built in 1981-1990 Single-family houses built in 1971-1980 Single-family houses built in 1961-1970 Large buildings built after 2016 Small buildings built after 2016 Other building categories Small buildings built in 2001-2015 Small buildings built in 1991-2000 Large buildings built in 1971-1990 Small building built in 1971-1990 Small buildings built in 1946-1970 Apartment buildings built after 2016 Detached houses built after 2016 Other building categories
Apartment buildings built in 2001-2015 Detached houses built in 2001-2015 Detached houses built in 1991-2000 Apartment buildings built in 1961-1980
0% 10% 20% 30% 40% 50% 60% 70% 80% 90% 100%
2015 2030 2015 2030 2015 2030
AlbaniaMontenegro Serbia
% residential building floor area
Single-family houses built after 2016 Other building categories
Single-family houses built in 1991-2015 Single-family houses built in 1981-1990 Single-family houses built in 1971-1980 Single-family houses built in 1961-1970 Large buildings built after 2016 Small buildings built after 2016 Other building categories Small buildings built in 2001-2015 Small buildings built in 1991-2000 Large buildings built in 1971-1990 Small building built in 1971-1990 Small buildings built in 1946-1970 Apartment buildings built after 2016 Detached houses built after 2016 Other building categories
Apartment buildings built in 2001-2015 Detached houses built in 2001-2015 Detached houses built in 1991-2000 Apartment buildings built in 1961-1980
Energy and carbon performance of buildings and systems
Net, delivered (final) and primary energy demand as well as the corresponding CO2 emissions were calculated for every building type in Albania, Montenegro and Serbia for the present state and for three retrofit options. The present state was first calculated assuming heating of the whole dwelling area for 18 hours a day (further referred to as “full” heating), and then corrected for the actual heating of dwelling floor area and heating hours (further referred to as “partial” heating) with the correction factors resulting from the literature (Monstat 2013), national expert panels, and the calibration of the model (see the next section for details).
Figure 7 presents the calculated net energy demand by building type in Montenegro for full heating. The figure illustrates that the thermal characteristics of the building stock have improved somewhat over time, although significant improvement can be seen only in the last decade. In general, detached houses have higher heating demand than large buildings due to their unfavourable surface to volume ratio. In most building types, heating is dominant in the total energy demand. Cooling energy demand is depicted in the figure, but it applies only to buildings where mechanical cooling was installed. The situation is similar in Albania and Serbia.
Figure 7: Net energy demand of the building types in Montenegro (present state, full heating, mildest zone)
The impact of three retrofit packages defined in the methodology section was evaluated for each building type. Figure 8 presents the impact of retrofit packages on building energy performance per m2 by building type in Montenegro. A remarkable result valid for all three countries is that although the BAU option involves basic efficiency measures, the net/ final energy is similar or higher compared with the original state. This is due to the prediction that occupants’ comfort expectations are likely to rise in the future and the duration of heating and the heated area will increase. This underlines the need for complex retrofit packages where energy reduction is achievable even at higher comfort levels.
Figure 8: Final energy demand of building types in Montenegro (present state and retrofitted states, mildest zone)
The figure shows that as a result of the retrofitting packages, space heating energy demand could be drastically reduced to a low-energy building standard in the complex retrofitting options.
Cooling energy demand could also significantly decrease (if shading of windows and efficient night ventilation is assumed). Hot water demand would remain the same.
Sector energy balances
The non-calibrated calculated final thermal energy demand appeared to be significantly different from that estimated based on the official sector energy balances. Namely, it was five times higher for Serbia, 2.5 times higher for Albania, and 2.3 times higher for Montenegro. Furthermore, the share of wood in the structure of the official energy balances was much lower than according to the calculations.
In consultation with national policy-makers and experts, several factors causing such variation were identified. Firstly, this was due to partial and intermittent space heating and cooling.
Second, the actual breakdowns of households by energy system installed, especially for space heating, were different from those reported by official statistics. Third, the official energy balances did not reflect perfectly the real final energy consumption of each energy commodity.
The first problem is often referred to as an impact of occupant behavior and/or fuel poverty that is common for many countries and mentioned as a bottleneck of engineering bottom-up modelling (Swan and Ugursal 2009). In the focus countries, the root of the problem is not in behavior as such but in the fact that it is typical to heat only a part of the dwelling (usually kitchen and the living room), often using non-commercial biomass, to save energy and costs. For Albania for instance, the actual net energy demand for space heating and cooling was found to be only 25-45%
of the values, if the whole dwelling floor area would be served for at least 18 hours a day to 18°C in buildings built before 2000. The exception among all building categories in all countries was only those dwellings in Serbia which are connected to district heating systems.
In regard to the second problem, there was for instance the underestimate of electricity heated households as provided by the Albanian census 2011 (INSTAT 2011). One of the reasons
identified was that many households use two heating systems, for instance wood stove and heat pump, while the census reports only one system. Therefore, estimates on the breakdown of energy sources used for space heating had to be made in a consultation with national experts and policy- makers.
In regard to the third problem, many uncertainties were recorded in the official energy balances.
For instance, the latest (2013) energy balances of Montenegro published by Monstat (Monstat 2014b), EUROSTAT (EUROSTAT 2015), and International Energy Agency (IEA online) had a clear overestimate of the share of the residential buildings and a clear underestimate of the tertiary sector in the structure of the “other” category of country’s final energy consumption. Due to this problem, the official balance was not used. On the recommendation of the national policy-makers, an estimate of the residential sector energy balance was compiled based on (Ministry of Economy of Montenegro 2013; Monstat 2013).
In all countries, it was also found that biomass consumption was significantly underestimated in the official energy balances. For example, it was found that biomass consumption in Serbia should be at least ca. 2.5 times higher than it was reported in the 2013 balance (Figure 9).