Physiology International, Volume 105 (1), pp. 86–99 (2018) DOI: 10.1556/2060.105.2018.1.3
Surface electromyographic evaluation of the neuromuscular activation of the inspiratory muscles during progressively increased inspiratory fl ow under
inspiratory-resistive loading
H Sekiguchi1,2, Y Tamaki2, Y Kondo2, H Nakamura3, K Hanashiro4, K Yonemoto5, T Moritani6, I Kukita2
1Department of Intensive Care, Tomishiro Central Hospital, Okinawa, Japan
2Department of Emergency and Critical Care Medicine, Graduate School of Medicine, University of the Ryukyus, Okinawa, Japan
3Faculty of Biomedical Engineering, Department of Health-Promotion and Sports Science, Osaka Electro-Communication University, Osaka, Japan
4Department of Public Health and Hygiene, Graduate School of Medicine, University of the Ryukyus, Okinawa, Japan
5Faculty of Medicine, Advanced Medical Research Center, University of the Ryukyus, Okinawa, Japan
6Department of Applied Physiology, Institute for the Promotion of Common Education, Kyoto Sangyo University, Kyoto, Japan
Received: May 10, 2017 Accepted: February 26, 2018
This study aimed to evaluate neuromuscular activation in the scalene and sternocleidomastoid muscles using surface electromyography (EMG) during progressively increased inspiratoryflow, produced by increasing the respiratory rate under inspiratory-resistive loading using a mask ventilator. Moreover, we attempted to identify the EMG inflection point (EMGIP) on the graph, at which the root mean square (RMS) of the EMG signal values of the inspiratory muscles against the inspiratoryflow velocity acceleration abruptly increases, similarly to the EMG anaerobic threshold (EMGAT) reported during incremental-resistive loading in other skeletal muscles. We measured neuromuscular activation of healthy male subjects and found that the inspiratoryflow velocity increased by approximately 1.6-fold. We successfully observed an increase in RMS that corresponded to inspiratoryflow acceleration withρ≥0.7 (Spearman’s rank correlation) in 17 of 27 subjects who completed the experimental protocol. To identify EMGIP, we analyzed thefitting to either a straight or non-straight line related to the increasing inspiratoryflow and RMS using piecewise linear spline functions. As a result, EMGIPwas identified in the scalene and sternocleidomastoid muscles of 17 subjects. We believe that the identification of EMGIPin this study infers the existence of EMGATin inspiratory muscles. Application of surface EMG, followed by identification of EMGIP, for evaluating the neuromuscular activation of respiratory muscles may be allowed to estimate the signs of the respiratory failure, including labored respiration, objectively and non-invasively accompanied using accessory muscles in clinical respiratory care.
Keywords:inspiratoryflow, neuromuscular activation, inspiratory muscle, surface electromyography, piecewise linear spline functions, electromyography anaerobic threshold
Corresponding author: Hiroshi Sekiguchi
Department of Emergency and Critical Care Medicine, Graduate School of Medicine, University of the Ryukyus 207 Uehara, Nishihara, Okinawa 903-0215, Japan
Phone: +81 98 895 3331; Fax: +81 98 895 1284; E-mail:k138723@eve.u‑ryukyu.ac.jp
Introduction
Abnormally rapid respiration (tachypnea) may arise due to several pathophysiological conditions, such as fever, arterial hypoxemia, metabolic acidosis, anxiety, atelectasis, and pain (42). An extremely large increase in the inspiratory rate may lead to more serious problems (30, 37). In such situations, the tidal volume moderately decreases and the breathing frequency substantially increases with increases in minute ventilation (20,38).
However, a further prominent increase in the respiratory rate with fasterflow velocity in the airways increases the airflow resistance (3). In this instance of clinical setting, it is extremely important to objectively evaluate changes in the strength and endurance of respiratory muscle contraction in patients with tachypnea attempting to wean from a mechanical ventilator.
Prolonged tachypnea might lead to the deterioration of the physical status (e.g., respiratory failure). However, attempts at evaluating respiratory muscle contraction via visual–tactile examination based on recognition of the labored respiration pattern and accessory muscle use, which is used in the clinical setting on a daily basis, usually result in failure, because these procedures, although non-invasive, are not sufficient for quantification and they lack reproducibility (13,34).
Respiratory and other skeletal muscles are controlled by rate coding and recruitment of motor units (MUs). Electromyography (EMG) can objectively and quantitatively evaluate the muscle contraction. Surface EMG (SEMG) is particularly useful because of its non- invasive characteristic. Analysis based on the EMG root mean square (RMS) is widely used to evaluate the muscle contraction, including increases infiring rates, MU recruitment, and other variables (12, 26). Electrophysiological studies during progressive-resistance exer- cises such as cycling (5) have revealed that skeletal muscles recruit small MUs before recruiting larger MUs. This is considered to be based on the load resistance according to the size principle (11, 14), with the subsequent recruitment of larger MUs (fast fibers) (1) triggered by the anaerobic threshold (AT) related to anaerobic metabolism (28). Further- more, SEMG can identify the EMGAT, as the point at which the RMS values increase abruptly (4,10,21,25).
Regarding previous studies of respiratory muscles related to increasing neuromuscular activation against increases in resistive loading, animal experiments found that MUs of respiratory muscles such as fastfibers are recruited in response to tachypnea with an increase in the inspiratory flow (7, 8). Meanwhile, there are few studies in humans reporting the existence of respiratory muscle EMGAT (2,17,24,29,33,36).
Perlovitch et al. (31) reported increases in the SEMG signals of the sternocleidomastoid and intercostal muscles in response to increases in the marching speed on the treadmill, and identified a point at which the RMS values on the graph abruptly increase; however, they did not link factors, such as changes of the respiratory rate, inspiratory time, and respiratoryflow, to increased neuromuscular activation and the abrupt increase of RMS values on the graph. If the concept of EMGAT can be considered for evaluating neuromuscular activation of the respiratory muscles using SEMG, it may also be beneficial to clinical patients requiring respiratory care (e.g., for estimating signs of respiratory failure). This study attempted to non- invasively and quantitatively obtain basic data regarding neuromuscular activation in the scalene and sternocleidomastoid muscles using SEMG during progressive increases in respiratory rates in healthy male subjects. However, in humans, precise research on respiratory muscle activity during spontaneous breathing requires incremental-resistive exercise under a controlled constant tidal volume, which is technically difficult to achieve.
Therefore, this study used progressive increases in inspiratoryflow produced by increasing the respiratory rate using a mask ventilator as an incremental-resistive loading of other skeletal muscles. To minimize risks to participants, this study framed a voluntary rapid respiration characterized by a progressive reduction in the inspiratory time with an increasing respiratory rate under inspiratory-resistive loading (6). Therefore, it was contrived to make the neuromuscular activation of the inspiratory muscles with increased inspiratory flow detectable in the shortest possible time.
In addition, we attempted to identify the EMG inflection point (EMGIP) of the inspiratory muscles, defined as the point of abrupt increases of the RMS values on the graph, similar to the EMGATobserved in other skeletal muscles. We believe that the detection of EMGIPin this study infers the existence of EMGAT in respiratory muscles.
Materials and Methods Human subjects
This is a cross-sectional study in which 31 healthy non-smoking men involved in recreational sports (e.g., basketball and cycling) participated in the experiment. All experimental subjects were free of cardiorespiratory diseases, such as pulmonary emphysema, bronchial asthma, pneumothorax, hyperventilation syndrome, angina, and myocardial infarction. In addition, the subjects performed pulmonary function tests using a spirometer, revealing no abnormali- ties, such as obstructive, restrictive, and mixed pulmonary diseases. This study was approved by the Ethics Committees of the University of the Ryukyus (approval no. 835) and performed according to the ethical standards of the Declaration of Helsinki for human experimentation.
Each subject provided written informed consent after receiving a thorough explanation of the experiment.
Apparatus and EMG capture system
A ventilator (NewportTMHT-70; Newport Medical, Costa Mesa, CA, USA) was used for non-invasive mask ventilation. The inspiratory-resistive load was generated by setting the pressure trigger of the ventilator to−9 cm H2O, the most insensitive inspiratory trigger setting for this equipment. The ventilator setting was adjusted to the spontaneous respiration mode, and a facial mask was used without an expiratory port (Amara-SE full face mask;
Respironics, Murrysville, PA, USA). This mask was tightly held in place by an elastic band encircling the head. The pressure-support ventilation setting was deactivated and the positive end-expiratory pressure was set to 0. Successful ventilation through the mask over the inspiratory-resistive load was confirmed by an inspiratory trigger light. EMG signals from the scalene and sternocleidomastoid muscles were measured using pairs of transcutaneous applied bipolar SEMG electrodes (20-mm diameter, silver/silver chloride, Natus®; Natus Neurology, Middleton, WI, USA) connected to a Viking Quest version 12 recording system (CareFusion, Middleton, WI, USA). Interelectrode impedance was minimized by abrading the skin using an abrasive powder applied with an alcohol-treated cotton. To minimize the interference from the sternocleidomastoid muscle when measuring the scalene EMG signals, the electrode was placed on the skin above the right middle scalene muscle under ultrasonographic observation (7.5-MHz linear probe) (39). The electrode for the sternocleidomastoid muscle was placed on the skin 5 cm rightward at the thyroid cartilage level. Electrodes were attached to the skin with vinyl tape at 2-cm distance. The reference
electrode was solidly attached to the right acromion. Electrode locations are shown in Fig.1.
Before the experiments, the baseline noise of the SEMG wave was checked. Upon detecting considerable noise, additional skin abrasion was attempted before electrode reattachment.
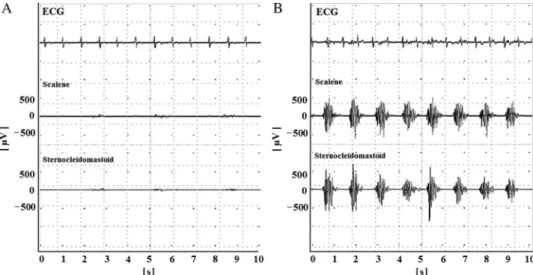
The input impedance of the amplifier was set at 200 MΩ. The common mode rejection ratio was 110 dB. The Ham filter was turned off, and the band-passfilter was set between 20 Hz and 3 kHz. Raw EMG signals are shown in Fig.2. Analog EMG signals were digitized at 16 bits and a maximal sampling rate of 100 kHz. Digitized signals were stored on a portable
Fig. 1.Locations of electrode placed on the body surface. A:
Reference electrode on the acromion. B: Measurement electrode for the right middle
scalene muscle. C:
Measurement electrode for the right sternocleidomastoid muscle. D: Thyroid cartilage
Fig. 2.Raw electromyography (EMG) data and electrocardiogram (ECG). Representative raw EMG data of the scalene and sternocleidomastoid muscles with ECG. Respiratory rhythm at A, 26 breaths/min. Inspiratory time of the metronome, 1 s. B, 50 breaths/min. Inspiratory time of the metronome, 0.4 s. The top rows of the traces are ECGs, and the second and third rows are scalene and sternocleidomastoid EMGs, respectively. The vertical axis shows the
amplitude (μV) of the EMG. The horizontal axis shows time (s)
computer. When the respiratory rate became constant, which usually required approximately five breaths, 10 s of raw EMG signals were calculated using an analysis function installed in the acquisition system. The signal strength was quantified using RMS, which is the square root of the average power of the raw EMG signal over a certain time interval. RMS was calculated according to the following formula:
RMSðkÞ=
ffiffiffiffiffiffiffiffiffiffiffiffiffiffiffiffiffiffiffiffiffiffiffiffiffiffi 1
N XN=2
j=−N=2
x2 vu
ut ðkþjÞ,
where k is a midpoint time of analysis interval,N is the number of EMG samplings per duration, andxis EMG signal.
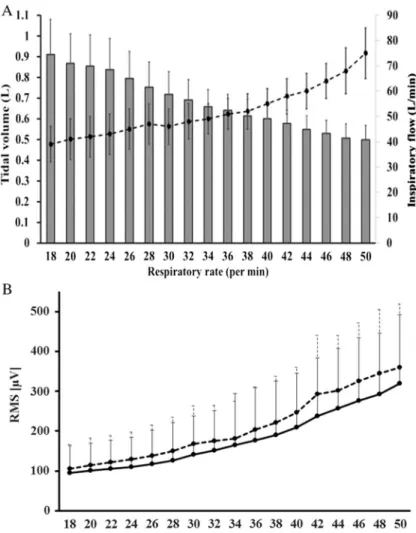
For data analysis and presentation, as shown in the graph of the bottom panel of Fig.3, the respiratory rate (breaths/min) was set as the horizontal axis and the RMS (μV) served as the vertical axis.
Experimental procedure
The experimental procedure for measuring the neuromuscular activation of the inspiratory muscles by generating an increase in inspiratory flow velocity was as follows.
During the experiment, the subjects were placed in the Fowler’s position at 45°.
Subjects were instructed to achieve a specified respiratory rate by following a metronome. Once the electrodes and facial mask were attached, subjects were acclimated to the experimental protocol by breathing at 16 breaths/min for 2 min with intermittent breaks. Subjects were instructed to follow the metronome rhythm to adjust the respiratory rhythm. Inspiration was performed against a constant −9 cm H2O resistive load.
However, the exact tidal volume was dependent on the inspiratory effort. The metronome pace was adjusted to increase the respiratory rate by two breaths/min in a stepwise manner. The inspiratory:expiratory time ratio of the metronome was 1:2. The total respiratory cycle time was defined as the time (s/breath) required for a complete respiration cycle, which was calculated from the respiratory rate. The total respira- tory cycle time was gradually decreased by 0.15 s steps from 3.75 (respiratory rate, 16 breaths/min) to 1.2 s (respiratory rate, 50 breaths/min), and inspiratory time was decreased in parallel from 1.25 (respiratory rate, 16 breaths/min) to 0.4 s (respiratory rate, 50 breaths/min) in 0.05-s steps. The average tidal volume was automatically calculated and then displayed on the ventilator. Once the recording at a given respiratory rate was completed, the rhythm of the metronome was stopped for approximately 20 s to allow a brief period of quiet unpaced breathing before moving to the next measurement session at a higher respiratory rate with a shorter cycle. This procedure was intermittently repeated to a maximum of 50 breaths/min or until the subject complained of fatigue or numbness/discomfort in fingers, lips, and/or mouth, which may be due to hyperventilation- induced tetany.
Calculation of tidal volumes, inspiratoryflows, and RMS
After each recording, the mean inspiratoryflow (L/min) was calculated from the recorded tidal volume (ml) and inspiratory time (s). The tidal volume (ml), the inspiratoryflow (L/min), and the RMS are expressed as the mean±standard deviation. The tidal volume and RMS were analyzed using the Friedman test, and the differences were considered
significant atp<0.05 within the range of the initial RMS at 18 breaths/min (inspiratory time, 1.2 s) and the last measured RMS at 50 breaths/min (inspiratory time, 0.4 s). We calculated RMS ratios by comparing each RMS with that measured at an inspiratory time of 1.2 s (18 breaths/min). Regarding whether the inspiratory flow increased with the progressively increasing respiratory rate in our experimental system, the correlation between the increase in the respiratory rate (i.e., decreasing inspiratory time) and that of
Fig. 3.Relationships of increases in the respiratory rate with the mean tidal volume, mean inspiratoryflow, and mean root mean square (RMS). A (top): Changes in the mean tidal volumes and mean inspiratoryflow as the respiratory rate increased (i.e., inspiratory time decreased) for all 27 subjects. The vertical axis on the left shows the tidal volume (L). The vertical axis on the right shows the inspiratoryflow (L/min). The horizontal axis shows the respiratory rate (breaths/min). The bar graph shows the mean tidal volumes. The dotted line shows the mean inspiratoryflow. Error bars indicate standard deviation. B (bottom): Changes in the mean RMS of the scalene and sternocleidomastoid muscles as the respiratory rate increased for all 27 subjects. The solid line shows the scalene muscle RMS, and the dotted line shows the sternocleidomastoid muscle RMS. The vertical axis shows RMS (μV). The horizontal axis
shows the respiratory rate (breaths/min). Error bars indicate standard deviation
the inspiratory flow was analyzed using the Spearman’s rank correlation. Correlation coefficients (ρ)≥0.7 (p<0.05) indicated a strong correlation.
Identification of EMGIP
For subjects with strong correlations between the increase in the respiratory rate and the inspiratoryflow, we examined whether the relationship between the inspiratoryflow and the RMS could be represented as a straight line using piecewise linear spline functions (9,43) such as
RMS=β0þβ1xþβ2ðx−knotÞþ
0, if x−knot<0 x −knot, if x −knot≥0,
whereβis the regression coefficient,xis the inspiratoryflow, and knot is a point at which the slope of the line changed.
Knot represented EMGIPin this study. A set of candidates of knot was set one by one from the 10th to the 90th percentile, and we fitted 31 models consisting of one simple regression and 30 piecewise linear regression models. We selected the best model by comparing the adjusted coefficient of determination. The JMP®statistical package (version 196 13.1; SAS Institute, Tokyo, Japan) was used for all statistical analyses.
Results Tidal volumes, inspiratoryflows, and RMS values
The subjects’mean age, height, weight, and vital capacity were 31±6 years, 171±7 cm, 67±8 kg, and 4.596±600 ml, respectively. Twenty-seven subjects successfully completed the experimental protocol with no adverse events, such as numbness and/or discomfort in the fingers, lips, or mouth, due to hyperventilation-induced tetany. Three subjects withdrew from the experiment before completing all respiratory experimental conditions due to fatigue, and one subject refused to continue during the warm-up phase because of an oppressive feeling associated with the facial mask. Panel A in Fig.3shows the changes in the mean tidal volume and inspiratoryflow as the respiratory rate increased (i.e., decreasing inspiratory time) for 27 subjects. The tidal volume progressively decreased with shorter inspiratory times. Conversely, the inspiratory flow velocity for these 27 subjects increased by approximately 1.6-fold as the inspiratory time decreased from 1.2 (18 breaths/min) to 0.4 s (50 breaths/min). Panel B in Fig.3shows the change in the mean RMS with increasing respiratory rates for 27 subjects.
RMS progressively increased as the respiratory rate increased in all tested muscles. The RMS ratio at 50 breaths/min in the scalene muscle was 3.9-fold higher than that at 18 breaths/min, whereas that in the sternocleidomastoid muscle increased by 4.4-fold over the same range.
These changes in tidal volume and RMS values from the lowest to the highest respiratory rate were statistically significant (p<0.0001). The results of the correlation analysis between the increase in the respiratory rate (i.e., decreasing inspiratory time) and that in the inspiratory flow are presented in Table I. A strong correlation (ρ≥0.7) between these variables was observed in 17 subjects.
Identification of EMGIP
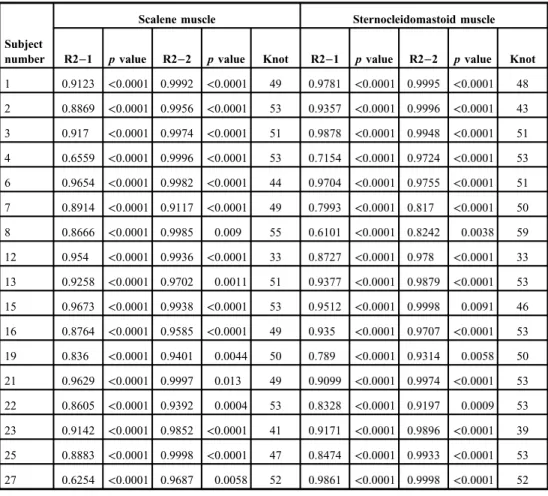
The results for the analysis of the relationship between the inspiratoryflow and RMS using piecewise linear spline functions are shown in Table II. All 17 subjects who exhibited
a strong correlation between the increase in the respiratory rate and the inspiratoryflow had a non-straight line featuring a knot on the graph. The results for knot are also presented in TableII, and representative graphs of knot are shown in Figs4and5.
Table I.Correlation of the increase in respiratory rate with inspiratoryflow
Increase in respiratory rate versus inspiratoryflow
Subject number ρ pvalue
1 0.9988 <0.0001
2 1.0000 <0.0001
3 0.9994 <0.0001
4 0.9994 <0.0001
5 0.6515 0.0046
6 0.9920 <0.0001
7 0.9772 <0.0001
8 1.0000 <0.0001
9 0.5612 0.0191
10 0.4512 0.0794
11 0.6663 0.0035
12 0.9988 <0.0001
13 0.9113 <0.0001
14 0.3054 0.2332
15 1.0000 <0.0001
16 0.7301 0.0009
17 0.6495 0.0048
18 0.6523 0.0045
19 0.9822 <0.0001
20 0.6313 0.0066
21 1.0000 <0.0001
22 1.0000 <0.0001
23 0.9914 <0.0001
24 0.6499 0.0047
25 0.9994 <0.0001
26 0.6363 0.0060
27 0.9994 <0.0001
Correlation coefficient (ρ): Spearman’s rank correlation coefficient;pvalue:pvalue of the correlation
Discussion
The major finding of this study was the graphical identification of EMGIP in inspiratory muscles. We believe that this is the first study to identify EMGIP in the scalene and sternocleidomastoid muscles using SEMG under the condition of progressive inspiratory flow velocity produced by increasing the respiratory rate and shortening the inspiratory time using a mask ventilator (2,17,24,29,31,33,36). In addition, the existence of EMGIPinfers the existence of EMGATin inspiratory muscles.
Citterio et al. (8) studied the activity of single parasternal intercostal musclefibers and single diaphragm fibers in rabbits and found that increasing the respiratory rate under hyperthermia was accompanied by a comparatively faster respiratory movement speed, resulting in rapid musclefiber recruitment. Similarly, we found that the average inspiratory flow was increased by progressively reducing the inspiratory time. Although it is purely speculative, because this study used SEMG, considering the increase in the inspiratory
Table II.Detection of EMGIP
Scalene muscle Sternocleidomastoid muscle Subject
number R2−1 pvalue R2−2 pvalue Knot R2−1 pvalue R2−2 pvalue Knot 1 0.9123 <0.0001 0.9992 <0.0001 49 0.9781 <0.0001 0.9995 <0.0001 48 2 0.8869 <0.0001 0.9956 <0.0001 53 0.9357 <0.0001 0.9996 <0.0001 43 3 0.917 <0.0001 0.9974 <0.0001 51 0.9878 <0.0001 0.9948 <0.0001 51 4 0.6559 <0.0001 0.9996 <0.0001 53 0.7154 <0.0001 0.9724 <0.0001 53 6 0.9654 <0.0001 0.9982 <0.0001 44 0.9704 <0.0001 0.9755 <0.0001 51 7 0.8914 <0.0001 0.9117 <0.0001 49 0.7993 <0.0001 0.817 <0.0001 50 8 0.8666 <0.0001 0.9985 0.009 55 0.6101 <0.0001 0.8242 0.0038 59 12 0.954 <0.0001 0.9936 <0.0001 33 0.8727 <0.0001 0.978 <0.0001 33 13 0.9258 <0.0001 0.9702 0.0011 51 0.9377 <0.0001 0.9879 <0.0001 53 15 0.9673 <0.0001 0.9938 <0.0001 53 0.9512 <0.0001 0.9998 0.0091 46 16 0.8764 <0.0001 0.9585 <0.0001 49 0.935 <0.0001 0.9707 <0.0001 53 19 0.836 <0.0001 0.9401 0.0044 50 0.789 <0.0001 0.9314 0.0058 50 21 0.9629 <0.0001 0.9997 0.013 49 0.9099 <0.0001 0.9974 <0.0001 53 22 0.8605 <0.0001 0.9392 0.0004 53 0.8328 <0.0001 0.9197 0.0009 53 23 0.9142 <0.0001 0.9852 <0.0001 41 0.9171 <0.0001 0.9896 <0.0001 39 25 0.8883 <0.0001 0.9998 <0.0001 47 0.8474 <0.0001 0.9933 <0.0001 53 27 0.6254 <0.0001 0.9687 0.0058 52 0.9861 <0.0001 0.9998 <0.0001 52 R2–1: adjusted coefficient of determination; R2–2: adjusted coefficient of determination based on the piecewise linear spline;pvalue: significance probability of each explanatory variable; Knot: electromyographic inflection point (EMGIP) on thexaxis calculated using mathematics
movement speed, we suppose it is possible that both the firing rate and the recruitment of relatively larger MUs within the inspiratory muscles, such as fast fibers, increased in accordance with the findings of previous studies on other skeletal muscles (7, 8).
The concomitant increase in RMS with the progressive increase in the respiratory rate (i.e., progressive reduction in inspiratory time) implies that the recruitment of larger and greater numbers of MUs was induced by inspiratory loading concomitant with increases in inspiratory flow. MU recruitment is based on the size principle (11, 14), with the later
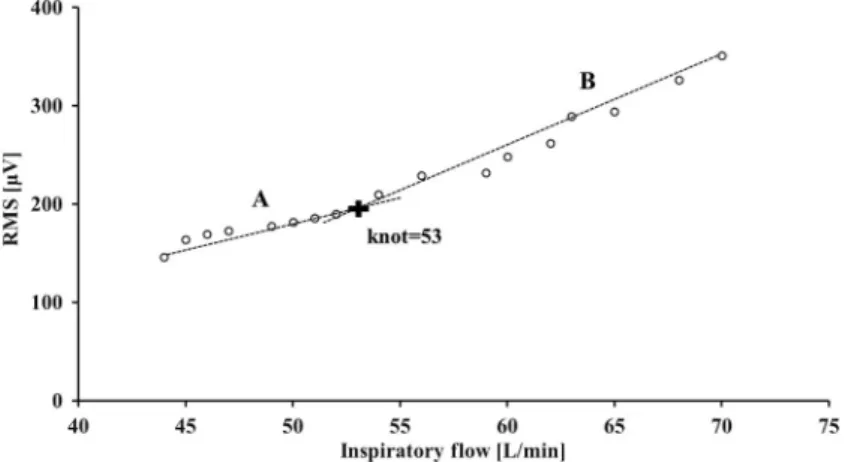
Fig. 4.Representative graphs of knot obtained from the scalene muscle of subject no. 15. The vertical and horizontal axes show the root mean square (RMS,μV) and inspiratoryflow (L/min), respectively. The black cross mark indicates the position of knot. The dotted line A represents the regression line from the minimum inspiratoryflow value to knot, and the dotted line B represents the regression line from knot to the maximum inspiratoryflow value
Fig. 5.Representative graphs of knot obtained from the sternocleidomastoid muscle of subject no. 4. The vertical and horizontal axes show the root mean square (RMS,μV) and inspiratoryflow (L/min), respectively. The black cross mark indicates the position of knot. The dotted line A represents the regression line from the minimum inspiratoryflow value to knot, and the dotted line B represents the regression line from knot to the maximum
inspiratoryflow value
recruitment of larger MUs such as fastfibers triggered by anaerobic metabolism and lactate accumulation (40).
The aforementioned lactate threshold related to anaerobic metabolism can be identi- fied using SEMG. This threshold is correlated with increased blood lactate levels and it has been confirmed in other skeletal muscles as EMGATduring incremental-resistive exercise (22). Therefore, we examined the graphical relationship between the inspiratoryflow and the RMS for each subject and found that exhibited an IP at which the RMS value abruptly increased (Figs4and5), suggesting the existence of the AT as identified in other skeletal muscles.
We used mathematical methods to identify EMGIP as described previously (10,19).
Arbitrary elements cannot be denied in the detection of EMGIP, which relied only on graphs and visual judgment. We used piecewise linear spline functions (9,43) to ensure objectivity and reproducibility. However, it is undeniable that EMGIP is only a graphical variable calculated using a mathematical method as we did not directly determine blood lactate levels.
Further studies are necessary to fully demonstrate the existence of EMGATin respiratory muscles by focusing on the relationship between RMS and blood lactate levels. In addition, our subjects had variable different EMGIPthresholds. One explanation for this variability is that there may have been differences in the exercise and training experiences of each subject, leading to differences in muscle properties, such as the aerobic–anoxic metabolic threshold (27) and the intramuscular lactate shuttle system (18).
Clinically, it is extremely valuable to apply SEMG as an objective and non-invasive evaluation tool for the neuromuscular activation of respiratory muscles in clinical respiratory care (35) as the evaluation of abnormally rapid respiration was previously based on the subjective assessment of respiratory muscle contraction, on the pattern of labored respiration, or the use of accessory muscles via visual observation and palpation (16,23). In addition, respiratory failure due to excessive respiratory muscle use is often recognized at a deterio- rated state using invasive arterial blood gas analysis. The findings of this study may be applicable to patients in the clinical setting who exhibit increased inspiratory flow and respiratory rates. In particular, if EMGAT can be used to evaluate the neuromuscular activation of respiratory muscles using SEMG, it may be possible to non-invasively estimate the signs of respiratory failure.
This study had several limitations. Thefirst limitation was that EMGIPcould only be identified in a limited number of subjects. We believe this is related to the limits of the experimental system, such as the control of the tidal volume and the increase in the inspiratory flow velocity. However, in humans, precise research on respiratory muscle activity during spontaneous breathing requires incremental-resistive exercise performed under a controlled constant tidal volume, which is technically difficult to perform. Therefore, although this study was performed under limited conditions during experimental voluntary rapid respiration with progressive increases in inspiratory flow velocity produced by increasing the respiratory rate, our findings suggest the existence of EMGIPin inspiratory muscles during increased neuromuscular activation of inspiratory muscles. Further studies are necessary to verify these findings under conditions of a nearly constant tidal volume during spontaneous breathing. Second, SEMG was used in this study; therefore, it is necessary to recognize that contamination of the action potential from other adjacent muscles cannot be completely prevented.
Third, a few subjects withdrew from the study. Inspiratory-resistive loading was added; therefore, we believe that fatigue was inevitable. However, we considered that
with appropriate rest time and randomization of the experimental protocols, it might be possible to reduce the withdrawal rate in future studies. Fourth, to capture neuromus- cular activation based on increases in the RMS over a short period to minimize the risks to participants, the experiments were performed under controlled but non-physiological conditions, including a progressive increase in the respiratory rate with a corresponding reduction of the inspiratory duration under constant respiratory-resistive loading. In other words, the conditions may have differed from those of normal tachypnea.
Similarly, all subjects were relatively young healthy males, because subjects who can endure a load due to increased inspiratory flow were necessary to identify EMGIP. Therefore, in terms of respiratory physiology, the rapid respiration performed by subjects in this study may not be strictly analogous to that in typical respiratory care patients. However, in the clinical setting, patients facing long-term inactivity with long- term mechanical ventilator support may experience muscle atrophy (15, 32). Thus, increased firing rate and the recruitment of larger MUs (41) may occur at smaller increases in the inspiratory flow velocity.
Conclusions
This study graphically identified EMGIPof inspiratory muscles based on the relationship between progressive increases in inspiratoryflow velocity and RMS. The inspiratory muscles analyzed in this study were suggested to possess the AT.
Acknowledgements
This study was funded by a Public Interest at the University of the Ryukyus Support Foundation Grant.
Conflict of interest
The authors declare no conflict of interest.
REFERENCES
1. Altenburg TM, Degens H, van Mechelen W, Sargeant AJ, de Haan A: Recruitment of single musclefibers during submaximal cycling exercise. J. Appl. Physiol. 103, 1752–1756 (2007)
2. Bai TR, Rabinovitch BJ, Pardy RL: Near-maximal voluntary hyperpnea and ventilatory muscle function. J.
Appl. Physiol. Respir. Environ. Exerc. Physiol. 57, 1742–1748 (1984)
3. Butler JE, McKenzie DK, Gandevia SC: Discharge properties and recruitment of human diaphragmatic motor units during voluntary inspiratory tasks. J. Physiol. 518, 907–920 (1999)
4. Candotti CT, Loss JF, Melo Mde O, La Torre M, Pasini M, Dutra LA: Comparing the lactate and EMG thresholds of recreational cyclists during incremental pedaling exercise. Can. J. Physiol. Pharmacol. 86, 272–278 (2008)
5. Chapman AR, Vicenzino B, Blanch P, Hodges PW: Patterns of leg muscle recruitment vary between novice and highly trained cyclists. J. Electromyogr. Kinesiol. 18, 359–371 (2008)
6. Chiti L, Biondi G, Morelot-Panzini C, Raux M, Similowski T, Hug F: Scalene muscle activity during progressive inspiratory loading under pressure support ventilation in normal humans. Respir. Physiol. Neurobiol. 164, 441–448 (2008)
7. Citterio G, Agostoni E, Piccoli S, Sironi S: Selective activation of parasternal muscle fibers according to breathing rate. Respir. Physiol. 48, 281–295 (1982)
8. Citterio G, Sironi S, Piccoli S, Agostoni E: Slow to fast shift in inspiratory musclefibers during heat tachypnea.
Respir. Physiol. 51, 259–274 (1983)
9. Edwards LJ, Stewart PW, MacDougall JE, Helms RW: A method forfitting regression splines with varying polynomial order in the linear mixed model. Stat. Med. 25, 513–527 (2006)
10. Ertl P, Kruse A, Tilp M: Detecting fatigue thresholds from electromyographic signals: a systematic review on approaches and methodologies. J. Electromyogr. Kinesiol. 30, 216–230 (2016)
11. Farina D, Macaluso A, Ferguson RA, De Vito G: Effect of power, pedal rate, and force on average musclefiber conduction velocity during cycling. J. Appl. Physiol. 97, 2035–2041 (2004)
12. Farina D, Merletti R, Enoka RM: The extraction of neural strategies from the surface EMG. J. Appl. Physiol.
96, 1486–1495 (2004)
13. Figueroa-Casas JB, Broukhim A, Vargas A, Milam L, Montoya R: Inter-observer agreement of spontaneous breathing trial outcome. Respir. Care 59, 1324–1328 (2014)
14. Fling BW, Knight CA, Kamen G: Relationships between motor unit size and recruitment threshold in older adults: implications for size principle. Exp. Brain Res. 197, 125–133 (2009)
15. Gea J, Pascual S, Casadevall C, Orozco-Levi M, Barreiro E: Muscle dysfunction in chronic obstructive pulmonary disease: update on causes and biologicalfindings. J. Thorac. Dis. 7, 418–438 (2015)
16. Haas CF, Loik PS: Ventilator discontinuation protocols. Respir. Care 57, 1649–1662 (2012)
17. Hawkes EZ, Nowicky AV, McConnell AK: Diaphragm and intercostal surface EMG and muscle performance after acute inspiratory muscle loading. Respir. Physiol. Neurobiol. 155, 213–219 (2007)
18. Helal JN, Guezennec CY, Goubel F: The aerobic-anaerobic transition: re-examination of the threshold concept including an electromyographic approach. Eur. J. Appl. Physiol. Occup. Physiol. 56, 643–649 (1987) 19. Hug F, Laplaud D, Lucia A, Grelot L: A comparison of visual and mathematical detection of the electromyo-
graphic threshold during incremental pedaling exercise: a pilot study. J. Strength Cond. Res. 20, 704–708 (2006) 20. Johnson BD, Babcock MA, Suman OE, Dempsey JA: Exercise-induced diaphragmatic fatigue in healthy
humans. J. Physiol. 460, 385–405 (1993)
21. Jurimae J, von Duvillard SP, Maestu J, Cicchella A, Purge P, Ruosi S, Jurimae T, Hamra J: Aerobic-anaerobic transition intensity measured via EMG signal in athletes with different physical activity patterns. Eur. J. Appl.
Physiol. 101, 341–346 (2007)
22. Lucia A, Sanchez O, Carvajal A, Chicharro JL: Analysis of the aerobic-anaerobic transition in elite cyclists during incremental exercise with the use of electromyography. Br. J. Sports Med. 33, 178–185 (1999) 23. Macintyre NR: Evidence-based assessments in the ventilator discontinuation process. Respir. Care 57,
1611–1618 (2012)
24. Mador MJ, Acevedo FA: Effect of inspiratory muscle fatigue on breathing pattern during inspiratory resistive loading. J. Appl. Physiol. 70, 1627–1632 (1991)
25. Matsuura R, Arimitsu T, Yunoki T, Kimura T, Yamanaka K, Yano T: Effects of deception for intensity on surface electromyogram (SEMG) activity and blood lactate concentration during intermittent cycling followed by exhaustive cycling. Acta Physiol. Hung. 100, 54–63 (2013)
26. Merletti R, Rainoldi A, Farina D: Surface electromyography for noninvasive characterization of muscle. Exerc.
Sport Sci. Rev. 29, 20–25 (2001)
27. Monks L, Seo MW, Kim HB, Jung HC, Song JK: High-intensity interval training and athletic performance in Taekwondo athletes. J. Sports Med. Phys. Fitness 57, 1252–1260 (2017)
28. Moritani T, Sherman WM, Shibata M, Matsumoto T, Shinohara M: Oxygen availability and motor unit activity in humans. Eur. J. Appl. Physiol. Occup. Physiol. 64, 552–556 (1992)
29. Nadiv Y, Vachbroit R, Gefen A, Elad D, Zaretsky U, Moran D, Halpern P, Ratnovsky A: Evaluation of fatigue of respiratory and lower limb muscles during prolonged aerobic exercise. J. Appl. Biomech. 28, 139–147 (2012) 30. Parkash A, Haider N, Khoso ZA, Shaikh AS: Frequency, causes and outcome of neonates with respiratory distress admitted to Neonatal Intensive Care Unit, National Institute of Child Health, Karachi. J. Pak. Med.
Assoc. 65, 771–775 (2015)
31. Perlovitch R, Gefen A, Elad D, Ratnovsky A, Karamer MR, Halpern P: Inspiratory muscles experience fatigue faster than the calf muscles during treadmill marching. Respir. Physiol. Neurobiol. 156, 60–68 (2007) 32. Powers SK, Wiggs MP, Sollanek KJ, Smuder AJ: Ventilator-induced diaphragm dysfunction: cause and effect.
Am. J. Physiol. Regul. Integr. Comp. Physiol. 305, R464–R477 (2013)
33. Ramirez G, Hermans G, Troosters T: The assessment of inspiratory muscle fatigue in healthy individuals:
a systematic review. Respir. Med. 107, 331–346 (2013)
34. Scheinhorn DJ, Chao DC, Stearn-Hassenpflug M, Wallace WA: Outcome in post-ICU mechanical ventilation:
a therapist-implemented weaning protocol. Chest 119, 236–242 (2001)
35. Schmidt M, Chiti L, Hug F, Demoule A, Similowski T: Surface electromyogram of inspiratory muscles:
a possible routine monitoring tool in the intensive care unit. Br. J. Anaesth. 106, 913–914 (2011)
36. Segizbaeva MO, Donina ZhA, Timofeev NN, Korolyov YN, Golubev VN, Aleksandrova NP: EMG analysis of human inspiratory muscle resistance to fatigue during exercise. Adv. Exp. Med. Biol. 788, 197–205 (2013) 37. Shaikh H, Morales D, Laghi F: Weaning from mechanical ventilation. Semin. Respir. Crit. Care Med. 35,
451–468 (2014)
38. Sheel AW: Respiratory muscle training in healthy individuals: physiological rationale and implications for exercise performance. Sports Med. 32, 567–581 (2002)
39. Usui Y, Kobayashi T, Kakinuma H, Watanabe K, Kitajima T, Matsuno K: An anatomical basis for blocking of the deep cervical plexus and cervical sympathetic tract using an ultrasound-guided technique. Anesth. Analg.
110, 964–968 (2010)
40. Wasserman K, Whipp BJ: Exercise physiology in health and disease. Am. Rev. Respir. Dis. 112, 219–249 (1975)
41. Wernbom M, Jarrebring R, Andreasson MA, Augustsson J: Acute effects of bloodflow restriction on muscle activity and endurance during fatiguing dynamic knee extensions at low load. J. Strength Cond. Res. 23, 2389–2395 (2009)
42. Wilkins RL, Stoller JK, Kacmarek RM (2009): Egan’s Fundamentals of Respiratory Care (9th ed.). Mosby Elsevier, St. Louis, MO
43. Xu C, Kwong JS, Zhang C: The use of piecewise linear spline function on dose-response meta-analysis. Ann.
Transl. Med. 4, 389 (2016)