Journal of Chromatography B 1185 (2021) 123004
Available online 21 October 2021
1570-0232/© 2021 The Author(s). Published by Elsevier B.V. This is an open access article under the CC BY license (http://creativecommons.org/licenses/by/4.0/).
Acetylcholinesterase inhibitors in the giant goldenrod root
Agnes M. M ´ oricz ´
*, D ´ aniel Krüzselyi, Vir ´ ag Lapat, P ´ eter G. Ott
Plant Protection Institute, Centre for Agricultural Research, ELKH, Herman O. Str. 15, 1022 Budapest, Hungary
A R T I C L E I N F O Keywords:
Solidago gigantea Ait. (giant goldenrod) HPTLC-acetylcholinesterase assay HPTLC-vanillin sulphuric acid derivatization Clerodane diterpenes
Effect-directed analysis
A B S T R A C T
Eight bioactive clerodane diterpenes from the root extract of Solidago gigantea Ait. (giant goldenrod) were quantified by high-performance thin-layer chromatography (HPTLC) and two newly developed hyphenated methods. One uses vanillin sulphuric acid derivatization and densitometry, and the other an inhibition assay of acetylcholinesterase (AChE) and video densitometry. Both methods gave figures of merit for quantification including 5.8–33.9 ng and 175.5–448.7 ng LOQs and 2.7–6.9 RSD% and 8.8–13.9 RSD% inter-day precisions, respectively. Based on the diterpenes’ content of 14 root samples collected over a year from the same plant population, the fully flowering plant is suggested to collect the root as a source of these compounds. Excepting one diterpene (with the lowest retardation factor), the quantitative results for the richest sample obtained by the two methods were in harmony. The difference could be due to a matrix effect.
1. Introduction
High-performance thin-layer chromatography (HPTLC) enables the high-throughput screening of plant extracts for bioactive ingredients without time-consuming, expensive, and complicated sample prepara- tion. The open separation system allows the perception of all compounds of the applied crude extracts including those stuck in the application zone or that move with the front line without retardation. The UV/VIS/
FLD detection of the separated compounds can be aided with chemical reagents to improve selectivity and sensitivity [1]. Beyond exploitation of chemical characteristics of the analytes, their biological effect(s) came into focus as a specific detectable feature as well. The normal phase silica gel layers are mainly used for (HP)TLC-bioassays [2,3], however, wettable C18 [4], cellulose, polyamide, neutral alumina [5]
and cyanopropyl [6] layers have also been established as appropriate adsorbents for direct bioautography (DB), i.e., the in situ bioactivity tests. A wide range of bacterial and fungal strains have been introduced to DB to visualize the antimicrobial effect [7] of the compounds sepa- rated by (HP)TLC, and several methods have been developed for coupling (HP)TLC with, e.g., anti-algae [8], estrogenic [4], enzyme inhibitory [9,10] and insect attractant [11] tests.
Generally, the quantitative analysis is carried out with a native or a chemically derivatized chromatogram by spectroscopic (densitometric) or spectrometric techniques. However, biologically active compounds can be quantified based on their bioactivity response. Densitometric or videodensitometric evaluation of the inhibition zones showed
correlation to the applied amount, and linear [12–14], polynomial [15–17], exponential [18], sigmoidal [4], or Michaelis–Menten [19,20]
calibration curves were usable. Equivalency calculation of the plant components by (HP)TLC-bioassay enables the evaluation of their effi- ciency compared to known bioactive compounds [13,17,20,21].
Giant goldenrod (Solidago gigantea Ait.) is an alien and successful invasive species in Europe with a persistent rhizome that represents abundant biomass. Parts of giant goldenrod contain a wide spectrum of bioactive compounds including terpenes (mono-, di- and sesqui- terpenes) [22–24], triterpene glycosides [25] and phenolics (flavonoid aglycons, flavonoid glycosides, and phenolic acids) [26]. Recently, ac- cording to HPTLC-bioassays, components of S. gigantea root extract have been established to exhibit anti-hyperglycemic (α- and β-glucosidase and α-amylase inhibitory) and/or cholinesterase inhibitory and/or antimi- crobial effects [9,24]. Eight clerodane diterpenes from the root were identified as antimicrobial compounds. Zones of the HPTLC chromato- grams of the root extract, corresponding to four of the isolates, showed cholinesterase inhibition in the applied concentration.
This study aimed to confirm and evaluate the acetylcholinesterase (AChE) inhibitory effect of the isolates and to determine the amount of these isolates in the plant root by HPTLC-AChE assay and their variation over a year by HPTLC-vanillin sulphuric acid reagent-Vis. In addition, the two quantification methods were compared.
* Corresponding author at: Plant Protection Institute, Centre for Agricultural Research, ELKH, Herman O. Str. 15, 1022 Budapest, Hungary.
E-mail address: moricz.agnes@atk.hu (A.M. M´ ´oricz).
Contents lists available at ScienceDirect
Journal of Chromatography B
journal homepage: www.elsevier.com/locate/jchromb
https://doi.org/10.1016/j.jchromb.2021.123004
Received 26 July 2021; Received in revised form 14 October 2021; Accepted 15 October 2021
Journal of Chromatography B 1185 (2021) 123004 2. Materials and methods
2.1. Materials
HPTLC silica gel 60 F254 plates or foils were supplied by Merck (Darmstadt, Germany). Vanillin, sodium hydroxide, sodium dihydrogen phosphate dehydrate and dipotassium hydrogen phosphate were from Reanal (Budapest, Hungary). Analytical grade n-hexane, ethyl acetate, ethanol, acetic acid, and gradient grade methanol were purchased from Molar Chemicals (Hal´asztelek, Hungary). Acetylcholinesterase lyophi- lisate (from Electrophorus electricus, AChE), Fast Blue Salt B (95%), and isopropyl acetate were from Sigma (Budapest, Hungary), while 3- indoxyl acetate was from Biosynth (Bratislava, Slovakia). MTT (3-[4,5- Dimethylthiazol-2-yl]-2,5-diphenyltetrazolium bromide) was from Carl Roth (Karlsruhe, Germany). Gram-positive B. subtilis (strain F1276) was a gift by J´ozsef Farkas, Central Food Research Institute, Budapest, Hungary. The eight Solidago gigantea root compounds (“isolates”: Sg1, Sg2, Sg3a, Sg3b, Sg3c, Sg4, Sg5, and Sg6) were isolated and identified by NMR by our group [24] (Table S1).
2.2. Sample preparation
Roots of Solidago gigantea Ait. (at least roots of ten individual plants per sampling) were collected about monthly, 14 times between 2019.03.18 and 2020.02.24 in the Great Plain, Hungary (N 46◦41′52.1′′
E 19◦03′3.6′′Alt. 90 m) from the same population. The fresh roots were gently washed with water, chopped, dried at room temperature, and ground (Sencor SCG 2051BK, Ricany, Czech Republic). Powdered sam- ples were ultrasonicated for 1 min in ethyl acetate (300 mg in 15 mL) and subsequently macerated for 24 h. The filtered crude extract was used for HPTLC. Stock solutions of isolated compounds (2.5 mg/mL in ethanol) were diluted with ethanol to 25 µg/mL and 100 µg/mL final concentration.
2.3. HPTLC method
Root extracts (5 µL/band) and isolated compounds (1–15 µL/band) were applied as 5-mm bands with 8–10 mm track distance onto the HPTLC plate with an Automated TLC Sampler (ATS3, CAMAG, Muttenz, Switzerland) at 8 mm distance from the bottom. HPTLC separation was carried out with n-hexane – isopropyl acetate – acetic acid 40:9:1, V/V/V up to a migration distance of 80 mm in twin trough chamber saturated for 10 min (CAMAG). Plates were dried in a cold stream of air (5 min).
Before the antibacterial assay, the residues of acetic acid were elimi- nated by spraying with phosphate buffer (0.1 M, pH 7.5) using an airbrush (Revell, Bünde, Germany), and then the plate was dried again by a stream of cold air for 5 min. Quantitative evaluations were per- formed after AChE assay or derivatization with vanillin sulphuric acid reagent (40 mg vanillin, 10 mL ethanol, and 200 µL concentrated sul- phuric acid, heated at 110 ◦C for 5 min and documented at UV 365 nm and white light illumination in transmittance mode). The chromato- grams and bioautograms were detected by a UV lamp (CAMAG) and digital camera (Cybershot DSC-HX60, Sony, Neu-Isenburg, Germany) or TLC Scanner 3 (CAMAG). For HPTLC-UV spectra, the zones of interest were selected based on a densitogram recorded at 220 nm wavelength using a deuterium lamp as the light source, and the parameters were as follows: 190–400 nm range, absorption mode, 6 mm × 0.3 mm slit dimension, 100 nm/s scan speed, and 1 nm/step resolution. Densito- metric evaluation of the plate was performed immediately after the derivatization in absorption mode at 550 nm using a wolfram lamp as a light source with the following settings: 6 mm ×0.1 mm slit dimension, 5 mm/s scanning speed, and 50 µm/step resolution.
2.4. HPTLC-EDA
The bacterial cell suspension was prepared and the antibacterial
effect was detected, as described in a previous method using B. subtilis F1276 [27], but the incubations were carried out at 37 ◦C. Briefly, the developed, neutralized plates were immersed into the cell suspension for 8 s. After a 2-h incubation (100% humidity at 37 ◦C), bioautograms were visualized by staining with an aqueous MTT solution (1 mg/mL) fol- lowed by a 0.5-h incubation. Colorless (bright) antibacterial zones were obtained against a bluish background.
The reported HPTLC-AChE inhibition assay [28] was further devel- oped. In contrast to the previous method, first the substrate and then the enzyme was applied to the layer when the neutralization steps and the substrate addition were merged. The substrate (3-indoxyl acetate) was dissolved in DMSO (25 mg in 2 mL) and diluted with 48 mL phosphate buffer (0.1 M, pH 7.5). AChE (5 U/mL), along with bovine serum al- bumin (1 mg/mL), was dissolved in phosphate buffer (0.1 M, pH 7.5).
These solutions were stored in a freezer (at − 20 ◦C). In the course of the test, first, the developed plate was dipped into the substrate solution for 4 s, the excess liquid was gently swept off from the surface with a squeegee. One minute later, the layer was sprayed with the enzyme solution using an airbrush, and after sweeping off the supernatant, it was incubated for 20 min at 37 ◦C and 100% humidity. The active enzyme can cleave the substrate to indoxyl, which can be oxygenated to indigo white. Both products are fluorescent at 366 nm, thus, black zones indicate the active compounds against a blueish-greenish fluorescent background. Images of HPTLC-AChE autograms were processed with ImageJ software (NIH, Bethesda, MA, USA).
2.5. HPTLC-MS
For the mass spectrometric experiments, the online combination of a binary pump (LC-20AB, Shimadzu, Kyoto, Japan), a TLC-MS Interface (CAMAG) using an oval elution head (4 mm × 2 mm) and a single quadrupole electrospray ionization mass spectrometer (LCMS-2020, Shimadzu) were utilized. Zones of interest were eluted with methanol (gradient grade) at a flow rate of 0.2 mL min−1. The mass spectrometric conditions were as follows: the nebulizer gas (N2) flow rate, 1.5 L min−1; the drying gas (N2) flow rate, 10 L min−1; the interface temperature, 350 ◦C; the heat block temperature, 400 ◦C; the desolvation line tem- perature, 250 ◦C; the detector voltage 4.5 kV. The full mass scan spectra were recorded in the positive and negative ionization mode, in the m/z range of 200–900, with a scan speed of 682 amu/s. The instrument control and data acquisition were performed using the LabSolutions 5.42v software (Shimadzu).
3. Results and discussion
HPTLC separation of the goldenrod root compounds was performed with the mobile phase n-hexane – isopropyl acetate – acetic acid 40:9:1, V/V/V. The eight isolates (Table S1) formed six chromatographic spots as three of them (Sg3a, Sg3b, and Sg3c) were not separated (Fig. 1). The purity of the HPTLC zones of root extract compounds was assessed by HPTLC-UV and HPTLC-MS (Figs. S1-S4). Isolates were generally detectable by MS in positive ionization mode and the sodium and sodium-methanol adducts were prominently observed. For Sg5 and Sg6 intense signals were obtained also in negative ionization mode recording the deprotonated molecules and the sodium adducts of their dimers.
Comparing the UV and MS spectra of the zones in the root extracts with those of the respective isolates (at the same retardation factor), the separated compounds were found to be alone. The analysis of the common spot (Sg3) of Sg3a, Sg3b, and Sg3c provided an MS spectrum (Fig. S4) with the characteristic ions of all three compounds. However, it has to be noted that Sg3a and Sg3b gave the same mass signals at m/z 337 [M +Na]+, m/z 369 [M +CH3OH +Na]+and m/z 651 [2M +Na]+, while the recorded mass signal for Sg3c was m/z 340 [M - OH +CH3OH +Na]+. Similarly, the UV spectrum of their spot is a sum spectrum of the individuals. These diterpene molecules have weak UV absorbance, therefore the sensitivity of their detection could be improved by A.M. M´ ´oricz et al.
derivatization with vanillin-sulphuric acid reagent (Fig. S1). Because the resolution between Sg2-Sg3 and Sg3-Sg4 is lower than 1.5 (1.2 and 1.1, respectively), Sg1-Sg6 were quantified according their peak height recorded immediately after the derivatization at 550 nm. Based on the stability test of the formed derivatives, we suggest performing the densitometry within 1 h after the derivatization, when the decrease of the peaks’ height is less than 8% (Fig. S5).
The repeatability of the sample preparation was good, the relative standard deviation (RSD) of the peak heights of Sg1, Sg2, Sg3 (Sg3a + Sg3b +Sg3c), Sg4, Sg5, and Sg6 were 4.2, 3.1, 1.9, 0.8, 1.4 and 1.6, respectively (N =4, sample preparation was on different days). The investigated compounds are not commercially available, therefore re- coveries were not determined. But the extracted plant material was collected and extracted again (two parallels). Extracts obtained from the repeated second extraction did not contain detectable amounts of the compounds (Fig. S6), thus it was supposed that only a negligible amount of extractable compounds remained in the plant materials after the first extraction procedure.
The linearity range was determined as 25–150 ng for Sg1, Sg3a, Sg5, and Sg6 and 25–100 ng for Sg2 and Sg4. The limit of detection (LOD) and limit of quantification (LOQ) values were calculated as 3.3 ×SD/m and 10 ×SD/m, respectively, where SD is the standard deviation of peak height, and m is the slope of the calibration curve. Details are available in Table 1. Analyzing the 14 samples collected over a year from the same population, the wide variety of contents required expanding the cali- bration range. Using calibration curves with wider ranges and poly- nomial equations, the interday precision for three days revealed that the quantitative evaluation after vanillin-sulphuric acid derivatization was
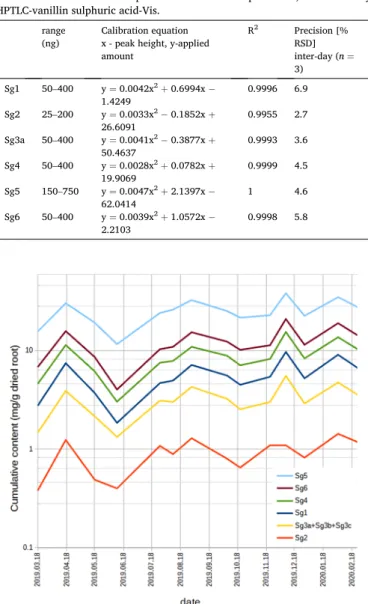
RSD% 2.7–6.9% (Table 2). Sg3a, Sg3b, and Sg3c content were expressed together as Sg3a equivalents as they were not separated. Most probably, the contents in the persistent root are influenced also by such environ- mental factors, which had no well-marked tendency with the change of the seasons. Comparing the changes with the alteration of the daily mean temperature recorded at Szeged (located also in the Great Hun- garian Plain, 90 km far from the collection area) [29], no relationship was found (Fig. S7). However, the cumulative content of these diter- penes decreased during late spring growth but increased during the strong vegetative growth and inflorescence development, and remained relatively high during flowering and also winter dormancy (Fig. 2, Table S2, Fig. S8). Based on this result and the fact that dry mass peaks in the flowering stage [30], we suggest the end of summer as the optimal time to collect the root as a source of bioactive compounds.
To achieve a physiological pH condition for the HPTLC-enzyme Fig. 1.HPTLC separation of the goldenrod root extracts and the eight isolates, its visualization with vanillin-sulphuric acid reagent, and its densitometric evaluation at 550 nm.
Table 1
Figures of merit for HPTLC-vanillin sulphuric acid-Vis quantitative calculation of S. gigantea root compounds (LOD =3.3 ×SD/m, LOQ =10 ×SD/m, SD is the standard deviation of peak height, m is the slope).
isolates calibration curve linearity range (ng) R2 LOD (ng) LOQ
(ng) Sg1 y =0.6833x +15.882 25–150 0.993 2.8 8.4 Sg2 y =1.3347x +24.8 25–100 0.998 1.9 5.8 Sg3a y =1.0862x +22.557 25–150 0.992 4.9 14.8 Sg4 y =1.1481x +16.517 25–100 0.995 2.2 6.6 Sg5 y =0.5918x +4.7119 25–150 0.997 9.0 27.1 Sg6 y =0.4562x +3.052 25–150 0.997 11.3 33.9
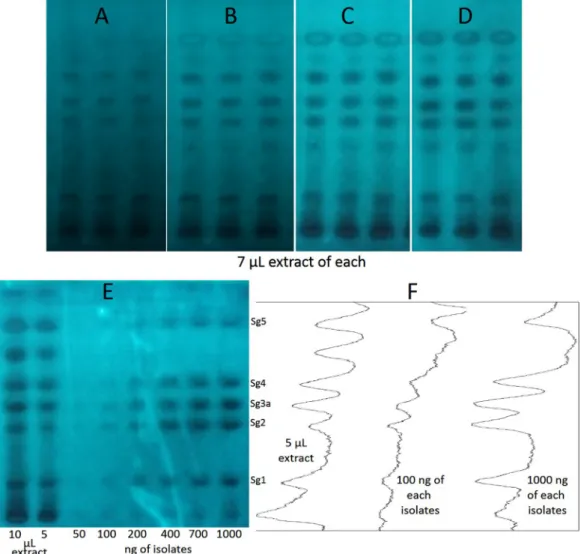
Journal of Chromatography B 1185 (2021) 123004 assay, the developed layer had to be neutralized by spraying or dipping the plate in a phosphate buffer (0.1 M, pH 7.5). The appropriate result of the neutralization process was confirmed by HPTLC-B. subtilis assay (Fig. 3), as the bacterial cells are more sensitive to the acidic condition than the enzymes. Thus, with an initial neutralization step, the HPTLC- enzyme test would have been a three-step process: applying the buffer, then the enzyme, and finally, the substrate. To reduce it to a two-step procedure, first, we combined the neutralization and substrate addi- tion steps, and then the enzyme was spread on an already neutralized adsorbent. Thus, in the first step, the developed layer was immersed into a buffered aqueous solution of the substrate. After sweeping off the excess liquid and letting the layer become unglazed, in the second step the buffered aqueous enzyme solution was sprayed onto the layer. The supernatant was swept off again and the bioautograms were incubated at 37 ◦C in a moisture chamber. Taking a photo every 5 min (Fig. 4), the suitable incubation time was estimated at 20 min, which was chosen for further investigations. When comparing with the previous method [28], the main advantage of this procedure is its compatibility with the acidic mobile phase without the use of additional steps. Furthermore, the spraying of the enzyme solution (instead of the immersion of the plate into it) ensures its single use, preventing its contamination.
Compared to the HPTLC-vanillin sulphuric acid reagent detection, the HPTLC-AChE assay was supposed to provide less sensitivity.
Therefore, the sample richest in the isolates, collected on 2019.12.09., was chosen for quantitative evaluation (Fig. 4). Using the 200–1500 ng range of the isolates and determining the peak area with video densi- tometry (ImageJ), linear calibration curves were obtained with excep- tion of Sg1, where the linearity range was 200–700 ng. As expected, LOD and LOQ were higher (59.9–148.1 ng and 175.5–448.7 ng, respectively) than with the use of the derivatization method. The intra-day precision was between 2.8 and 8.1 %RSD, while the inter-day was between 8.8 and 13.9 %RSD (Table 3). The isolates’ content of the richest sample were determined as 5.81 mg/g Sg1, 2.52 mg/g Sg2, 4.89 mg/g Sg3 in Sg3a equivalent, 5.29 mg/g Sg4, and 18.62 mg/g Sg5. Generally, they were in good harmony with those calculated with the HPLC-vanillin reagent-Vis method. The differences in the cases of Sg2, Sg3, Sg4 and Sg5 were not more than 14.4%. However, the measured amount of Sg1 with the lowest retardation factor was 40% higher with the AChE detection that could be due to a matrix effect even though by UV and MS spectrometry Sg1 was found to be alone in its zone.
4. Conclusions
Two HPTLC methods, one with densitometric evaluation after chemical derivatization and the other with the AChE inhibition assay, were developed to quantify eight previously isolated clerodane diter- penes of Solidago gigantea root extract. Both methods were proved to be appropriate for quantitative analysis. However, the detection with AChE inhibition assay was less sensitive (12–35 times) and less precise (3 times on average). Generally, the results obtained from the two methods were in concordance. The change of the contents of these compounds in the root collected from the same population over a year did not provide a clear tendency, however, considering other phenological data, e.g. dry mass and usefulness of the aerial part as a medicine, we suggest the fully flowered plant in late summer for the collection of a rich sample.
CRediT authorship contribution statement
Agnes M. M´ oricz: ´ Conceptualization, Supervision, Methodology, Resources, Experiments, Data analysis, Writing - original draft and re- view & editing. D´aniel Krüzselyi and Vir´ag Lapat: Experiments. P´eter G. Ott: Methodology, Bacteriological work, Writing - review & editing.
Declaration of Competing Interest
The authors declare that they have no known competing financial Table 2
The range of the applied isolates and the calibration curves used for the quan- titative evaluation of the samples and the calculated precisions, determined by HPTLC-vanillin sulphuric acid-Vis.
range
(ng) Calibration equation x - peak height, y-applied amount
R2 Precision [%
RSD]
inter-day (n = 3) Sg1 50–400 y =0.0042x2 +0.6994x −
1.4249 0.9996 6.9
Sg2 25–200 y =0.0033x2 − 0.1852x +
26.6091 0.9955 2.7
Sg3a 50–400 y =0.0041x2 − 0.3877x +
50.4637 0.9993 3.6
Sg4 50–400 y =0.0028x2 +0.0782x +
19.9069 0.9999 4.5
Sg5 150–750 y =0.0047x2 +2.1397x −
62.0414 1 4.6
Sg6 50–400 y =0.0039x2 +1.0572x −
2.2103 0.9998 5.8
Fig. 2.The clerodane diterpenes’ contents in the samples changed in parallel over a year.
Fig. 3. HPTLC separation of goldenrod compounds detected with either vanillin-sulphuric acid reagent (A), or after neutralization with Bacillus subtilis assay (B).
A.M. M´ ´oricz et al.
interests or personal relationships that could have appeared to influence the work reported in this paper.
Acknowledgements
This work was supported by the National Research, Development and Innovation Office of Hungary (NKFIH K128921).
Appendix A. Supplementary material
Supplementary data to this article can be found online at https://doi.
org/10.1016/j.jchromb.2021.123004.
References
[1] H. Jork, W. Funk, W. Fischer, H. Wimmer. Thin-Layer Chromatography –Reagents and Detection Methods, VCH, Weinheim, Germany, 1990 https://books.google.hu /books/about/Thin_layer_chromatography.html?id=xNTvAAAAMAAJ&redir_esc
=y (accessed July 28, 2017).
[2] A.L. Homans, A. Fuchs, Direct bioautography on thin-layer chromatograms as a method for detecting fungitoxic substances, J. Chromatogr. A 51 (1970) 327–329, https://doi.org/10.1016/S0021-9673(01)96877-3.
[3] A.M. Moricz, P.G. Ott, Screening and characterization of antimicrobial components of natural products using planar chromatography coupled with direct
bioautography, spectroscopy and mass spectrometry: A review, Curr. Org. Chem.
21 (18) (2017), https://doi.org/10.2174/1385272821666170127154900.
[4] I. Klingelh¨ofer, G.E. Morlock, Sharp-bounded zones link to the effect in planar chromatography-bioassay-mass spectrometry, J. Chromatogr. A 1360 (2014) 288–295, https://doi.org/10.1016/j.chroma.2014.07.083.
[5] M.O. Hamburger, G.A. Cordell, A direct bioautographic TLC assay for compounds possessing antibacterial activity, J. Nat. Prod. 50 (1) (1987) 19–22, https://doi.
org/10.1021/np50049a003.
Fig. 4. The result of the developed HPTLC-AChE assay of S. gigantea root extract after 5, 10, 15 and 20 min (A-D) and the HPTLC-AChE bioautogram (E) of the extract along with the isolates (Sg1, Sg2, Sg3a, Sg4 and Sg5) and three respective videodensitograms (F).
Table 3
Figures of merit for HPTLC-AChE quantification of S. gigantea root compounds.
Isolates Linearity range (ng) Calibration equation R2 LOD (ng) LOQ (ng) Precision [RSD%]
Intra-day (n =3) Inter-day (n =3)
Sg1 200–700 y =4384.9x +106.28 0.9989 65.1 197.4 2.8 10.4
Sg2 200–1500 y =4166x − 98.597 0.9904 68.4 207.3 3.9 13
Sg3a 200–1500 y =4148.9x +473.84 0.9962 57.9 175.5 6.3 12.9
Sg4 200–1500 y =4212.3x +267.05 0.9925 65.6 198.7 8.1 8.8
Sg5 200–1500 y =2574.4x +548.82 0.9982 148.1 448.7 4.9 13.9
Journal of Chromatography B 1185 (2021) 123004 [6] A. Seigel, B. Milz, B. Spangenberg, Quantification of parabens by diode-array thin-
layer chromatography coupled with a Vibrio fischeri bioluminescence assay, J. Planar Chromatogr. – Mod. TLC 26 (2) (2013) 119–124, https://doi.org/
10.1556/JPC.26.2013.2.3.
[7] A.M. M´ ´oricz, P.G. Ott, Conventional and modern bioassays—detection, isolation, identification, in: Forced-Flow Layer Chromatogr., Elsevier, 2016: pp. 347–395.
doi:10.1016/B978-0-12-420161-3.00006-X.
[8] U. Baumann, C. Brunner, E. Pletscher, N. Tobler, Biologische Detektionsverfahren in der DünnschichtchromatographieBiological detection procedures using thin- layer chromatography, Umweltwissenschaften und Schadstoff-Forsch. 15 (3) (2003) 163–167, https://doi.org/10.1065/uwsf2001.12.080.
[9] A.M. M´ ´oricz, M. Jamshidi-Aidji, D. Krüzselyi, A. Darcsi, A. B¨osz¨orm´enyi, P. Csontos, S. B´eni, P.G. Ott, G.E. Morlock, Distinction and valorization of 30 root extracts of five goldenrod (Solidago) species, J. Chromatogr. A 1611 (2020) 460602, https://doi.org/10.1016/j.chroma.2019.460602.
[10] G.E. Morlock, High-performance thin-layer chromatography combined with effect- directed assays and high-resolution mass spectrometry as an emerging hyphenated technology: A tutorial review, Anal. Chim. Acta 1180 (2021) 338644, https://doi.
org/10.1016/j.aca.2021.338644.
[11] N. Tabanca, J. Niogret, P.E. Kendra, N.D. Epsky, TLC-based bioassay to isolate kairomones from tea tree essential oil that attract male mediterranean fruit flies, Ceratitis capitata (Wiedemann), Biomolecules 10 (2020) 683, https://doi.org/
10.3390/biom10050683.
[12] R.S. Darwish, E. Shawky, H.M. Hammoda, F.M. Harraz, A new thin-layer chromatography–direct bioautography assay for the qualitative and quantitative determination of peroxidase inhibitors in plant extracts, JPC – J. Planar Chromatogr. – Mod. TLC 33 (1) (2020) 3–9, https://doi.org/10.1007/s00764-019- 00004-0.
[13] E. Mahran, I. El Gamal, M. Keusgen, G.E. Morlock, Effect-directed analysis by high- performance thin-layer chromatography for bioactive metabolites tracking in Primula veris flower and Primula boveana leaf extracts, J. Chromatogr. A 1605 (2019) 460371, https://doi.org/10.1016/j.chroma.2019.460371.
[14] I. Klingelh¨ofer, N. Hockamp, G.E. Morlock, Non-targeted detection and differentiation of agonists versus antagonists, directly in bioprofiles of everyday products, Anal. Chim. Acta 1125 (2020) 288–298, https://doi.org/10.1016/j.
aca.2020.05.057.
[15] A. M´ ´oricz, N. Ad´anyi, E. Horv´ath, P. Ott, E. Tyih´ak, Applicability of the BioArena system to investigation of the mechanisms of biological effects, J. Planar Chromatogr. – Mod. TLC 21 (6) (2008) 417–422, https://doi.org/10.1556/
JPC.21.2008.6.4.
[16] E. Mahran, M. Keusgen, G.E. Morlock, New planar assay for streamlined detection and quantification of β-glucuronidase inhibitors applied to botanical extracts, Anal.
Chim. Acta X. 4 (2020) 100039, https://doi.org/10.1016/j.acax.2020.100039.
[17] N.G.A.S.S. Chandana, G.E. Morlock, Comprehensive bioanalytical multi-imaging by planar chromatography in situ combined with biological and biochemical assays highlights bioactive fatty acids in abelmosk, Talanta 223 (2021) 121701, https://
doi.org/10.1016/j.talanta.2020.121701.
[18] I.M. Choma, C. Kowalski, R. Lodkowski, A. Burmanczuk, I. Komaniecka, TLC-DB as ´ an alternative to the HPLC method in the determination of cefacetril residues in
cow’s milk, J. Liq. Chromatogr. Relat. Technol. 31 (13) (2008) 1903–1912, https://doi.org/10.1080/10826070802194815.
[19] N.G.A.S. Sumudu Chandana, G.E. Morlock, Eight different bioactivity profiles of 40 cinnamons by multi-imaging planar chromatography hyphenated with effect–directed assays and high-resolution mass spectrometry, Food Chem. 357 (2021) 129135, https://doi.org/10.1016/j.foodchem.2021.129135.
[20] E. Azadniya, J. Mollergues, T. Stroheker, K. Billerbeck, G.E. Morlock, New incorporation of the S9 metabolizing system into methods for detecting acetylcholinesterase inhibition, Anal. Chim. Acta 1129 (2020) 76–84, https://doi.
org/10.1016/j.aca.2020.06.033.
[21] M. Jamshidi-Aidji, G.E. Morlock, From bioprofiling and characterization to bioquantification of natural antibiotics by direct bioautography linked to high- resolution mass spectrometry: Exemplarily shown for Salvia miltiorrhiza root, Anal.
Chem. 88 (22) (2016) 10979–10986, https://doi.org/10.1021/acs.
analchem.6b0264810.1021/acs.analchem.6b02648.s001.
[22] R.H. Johnson, H.M. Hull-Sanders, G.A. Meyer, Comparison of foliar terpenes between native and invasive Solidago gigantea, Biochem. Syst. Ecol. 35 (12) (2007) 821–830, https://doi.org/10.1016/j.bse.2007.06.005.
[23] B. Kołodziej, Antibacterial and antimutagenic activity of extracts aboveground parts of three Solidago species: Solidago virgaurea L., Solidago canadensis L. and Solidago gigantea Ait, J. Med. Plants Res. 5 (2011) 6770–6779, https://doi.org/
10.5897/JMPR11.1098.
[24] A.M. M´ oricz, D. Krüzselyi, P.G. Ott, Z. Gar´ ´adi, S. B´eni, G.E. Morlock, J. Bakonyi, Bioactive clerodane diterpenes of giant goldenrod (Solidago gigantea Ait.) root extract, J. Chromatogr. A 1635 (2021) 461727, https://doi.org/10.1016/j.
chroma.2020.461727.
[25] G. Reznicek, J. Jurenitsch, W. Kubelka, G. Michl, S. Korhammer, E. Haslinger, Isolierung und Struktur der vier Hauptsaponine aus Solidago gigantea var. serotina, Liebigs Ann. Der, Chemie. 1990 (10) (1990) 989–994, https://doi.org/10.1002/
(ISSN)1099-069010.1002/jlac.v1990:1010.1002/jlac.1990199001179.
[26] J. Zekiˇc, I. Vovk, V. Glavnik, Extraction and analyses of flavonoids and phenolic acids from canadian goldenrod and giant goldenrod, Forests 12 (2020) 40, https://
doi.org/10.3390/f12010040.
[27] A.M. M´ oricz, T.T. H´ ¨abe, A. B¨oszorm¨ ´enyi, P.G. Ott, G.E. Morlock, Tracking and identification of antibacterial components in the essential oil of Tanacetum vulgare L. by the combination of high-performance thin-layer chromatography with direct bioautography and mass spectrometry, J. Chromatogr. A 1422 (2015) 310–317, https://doi.org/10.1016/j.chroma.2015.10.010.
[28] L. Stütz, S.C. Weiss, W. Schulz, W. Schwack, R. Winzenbacher, Selective two- dimensional effect-directed analysis with thin-layer chromatography, J. Chromatogr. A 1524 (2017) 273–282, https://doi.org/10.1016/j.
chroma.2017.10.009.
[29] https://www.met.hu/eghajlat/magyarorszag_eghajlata/eghajlati_adatsorok/
Szeged/adatok/napi_adatok/index.php.
[30] M. Szymura, T.H. Szymura, Growth, phenology, and biomass allocation of alien Solidago species in Central Europe, Plant Species Biol. 30 (4) (2015) 245–256, https://doi.org/10.1111/psbi.2015.30.issue-4.
A.M. M´ ´oricz et al.