A contribution to scheduling jobs submitted by finite-sources in computational clusters ∗
Attila Kuki, Tamás Bérczes, Ádám Tóth, János Sztrik
University of Debrecen, Hungary
{kuki.attila,berczes.tamas,toth.adam,sztrik.janos}@inf.unideb.hu Submitted: December 21, 2020
Accepted: March 17, 2021 Published online: May 18, 2021
Abstract
Data science and data processing are very popular topics nowadays. Un- like a few years ago, everything is connected to data now and we have to handle these kinds of large data well. Therefore the distributed heteroge- neous resources of networks e.g. the computational grid, have attracted great interest. It has become a challenge to schedule jobs in order to utilize the available resources effectively. The allocation of arriving jobs has a great impact on the efficiency and the energy consumption of the system.
A generalized finite source model is presented in this paper. Our main goal is to build up models for the performance evaluation of scheduling compute- intensive jobs with unknown service times in a computational cluster that consists of servers of different types. For this purpose we determine various performance measures for all combinations of three scheduling policies (two of them are the novelty of this paper: the MRT and the MRTHP policies) which can be used for assigning jobs to servers with three schemes for buffering arriving jobs. Furthermore, we investigate the effect of switching off idle servers on the energy consumption of the system under these combinations of scheduling policies and buffering schemes.
Computational results obtained by simulation show that the choice of the scheduling policy and the buffering scheme plays an important role in ensuring the quality of service parameters such as the waiting time and the
∗The research work was supported by the construction EFOP - 3.6.3 - VEKOP - 16-2017- 00002. The project was supported by the European Union, co-financed by the European Social Fund.
The research work was supported by the Austro-Hungarian Cooperation Grant No 106öu4, 2020.
doi: https://doi.org/10.33039/ami.2021.03.008 url: https://ami.uni-eszterhazy.hu
201
response time experienced in the case of arriving jobs. However, the energy consumption is only affected by the scheduling policy and the energy saving mode, while the buffering scheme does not have a significant impact.
Keywords:Computational cluster, performance evaluation, buffering scheme, finite-source queueing systems
AMS Subject Classification:68M10, 68M20
1. Introduction
This paper deals with scheduling jobs in heterogeneous resources of networks, e.g.
the computational clusters. In the literature various job allocation algorithms have been proposed to schedule arriving jobs in computational clusters [1, 6, 7]. In addition, some algorithms have been designed to consider knowledge about the characteristics of jobs; these algorithms may be classified as either clairvoyant or as non-clairvoyant [15–17].
Besides the effective scheduling, the energy consumption of such grid systems turns into a crucial requirement due to the rapid increase of the size of the grid and the goal of a green computational cluster. The most common techniques of reducing energy consumption are related to the dynamic power management used at runtime. It is therefore of interest to examine algorithms that offer the greatest performance while using an amount of energy that is as low as possible.
Do introduced a generalized infinite model for the performance evaluation of scheduling compute-intensive jobs with unknown service times in computational clusters [2, 14]. In this paper we use a finite model instead of the infinite one [12]
to make the queueing model more realistic and we introduce two new scheduling policies: in addition to the previously introduced High Performance priority policy, we also consider a Mean Response Time priority and a Mean Response time with High Performance priority policy. We investigate these policies with respect to three schemes of buffering the arriving jobs: Separate Queue, Class Queue, and Common Queue. The novelty of this paper is introducing these two new policies. To our knowledge, this is the first time when such a detailed investigation of scheduling policies of this kind has been performed. Among the three mentioned buffering schemes the Common Queue proved to be the most efficient. The novelty of this paper is to develop two new scheduling policies: the MRT and the MRTHP policies.
With these two new policies the performance measures reach and overcome the characteristics of the Separate Queue.
The state space of the describing Markov chain is very large, thus it is rather difficult to calculate the system measures in the traditional way of writing down and solving the underlying steady-state equations. To obtain the performance mea- sures we used SimPack, a collection of C/C++ libraries and executable programs for computer simulation [3]. In this collection several simulation algorithms are supported including discrete event simulation, continuous simulation, and com- bined (multi-model) simulation. The purpose of the SimPack toolkit is to provide the user a set of utilities that illustrate the basics of building a working simulation
from a model description. Simulation results show that between the newly applied algorithms the MRTHP is capable of lessening the difference of the performance measures of the buffering schemes. In the case of the Separate Queue, MRTHP sig- nificantly decreases important factors such as the mean waiting time and the mean response time. Furthermore, we study the effect of scheduling policies and buffer- ing policies on the energy consumption of a system that switches off idle servers with and without an energy saving mode. According to the obtained results, the energy consumption of the different scheduling algorithms is relatively identical.
Some related investigations are described in [13]. Using the techniques described in this paper, it would be worth applying finite-source models for those problems, as well.
The rest of the paper is organized as follows: Section 2 describes the correspond- ing queueing model with components to study the behavior of the computational clusters and the derivation of the main steady-state performance measures. In Section 3 we show some numerical results that were derived by simulation with SimPack and subsequently visualized as diagrams. Section 4 presents our conclu- sions.
2. System model
A cluster is considered that serves compute-intensive jobs according to the following characteristics:
• Every job can be executed on any server.
• Jobs are served according to FIFO (first in, first out) policy.
• The service times of jobs are unknown to the local scheduler.
• Jobs under service cannot be interrupted (non-preemption);
• Jobs are atomic, i.e., they can not be divided into smaller pieces;
We assume, furthermore, that jobs arrive to the system from a finite number 𝑁 of sources and that each source generates jobs according to an exponential distribution with parameter 𝜆; thus the maximum rate of the incoming jobs is 𝑁 ·𝜆. Servers are organized in 𝐼 classes with𝐽 servers per class. Service times, which denote the times required for the servers to execute jobs, are exponentially distributed with rate𝜇𝑖in class𝑖. The exponentiality is not a strict constraint here.
In real-life applications the arrival and service behaviours are often very close to the exponential behaviour. The service rate 𝜇system of the whole system can be thus defined as
𝜇system=
∑︁𝐼 𝑖=1
𝐽·𝜇𝑖.
The system load𝜌system, the total amount of traffic carried by the system, can be written as the ratio of between the arriving and the service rate:
𝜌system= 𝜆·𝑁 𝜇system,
where 𝑁 is the average number of jobs in the system. Because the numbers of sources of the considered model is finite, the stationary distributions always exist, which implies the stability of the system.
2.1. Scheduling policies
Furthermore, we assume that every server is attached to a queue that buffers arriving jobs and from which the server removes jobs for execution (multiple servers may share a queue, see Section 2.2 for the various buffering schemes considered).
We investigate in our model the following policies for scheduling arriving jobs to server queues:
• HP (High Performance priority): This policy chooses the shortest queue in the system. If there is more than one queue with this property, a queue whose server has the highest performance is chosen.
• MRT (Mean Response Time priority): This policy first calculates the ex- pected mean response time for every queue and then selects a queue where this value is minimal.
• MRTHP (Mean Response Time with High Performance priority): This policy is a combination of MRT and HP. If there is an idle server, it behaves like the HP policy; if all servers are busy, it behaves like MRT.
The comparison of these policies and the effect of MRT and MRTHP policies to the performance measures and the energy efficiency are discussed in sections 3.1 and 3.2.
In order to obtain the performance, mean response times, and energy consump- tion of a server, we consider every server of the cluster to be of a specific type (class). Let𝑆 denote the set of server classes and𝐼=|𝑆| the size of𝑆. Let𝑠∈𝑆 be a server class which can be characterized by the following parameters:
• 𝐶𝑠: This is the throughput of the server i.e., the number of completed opera- tions per time; it is measured in ssj_ops according to the SPECpower_ssj2008 benchmark [11].
• 𝑃ac,𝑠: This is the average active power of the server under full load; it is measured in Watt according to the SPECpower_ssj2008 benchmark.
• 𝑃id,𝑠: This is the power consumption of the server in the idle state; it is measured in Watt according to the SPECpower_ssj2008 benchmark.
It is presumed that when a server of class𝑠is busy, then it works with through- put𝐶𝑠and power consumption𝑃ac,𝑠. According to SPECpower_ssj2008, the ratio 𝐶𝑠/𝑃ac,𝑠 describes the energy efficiency of the server; higher ratio means higher efficiency. When the server becomes idle, the internal clock of the CPU is stopped via software such that the server consumes power 𝑃id,𝑠< 𝑃ac,𝑠; alternatively, idle servers may be completely switched off such that they do not consume power at all.To choose a server with the highest performance in the HP respectively MRTHP policy, a server of class𝑠with the highest value of𝐶𝑠is selected; to choose a server with the smallest mean response time in the MRT respectively MRTHP policy, a server of class 𝑠with the smallest ratio 𝑞/𝐶𝑠of queue length 𝑞 and throughput𝑠 is selected.
2.2. Buffering schemes
In the following subsections, we present the various schemes for buffering arriving jobs and how they implement the previously introduced scheduling policies.
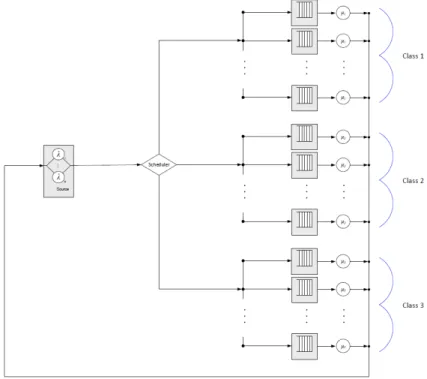
2.2.1. Separate Queue
In the Separate Queue scheme, every server has its own queue as depicted in Fig- ure 1. Jobs are scheduled to the queue of a specific server according to the chosen policy, and they remain in that queue as long as the server is busy. If the server becomes idle, then it receives the first waiting job from its queue.
Henceforth let 𝑐𝑖𝑗 denote the status of server 𝑗 in class 𝑖 (0 denotes idle, 1 denotes busy or not in class𝑖), and let𝑞𝑖𝑗 denote the number of jobs in the queue of that server (which can range from0to𝑁−𝐼·𝐽). The state of the cluster at time 𝑡can be considered as a Continuous Time Markov Chain with dimensionI·J+I·J:
𝑋(𝑡) = (𝑐11(𝑡);. . .;𝑐IJ(𝑡);𝑞11(𝑡);. . .;𝑞IJ(𝑡)).
The system’s steady-state probabilities can be defined the following way:
𝑃(𝑐11;. . .;𝑐IJ;𝑞11;. . .;𝑞IJ) = lim
𝑡→∞𝑃((𝑐11(𝑡) =𝑐11;. . .;𝑐IJ(𝑡) =𝑐IJ; 𝑞11(𝑡) =𝑞11;. . .;𝑞IJ(𝑡) =𝑞IJ)
Since the state space of the describing Markov chain is very large, it is rather difficult to calculate the system measures in the traditional way of writing down and solving the underlying steady-state equations.
To obtain the performance measures we therefore used SimPack, a collection of C/C++ libraries and executable programs for computer simulation [3].
Using the simulation program the following important performance measures of the system can be calculated:
• R𝑖𝑗 – The probability that the server𝑗 in class𝑖is busy,
• L𝑖𝑗 – The probability that the server𝑗 in class𝑖is idle,
• 𝑄𝑖𝑗 – The mean length of queue𝑖𝑗,
• 𝑄– The mean number of jobs in the queues: 𝑄=∑︀𝐼 𝑖=1
∑︀𝐽 𝑗=1𝑄𝑖𝑗.
Figure 1. The Separate Queue scheme.
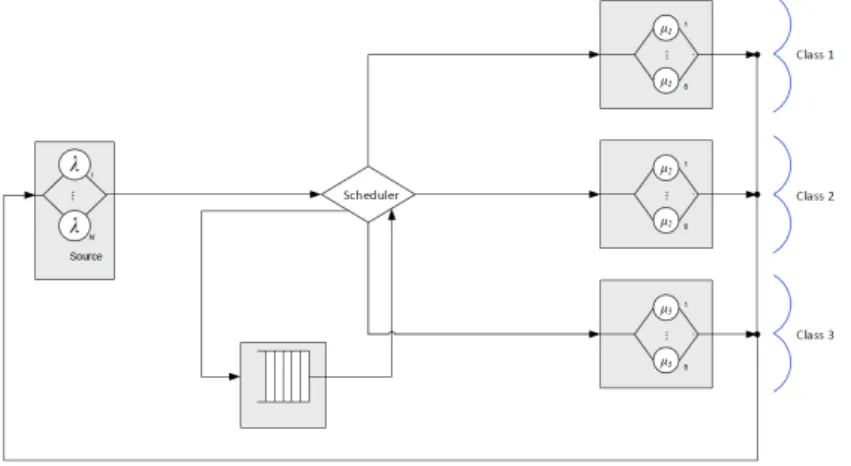
2.2.2. Class Queue
In the Class Queue scheme a buffer is assigned to each class (see Figure 2). Jobs are scheduled to the queue of a specific class according to the chosen policy, and they remain in that queue as long as all servers of the class are busy. If a server becomes idle, then it receives the first waiting job from the queue of its class.
Henceforth, let 𝑐𝑖𝑗 denote the status of server 𝑗 in class 𝑖 (0 means idle and 1 means busy) and let 𝑞𝑖 denote the number of jobs in its queue (which can range from 0 to 𝑁 −𝐼 · 𝐽). The state of the cluster at time 𝑡 can be con- sidered as a Continuous Time Markov Chain with dimension I·J+I: 𝑋(𝑡) = (𝑐11(𝑡);. . .;𝑐IJ(𝑡);𝑞1(𝑡);. . .;𝑞I(𝑡)).
The system’s steady-state probabilities can be defined the following way:
𝑃(𝑐11;. . .;𝑐IJ;𝑞1;. . .;𝑞I) = lim
𝑡→∞𝑃((𝑐11(𝑡) =𝑐11;. . .;𝑐IJ(𝑡) =𝑐IJ; 𝑞1(𝑡) =𝑞1;. . .;𝑞I(𝑡)) =𝑞I)
Figure 2. The Class Queue scheme.
Using the simulation program the following important performance measures of the system can be calculated:
• R𝑖𝑗 – The probability that server𝑗 in class𝑖is busy,
• L𝑖𝑗 – The probability that server𝑗 in class𝑖is idle,
• 𝑄𝑖 – The mean length of queue𝑖,
• 𝑄– The mean number of jobs in the queues: 𝑄=∑︀𝐼 𝑖=1𝑄𝑖. 2.2.3. Common Queue
In the Common Queue scheme, only a single common buffer is available for all servers (see Figure 3). If a job arrives, then its service begins immediately if at least one server is idle. If more than one server is idle, then the local scheduler chooses the server with the highest performance. If all the servers are busy, then the local scheduler places the job into the queue and the job remains there until one of the servers become idle.
Henceforth, let𝑐ij denote server𝑗 in class𝑖(0 means idle and1 means busy), and let 𝑞1 denote the number of jobs in the queue (which can range from 0 to 𝑁−𝐼·𝐽).
The state of the cluster at time 𝑡 can be considered as a Continuous Time Markov Chain with dimension I·J+1: 𝑋(𝑡) = (𝑐11(𝑡);. . .;𝑐IJ(𝑡);𝑞1(𝑡)).
The system’s steady-state probabilities can be defined the following way:
𝑃(𝑐11;. . .;𝑐IJ;𝑞1) = lim
𝑡→∞𝑃(𝑐11(𝑡) =𝑐11;. . .;𝑐IJ(𝑡) =𝑐IJ;𝑞1(𝑡) =𝑞1).
Figure 3. The Common Queue scheme.
Using the simulation program the following important performance measures of the system can be calculated:
• R𝑖𝑗 – The probability that server𝑗 in class𝑖is busy,
• L𝑖𝑗 – The probability that server𝑗 in class𝑖is idle,
• 𝑄– The mean number of jobs in the queue:
𝑄=
∑︁1 𝑐11=0
. . .
∑︁1 𝑐IJ=0
𝑁∑︁−𝐼·𝐽 𝑞1=0
𝑞1·𝑃(𝑐11, . . . , 𝑐IJ;𝑞1).
2.3. Generic performance measures
For all three buffer schemes, the following further performance measures can be obtained by the help of the previously calculated measures:
• 𝑅– The mean number of jobs at the servers: 𝑅=∑︀𝐼 𝑖=1
∑︀𝐽 𝑗=1𝑅𝑖𝑗
• 𝑂– The mean number of jobs in the system: 𝑂=𝑄+𝑅
• 𝑁 – The mean number of jobs in the queue: 𝑁 =𝑁−𝑄−𝑅
• 𝜆– The mean generating intensity: 𝜆=𝜆𝑁
• 𝜆– The mean response time: 𝑇 =𝑂
𝜆
• 𝑊 – The mean waiting time: 𝑊 = 𝑄𝜆
It is worth mentioning that practical implementation of the Separate queue scheme is the easisest because waiting jobs can be placed inside each physical server. For example jobs and parameters can be allocated in the local disk of each physical server.
The common queue scheme can be used in MaaS (Message Queueing as a Service) in the cloud computing paradigm. A possible example of the compute- intensive services of unknown service times is AWS cloud lambda service [4, 5].
2.4. Energy metrics
Let 𝑃id,𝑖 and 𝑃ac,𝑖 denote the active power consumption of server 𝑖 when idle respectively busy. Furthermore,𝑅𝑖,𝑗 denotes the probability that server𝑖 in class 𝑗 is busy and𝐿𝑖,𝑗 denotes the probability that it is idle. Then the average energy consumption of the whole system can be defined in the following way depending on whether idle servers are switched off or not:
• AEno-switch– The mean energy consumption of the system when idle servers are not switched off:
AEno-switch=
∑︁𝐼 𝑖=1
⎛
⎝𝑃ac,𝑖
∑︁𝐽 𝑗=1
𝑅𝑖,𝑗+𝑃id,𝑖
∑︁𝐽 𝑗=1
𝐿𝑖,𝑗
⎞
⎠.
• AEswitch-off– The mean energy consumption of the system when idle servers are switched off:
AEswitch-off=
∑︁𝐼 𝑖=1
⎛
⎝𝑃ac,𝑖
∑︁𝐽 𝑗=1
𝑅𝑖,𝑗
⎞
⎠.
3. Numerical results
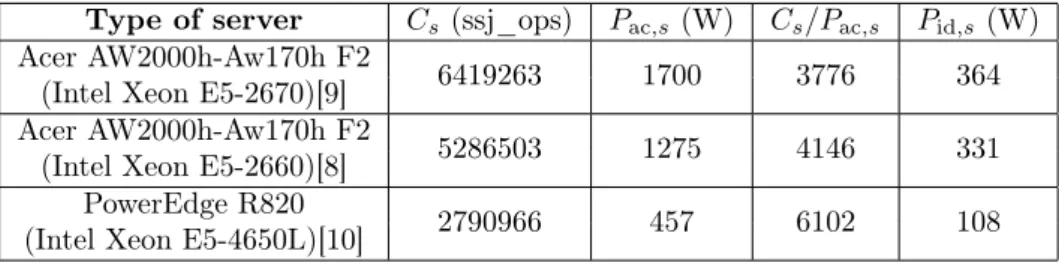
We have implemented the models introduced in Section 2 with the help of the SimPack package and now we present results on the comparison of scheduling algorithm. For this purpose, we have modeled three classes of Commercial Off- The-Shelf (COTS) servers with different types of processors (Intel Xeon E5-2670, Intel Xeon E5-2660, and Intel Xeon E5-4650L) whose characteristics are depicted in Table 1.
The simulations were performed with the parameters depicted in Table 2. Jobs are generated according to an exponential distribution with parameter 𝜆 from a source of 𝑁 components and are routed to𝐼 classes of servers with𝐽 servers per class; the servers in class 𝑠 process jobs according to an exponential distribution with parameter 𝜇𝑠; for this purpose, the performance 𝐶𝑠 with maximum value 6419263 ssj_ops is adjusted to a service rate𝜇𝑠with maximum value 1 (i.e., every job is assumed to require 1 second on an Intel Xeon E5-2670 processor).
Table 1. Server classes.
Type of server 𝐶𝑠(ssj_ops) 𝑃ac,𝑠(W) 𝐶𝑠/𝑃ac,𝑠 𝑃id,𝑠 (W) Acer AW2000h-Aw170h F2(Intel Xeon E5-2670)[9] 6419263 1700 3776 364 Acer AW2000h-Aw170h F2(Intel Xeon E5-2660)[8] 5286503 1275 4146 331
PowerEdge R820 2790966 457 6102 108
(Intel Xeon E5-4650L)[10]
Table 2. Simulation parameters.
Notation Parameter Value
𝑁 Number of jobs in the source 150
𝐼 Number of server classes 3
𝐽 Number of servers per class 8
𝜆 Job generation rate 0.07–0.18
𝜇𝑠 Service rates of servers in class𝑠 1; 0,82; 0,43
3.1. Performance measures
To evaluate the performance of the system, we analyze the mean service time, the mean waiting time, and the mean response time. Several figures are devoted to service, waiting, and response times. Though, response times can be more important, than service times, figures with service times are are also presented.
At most of the investigated cases, the waiting times and response times provide almost the same characteristics, thus due to the range constraint of the paper, only one of them is presented here. The service times have different characteristics, so beside the figures of response and/or waiting times, service times figures are also included.
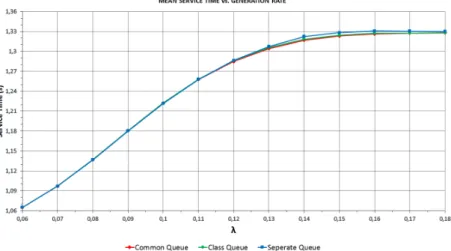
Figure 4 shows the mean service time as a function of the generation rate 𝜆 using the HP policy for all buffering schemes. We see that as the generation rate increases, the mean service time also increases. This phenomenon can be explained by that jobs are first scheduled to the servers with highest performance. It also can be observed that for every buffering scheme the mean service times are almost the same, independently of the loads of the servers.
Furthermore, we can observe that, as the arrival rate starts to increase, slower servers start to play a more and more important role in the mean service time.
Hereby the execution of the jobs become slower, thus jobs spend more time at the server. Of course, this is true only for a specific generation rate, because the more jobs arrive in the system, the higher the system load is. As we can see,
if the generation rate is greater then 0.16, we reach the maximum system load.
This means that eventually every server becomes busy and the mean service time becomes constant.
Figure 4. The mean service time applying the HP policy.
Figure 5. The mean response time applying the HP policy.
Figure 5 shows the mean response time and as a function of the generation rate using the HP policy (the same result can be obtained for the mean waiting time).
On close inspection, the Common Queue scheme performs best but the difference to the Class Queue scheme is very small. As long as the generation rate does not reach 0.1, we cannot observe major differences between both schemes. But in the
range from 0.1 to 0.18 the difference appears vigorously, especially between the Separate Queue scheme and the other ones. In case of the Separate Queue scheme, the values of the mean waiting time and response time are the highest among the schemes. The reason why the Common Queue scheme ensures the lowest values for both the mean waiting and response times is that this model is able to utilize the available resources in the most efficient way. However, it has to be considered that the realization of Common Queue scheme is the most complicated one among the applied buffering schemes.
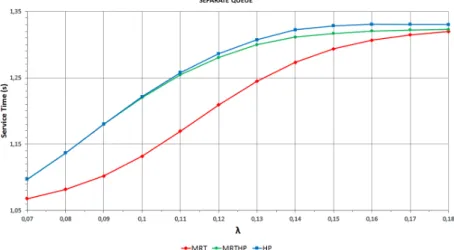
Figure 6 demonstrates the effect of the new policies MRT and MRTHP on the mean service time for the Separate Queue scheme. It is clearly visible that the MRT policy gives much smaller values as well as a relatively smaller system load.
Comparing the HP and the MRTHP policy, we see that there is a slight difference discernible between them which starts to manifest when the system load gets high.
Figure 6. The effect of HP, MRT and MRTHP on the mean service time in case of Separate Queue.
Figure 7 shows the effect of the HP, MRT, and MRTHP policies on the mean waiting time using the Separate Queue scheme. A similar figure can be generated for mean response time. We can observe that the MRT policy is still the worst among the three policies. But the significant difference is that the MRTHP policy provides the most preferential values and not the HP policy. This is especially true when the system load is in the medium range.
In Figure 8 we can see the effect of the scheduling policies on the mean service time for the Class Queue scheme. It is clearly visible that the MRT policy gives much smaller values than the HP and the MRTHP policies, but the difference is here smaller than for the Separate Queue scheme (compare to Figure 6). We can observe that there is no difference between the HP and the MRTHP policies.
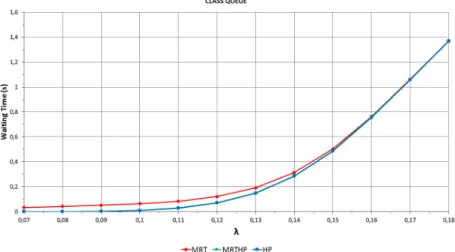
Figure 9 shows that using a higher generation rate the mean waiting time (and
similarly, the mean response time) become higher. We can see that the MRT policy gives the highest values and that there is only a very small difference between the HP and the MRTHP policies. It is worth noting that using MRT/MRTHP policy for the Common Queue scheme we get back the results of the HP policy.
Figure 7. The effect of HP, MRT and MRTHP on the mean waiting time in case of Separate Queue.
Figure 8. The effect of HP, MRT and MRTHP on the mean service time in case of Class Queue.
So all in all, we can observe that the significance of MRTHP is higher for the Separate Queue scheme than for the Class Queue scheme and is negligible
for the Common Queue scheme. Furthermore, while the MRTHP policy brings the Separate Queue scheme and the Class Queue scheme closer to the Common Queue scheme, the Common Queue scheme still seems to be the best to choose.
However, the practical implementation of the Separate Queue scheme is the easiest and cheapest among all schemes; since the application of the MRT policy also makes the Separate Queue scheme competitive with the Common Queue Scheme, the combination of MRT policy and Separate Queue scheme may be preferred.
Figure 9. The effect of HP, MRT and MRTHP on the mean waiting time in case of Class Queue.
3.2. Energy consumption
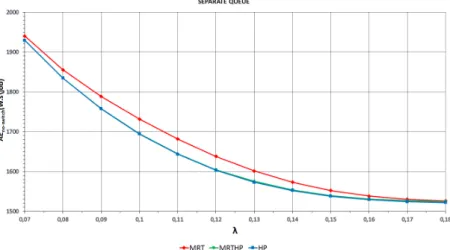
Figures 10 and 11 demonstrate for the Separate Queue scheme the mean energy consumption in cases when idle servers are not switched off (𝐴𝐸no-switch) respec- tively are switched off (𝐴𝐸switch-off). As we can see, we get the highest energy consumption with the MRT policy and the lowest one with the HP policy; be- tween the HP policy and the MRT policy there is only a small difference in case of 𝐴𝐸switch-off and higher generation rates. As it can be expected, the difference between all policies disappears for high generation rates, because all servers be- come permanently busy, such that the energy consumption converges to around 1520 W.s/job.
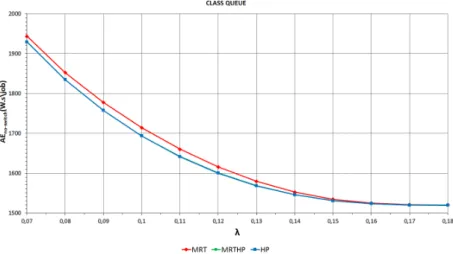
Figures 12 and 13 demonstrate the mean energy consumption for the Class Queue scheme. In both cases we get the highest energy consumption using the MRT policy, and there is not any noticeable difference between the HP policy and the MRTHP policy. Again for high generation rates, the energy consumption converges for all policies to around 1520 W.s/job.
Finally, Figure 14 demonstrates how much energy can be saved by switching off the idle servers (for the Separate Queue scheme and the HP policy). Since
the saving decreases for higher generation costs and switching servers off and on involves extra costs, the choice to switch off servers must be clearly taken with care.
Figure 10. 𝐴𝐸no-switchvs. generation rate using Separate Queue.
Figure 11. 𝐴𝐸switch-off vs. generation rate using Separate Queue.
Figure 12. 𝐴𝐸no-switchvs. generation rate using Class Queue.
Figure 13. 𝐴𝐸switch-offvs. generation rate using Class Queue.
4. Conclusions
So far the High Performance priority policy was considered in similar investiga- tions. In this paper we have introduced and considered two new scheduling policies, namely the Mean Response Time priority and the Mean Response Time with High Performance priority policies. We investigate these policies with respect to three schemes of buffering the arriving jobs: Separate Queue, Class Queue, and Common
Figure 14. Mean energy consumption in case of switch off and switch on using HP policy.
Queue. Furthermore, we study the effect of scheduling policies and buffering poli- cies on the energy consumption of a system that switches off idle servers with and without an energy saving mode. Since the state space of the describing Markov chain is very large, for that reason we used SimPack, a collection of C/C++ li- braries and executable programs for computer simulation in order to obtain the performance measures.
The results described in this paper show that in the case of Separate and Class Queue the Mean Response time with High Performance priority policy improves the performance measures preeminently, in particular the mean sojourn time and the mean waiting time, compared to High Performance priority policy. As the Common Queue scheme operates with only one queue, we gain the same results with the application of the proposed new algorithms in the case of High Performance priority policy. Utilizing the MRHP priority policy the difference between the performance metrics of Separate and Common Queue decreases significantly; the numerical results show that the buffering schemes do not affect significantly the energy consumption of the investigated clusters. Accordingly selecting a good scheduling policy can augment the overall cluster performance without increased power consumption whenever the buffering scheme possesses more than one queue altogether.
References
[1] M. Cankar,M. Artač,M. Šterk,U. Lotrič,B. Slivnik:Co-Allocation with Collective Requests in Grid Systems, Journal of Universal Computer Science 19.3 (2013), pp. 282–300, doi:https://doi.org/10.3217/jucs-019-03-0282.
[2] T. V. Do,B. T. Vu,X. T. Tran,A. P. Nguyen:A generalized model for investigating scheduling schemes in computational clusters, Simulation Modelling Practice and Theory 37.0 (2013), pp. 30–42.
[3] P. A. Fishwick:Simpack: Getting Started With Simulation Programming In C And C++, in: WSC ’92 Proceedings of the 24th Conference on Winter Simulation, ed. byJ. S. et al., ACM, New York, 1992, pp. 154–162.
[4] K. Salah:A queuing model to achieve proper elasticity for cloud cluster jobs, International Journal of Cloud Computing 1.1 (2013), pp. 755–761.
[5] K. Salah,K. Elbadawi,R. Boutaba:Performance modeling and analysis of network firewalls”, IEEE Transactions on network and service management 9.1 (2012), pp. 12–21.
[6] A. Tchernykh,J. Ramírez,A. Avetisyan,N. Kuzjurin,D. Grushin,S. Zhuk:Two level job-scheduling strategies for a computational grid, in: Proceedings of the 6th Inter- national Conference on Parallel Processing and Applied Mathematics (PPAMA05), 2006, pp. 774–781.
[7] G. Terzopoulos,H. D. Karatza:Performance evaluation of a real-time grid system using power-saving capable processors, The Journal of Supercomputing 61.3 (2012), pp. 1135–1153.
[8] The Standard Performance Evaluation Corporation:Acer Incorporated Acer AW2000 h-AW170h F2 (Intel Xeon E5-2660),
url: https : / / www . spec . org / power _ ssj2008 / results / res2012q4 / power _ ssj2008 - 20120918-00546.html.
[9] The Standard Performance Evaluation Corporation:Acer Incorporated Acer AW2000 h-Aw170h F2 (Intel Xeon E5-2670),
url: https : / / www . spec . org / power _ ssj2008 / results / res2013q1 / power _ ssj2008 - 20121212-00590.html.
[10] The Standard Performance Evaluation Corporation:Dell Inc. PowerEdge R820 (In- tel Xeon E5-4650L),
url: https : / / www . spec . org / power _ ssj2008 / results / res2012q4 / power _ ssj2008 - 20121113-00586.html.
[11] The Standard Performance Evaluation Corporation:SPECpower_ssj2008 Result File Fields,
url:https://www.spec.org/power/docs/SPECpower_ssj2008-Result_File_Fields.html.
[12] Á. Tóth,T. Bérczes,A.Kuki,B. Almási,W. Schreiner,J. Wang,F. Wang:Analysis of finite-source cluster networks, CREATIVE MATHEMATICS AND INFORMATICS 2 (2016), pp. 223–235.
[13] X. T. Tran,T. V. Do,C. Rotter,D. Hwang:A New Data Layout Scheme for Energy- Efficient MapReduce Processing Tasks, Journal of Grid Computing 16.2 (2018), pp. 285–
298.
[14] X. T. Tran,T. V. Do,B. T. Vu:New Algorithms for Balancing Energy Consumption and Performance in Computational Clusters, Computing and Informatics 36.2 (2017), pp. 307–
330.
[15] S. Zikos,H. D. Karatza:A clairvoyant site allocation policy based on service demands of jobs in a computational grid, Simulation Modelling Practice and Theory 19.6 (2011), pp. 1465–1478.
[16] S. Zikos,H. D. Karatza:Communication cost effective scheduling policies of nonclair- voyant jobs with load balancing in a grid, Journal of Systems and Software 82.12 (2009), pp. 2103–2116.
[17] S. Zikos,H. D. Karatza:The impact of service demand variability on resource allocation strategies in a grid system, ACM Transactions on Modeling and Computer Simulation 20 (2010), 19:1–19:29.