EDUCATIONAL REVIEW
Microbleeds show a characteristic distribution in cerebral fat embolism
Omar Giyab1* , Bendegúz Balogh1, Péter Bogner1, Orsi Gergely1,2,3 and Arnold Tóth1,3
Abstract
This systematic review aims to test the hypothesis that microbleeds detected by MRI are common and show a char- acteristic pattern in cerebral fat embolism (CFE). Eighty-four papers involving 140 CFE patients were eligible for this review based on a systematic literature search up to 31 January 2020. An additional case was added from hospital records. Patient data were individually scrutinised to extract epidemiological, clinical and imaging variables. Charac- teristic CFE microbleed pattern resembling a “walnut kernel” was defined as punctuate hypointensities of monoto- nous size, diffusely located in the subcortical white matter, the internal capsule and the corpus callosum, with mostly spared corona radiata and non-subcortical centrum semiovale, detected by susceptibility- or T2* weighted imaging.
The presence rate of this pattern and other, previously described MRI markers of CFE such as the starfield pattern and further diffusion abnormalities were recorded and statistically compared. The presence rate of microbleeds of any pat- tern, the “walnut kernel microbleed pattern”, diffusion abnormality of any pattern, the starfield pattern, and cytotoxic edema in the corpus callosum was found to be 98.11%, 89.74%, 97.64%, 68.5%, and 77.27% respectively. The presence rate between the walnut kernel and the starfield pattern was significantly (p < 0.05) different. Microbleeds are com- mon and mostly occur in a characteristic pattern resembling a “walnut kernel” in the CFE MRI literature. Microbleeds of this pattern in SWI or T2* MRI, along with the starfield pattern in diffusion imaging appear to be the most important imaging markers of CFE and may aid the diagnosis in clinically equivocal cases.
Keywords: Fat embolism, Cerebral fat embolism, Microbleed, DWI, SWI
© The Author(s) 2021. Open Access This article is licensed under a Creative Commons Attribution 4.0 International License, which permits use, sharing, adaptation, distribution and reproduction in any medium or format, as long as you give appropriate credit to the original author(s) and the source, provide a link to the Creative Commons licence, and indicate if changes were made. The images or other third party material in this article are included in the article’s Creative Commons licence, unless indicated otherwise in a credit line to the material. If material is not included in the article’s Creative Commons licence and your intended use is not permitted by statutory regulation or exceeds the permitted use, you will need to obtain permission directly from the copyright holder. To view a copy of this licence, visit http:// creat iveco mmons. org/ licen ses/ by/4. 0/.
Key points
• Microbleeds detected by susceptibility- or T2*
weighted imaging show a characteristic distribution in cerebral fat embolism.
• Such microbleed pattern may be just as commonly and more constantly present in cerebral fat embolism than the well-known “starfield pattern” detected by diffusion weighted imaging.
• Confluent cytotoxic edema is most commonly pre- sent in the corpus callosum.
Introduction
Cerebral fat embolism (CFE) is part of the fat embolism syndrome (FES), which results from the intravascu- lar embolisation of fat globules. FES is most commonly caused by displaced long bone fractures, or during ortho- paedic procedures but it may also be caused by other conditions like sickle cell disease, severe pancreatitis, or following liposuction [1, 2].
First described by Zenker in 1862 the exact mechanism of CFE remains poorly understood. Both mechanical and biochemical theories have been proposed to explain the syndrome [3, 4]. The mechanical obstruction of arterial circulation by neutral fat globules, followed by a delayed biochemical toxic injury caused by free fatty acids is the most probable mechanism of tissue injury [5, 6].
CFE can occur without a patent foramen ovale, as small
Open Access
*Correspondence: giyab.omar@pte.hu
1 Department of Medical Imaging, University of Pécs Medical School, Ifjúság út 13, 7624 Pécs, Hungary
Full list of author information is available at the end of the article
deformable fat globules can pass through the capillary circulation of the lung [7].
Cerebral fat embolism syndrome (CFES) occurs in up to 60% of patients with FES and is usually considered to be a self-limiting entity, but recent studies have also shown possible links to long term neurocognitive impair- ment [8–10]. The clinical presentation of CFES may vary considerably, symptoms typically appear between 12 to 72 h after the injury and may range from mild neurologi- cal impairment to alarming symptoms like coma or even death in the most severe cases [11].
There are no definitive clinical diagnostic tests and criteria developed, making the diagnosis of FES difficult [12, 13]. The diagnosis is usually based on a combination of symptoms, laboratory and imaging findings [9]. Cur- rently the most commonly used diagnostic criteria have been proposed by Gurd and Wilson presented in Table 1 [14]. In this system, at least two positive major criteria, or one positive major and four positive minor criteria are considered suggestive of FES [14].
Many patients, however, do not develop the classic triad of cutaneous, respiratory and neurological symp- toms [9]. Accordingly, the Gurd and Wilson’s criteria are not fulfilled, and the sole or first manifestation of FES may be neurologic, thus resulting in a diagnostic chal- lenge to clinicians [9, 15]. Post-mortem pathological studies have shown CFE to be more common than pre- viously thought indicating that it is underdiagnosed, and the clinical criteria used to diagnose the condition are not entirely reliable [16].
CT scans performed are typically without any spe- cific finding, however may show widespread interval low density changes which should raise the suspicion of CFE [11]. Compared to CT, imaging findings in MRI are much more common in CFE [17]. The “starfield pattern” has
been widely used in literature for describing the revers- ible imaging pattern of multifocal punctate lesions show- ing diffusion restriction. Other reported features include confluent cytotoxic edema in the white matter, and vaso- genic lesions that may enhance [1, 11, 17]. Additional features of CFE that has been increasingly reported more recently are cerebral and cerebellar microbleeds depicted by susceptibility weighted imaging (SWI) or T2* MRI [18]. These studies and a case that we present in this review have led us hypothesize that microbleeds show a characteristic pattern in CFE. We aimed to test this hypothesis by a systematic review of the literature.
Methods Literature search
We have searched the PubMed database up to 31 Janu- ary 2020 (no time constraints were set for the earliest publication) for papers which included detailed imaging description or images of cases with CFE. We used the keywords “MR” or “MRI” and”fat emboli” or”fat embo- lism”, or “starfield pattern”. References of the included papers were then individually checked for additional arti- cles. We also searched the PACS, and the hospital infor- mation system (HIS) of the University of Pécs for CFE cases. We used the ICD-10-CM diagnosis code T79.10 (traumatic fat embolism) for searching the PACS (Med- View – ASPYRA LLC 7400 Baymeadows Way, Suite 101 Jacksonville, FL 32,256), and HIS (eMedSolution—T- Systems Magyarország Zrt. H-1097 Budapest, Könyves Kálmán krt. 36.) of the University of Pécs from 1 October 2016 (installation of MR scanner) until 31 January 2020.
We have found one potentially suitable case for inclusion in this systematic review, whose legal representative was contacted and a signed informed consent was acquired for the anonymized inclusion and publication in this review. Search results were saved and organised via the commercially available Mendeley software (V1.19.5) and its web importer plug-in.
The exclusion criteria included recorded head trauma, poor image quality, unavailable images and poor image description, non-English language articles, animal exper- iment articles, CFE articles related to facial lipid injection procedure, and articles that are not available for online access.
Data extraction
All included articles were individually scrutinised by a board certified neuroradiologist (O.G.) and other two board certified radiologists with a minimum of five-year experience in interpreting neuroradiological exami- nations (A.T. and P.B.) to collect relevant data for this review. Data were populated into an Excel (ver. 1908, Table 1 Gurd and Wilson’s criteria
*The diagnosis of FES requires 2 major or 1 major and 4 minor criteria to be fulfilled
Gurd and Wilsion’s criteria*
Major criteria Minor criteria
Petechial rash Tachycardia (> 110 bpm) Respiratory insufficiency Fever (> 38.5 °C) Cerebral symptoms in non-
head injury patients Retinal changes (fat or petechiae) Jaundice
Renal changes (oliguria, anuria, or lipiduria) Acute onset thrombocytopenia
Acute drop in haemoglobin
Elevated erythrocyte sedimentation rate Fat macroglobinemia
Microsoft, Redmond, Washington, US) table for statisti- cal evaluation.
If more than one case was presented in an article, then all the available information from each case was recorded separately. If only mean values were reported for a given variable regarding patients, then these data were not included in further evaluation. The time point of CT and MRI scans were recorded in days, and time point 0 was considered to be the time of arrival to the hospital. If mentioned, the Glasgow coma scale (GCS) was used to record the neurological status. Gurd and Wilson’s, and Schönfeld’s criteria were only recorded if they were men- tioned in the article.
The extracted clinical and epidemiological variables and available patients, are presented in Table 2.
Regarding imaging findings, the presented images, text and supplementary materials were evaluated as well.
Imaging findings were recorded if they were identifi- able on the presented images, or clearly described in the text. Findings that were not identifiable in the presented images or were not mentioned in the text were consid- ered to be absent. In case of any discrepancy between the text and the available images, they were double-checked by each participating radiologist, and were excluded
from the statistical analyses if the discrepancy was con- firmed by all readers. Ambiguous imaging findings (due to poor image quality, or partially visible pathology) if not detailed in the text were not considered in the statistical calculations.
The hypothesized, CFE characteristic microbleed pat- tern was defined as the diffuse presence of round micro- bleeds (punctate focal hypointensities) of monotonous size in the subcortical white matter (involving but not limited to the U-fibers), internal capsule and the cor- pus callosum, mostly sparing the corona radiata and the non-subcortical centrum semiovale on T2* GRE or SWI images. As authors believe this pattern resembling the appearance of a walnut kernel, it is further referred to as the “walnut kernel pattern”.
The starfield pattern as described by Parizel et al. refers to the presence of scattered bright spots in a dark back- ground in DWI with diffusion restriction, was considered positive if it was identifiable in the presented DWI and ADC images, or was clearly described in text [1]. Cases referred to as starfield positive without presented ADC or clear reference to diffusion restriction, but with very typical starfield pattern in the presented DWI agreed by the three reviewing radiologists in the present study were Table 2 Epidemiological and clinical data
*Total number of cases eligible for analysis
**Standard deviation
Variable Number (n) Total* (Σ) Rate (%) SD** Mean
Epidemiological and clinical data
Patients included 141 141
Male 72 141 71
Female 29 141 29
Age Overall 101 141 71.63 18.5 42.1
Males 72 101 71.29 20.1 36
Females 29 101 28.71 24.2 58
Etiology Fracture 79 141 56.03
Single bone fracture 38 141 26.95
Multiple bone fracture 37 141 26.24
Femur fracture 41 141 29.08
Tibia fracture 21 141 14.89
Polytrauma 27 141 19.15
Sickle cell disease 10 141 7.09
Patent foramen ovale 8 141 5.67
Initial neurological status (GCS) 15 76 85 89.41
14 4 85 4.71
< 14 5 85 5.88
Gurd and Wilson’s criteria applied 43 141 30.49
Time to first MRI in days 60 60 3.478 3.45
Follow up MRI performed 59 141 41.84
Mortality 4 141 2.8
also accepted as definitive starfield pattern. We catego- rised a case as starfield negative if there was no mention or image of the starfield pattern, ADC map did not show restricted diffusion, and there was no additional mention of restricted diffusion in the text.
Confluent diffusion restriction in the corpus callosum, if present, was also recorded.
Further recorded imaging findings included confluent cytotoxic edema in the white matter (other than corpus callosum), vasogenic edema in the white matter, pete- chial hemorrhages of non-characteristic pattern, and chronic sequel – atrophy.
Data analysis
Descriptive statistics were used to summarise the recorded parameters. To assess the presence rate of
"walnut kernel microbleed pattern" for CFE, the num- ber of characteristic CFE pattern cases was divided by the number of all cases where it was possible to evalu- ate the presence of microbleed pattern. Similarly, pres- ence rate of starfield pattern for CFE was calculated by dividing the number of cases with definitive starfield pat- tern by all cases in which it was possible to definitively evaluate. Characteristic microbleed pattern and starfield pattern presence rates were compared using Fisher exact test. For a more direct, one-sample comparison, the pres- ence rates were compared by McNemar test in a subset of patients for whom it was possible to evaluate both the microbleed and the starfield patterns. Both Fisher and McNemar tests were run in MedCalc Statistical Software version 18.11.3 (MedCalc Software bvba https:// www.
medca lc. org; 2019, [19]) and tests were regarded signifi- cant if yielding a p value less than 0.05.
To present temporal features of the walnut kernel microbleed pattern and the starfield pattern, the included cases were assigned into three stages: acute stage (first 4 days of hospitalisation), subacute stage (5–14 days) and late stage (14 + days). In all stages, four groups were cre- ated: starfield pattern positive and negative groups and walnut kernel pattern positive and negative groups. For this analysis, we disqualified case studies and reviews if the exact time point of the MRI for each patient was not reported.
Results
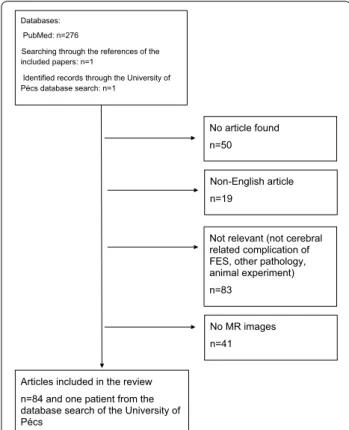
The literature search identified 277 articles, from which 193 articles were excluded, resulting in a total of 84 included articles, for details see Fig. 1 flow chart. The oldest included paper was published in 1998 [15]. In our institution’s database search, we have found one case that was tagged by the ICD-10-CM diagnosis code T79.10 for traumatic fat embolization. This was the case of a previously healthy 16-year-old female patient who
was run over by a car and suffered severe thoracic and abdominal injuries including right sided serial rib frac- tures, right sided hemothorax, bilateral pneumotho- rax, diaphragmatic and hepatic rupture. No direct head injury was recorded based on clinical evaluation and the negative admission CT. Due to delayed awakening on the sixth postoperative day, a head CT was performed which showed multiple punctiform hyperdensities which disap- peared by day 17 (Fig. 2.). The typical starfield pattern of CFE, were not seen on the MR images that were acquired on day 12 after admission to the hospital, but there was facilitated diffusion in the subcortical white matter, and diffusion restriction was limited to the corpus callosum only (Fig. 3.). The case showed the walnut kernel micro- bleed pattern in SWI, surrounded by extracellular edema, except for the corpus callosum where cytotoxic edema was shown (Figs. 3, 4). Considering the results of lab tests and previous reports, the diagnosis of cerebral fat embolism was made. Following supportive care and three months long rehabilitation, a near-complete neuropsy- chological recovery was achieved. Long term follow-up MR images 16 months later revealed signs of cerebral atrophy (Fig. 5.).
From the 84 included articles, there were 73 case reports, 6 review papers, 4 original papers, and 1 review
Databases:
PubMed: n=276
Searching through the references of the included papers: n=1
Identified records through the University of Pécs database search: n=1
No article found n=50
Non-English article n=19
Not relevant (not cerebral related complication of FES, other pathology, animal experiment) n=83
No MR images n=41
Articles included in the review n=84 and one patient from the database search of the University of Pécs
Fig. 1 Quality of Reporting of Meta-analysis standards (QUOROM) flow diagram of articles included in this systematic review
pictorial essay. 140 patients from the included articles satisfied our inclusion criteria and were included in this review, in addition to the previously mentioned case from our own databases, resulting in an overall patient number of 141.
The extracted epidemiological and clinical data are summarised in Table 2.
In the included literature SWI was done in 40 cases, T2* was performed in 21 cases, and both SWI and T2*
measurements were performed in 12 cases. Microbleeds in general, were present in 52 out of 53 cases (98.11%).
The "walnut kernel microbleed pattern" was found in 35 out of 39 evaluable cases resulting in a presence rate of 89.74%.
Diffusion abnormality in general, was seen in 97.64%
of the cases (n = 124). The starfield pattern description was used in 70.08% (n = 89) of the cases, but only 19.10%
(n = 17) of these cases were confirmed with an ADC map (Fig. 6.). The majority of the presented cases relied on T2 or DWI images only for using the starfield pattern term.
However, in 59 out of these cases, diffusion restriction was referred to in the text, in other 8 cases the authors did not use the term starfield pattern, yet it was clearly present in the shown images, and in 3 cases the authors described the lesions as starfield positive, but there was no further accurate detailing of this finding presented.
Thus, definitive starfield pattern was ascertained in 87 out of 127 cases yielding a presence rate of 68.5%. In 3.3% (n = 4) the term was used to describe foci of vaso- genic edema, large confluent areas of cytotoxic edema, or infarcts were described on T2 images alone [20–23].
Confluent restricted diffusion was seen in the corpus cal- losum in 77.27% (34 out of 44 cases). On follow-up stud- ies brain atrophy has been confirmed in 8 cases [1, 17, 24–29].
Fig. 2 A case showing microhemorrhages as seen on CT. Axial native CT scan images at the level of the centrum semiovale and the basal ganglia of a 16-year-old polytraumatised female patient acquired on postoperative day 11 after hospital admission. Multiple subcortical punctiform hyperdensities presumably representing microhemorrhages are seen bilaterally in the subcortical white matter (a), and a larger hyperdensity is seen in the genu of the corpus callosum (b)
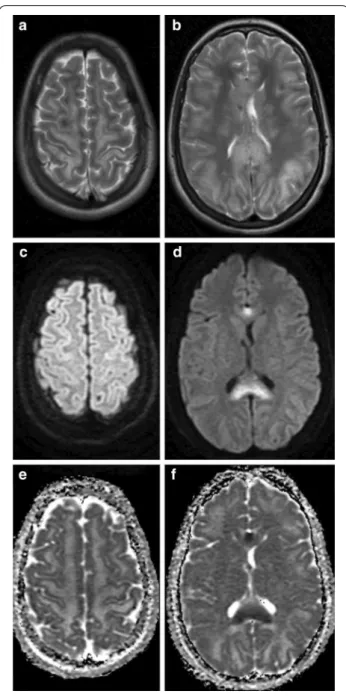
Fig. 3 A case representing the various patterns of diffusion abnormalities seen in CFE. T2 (a, b), DWI (c, d), and ADC (e, f) MRI images at the level of the centrum semiovale (left column), and at the level of the basal ganglia (right column) of a 16-year-old polytraumatised female patient acquired on day 12 after hospital admission. T2 weighted images show hyperintense signal in the subcortical white mater, internal capsule and the corpus callosum (a, b). Diffusion-weighted MR Image with a b value of 1000 s/mm2 (c, d), and ADC (e, f) images show cytotoxic edema affecting the corpus callosum and facilitated diffusion over the subcortical white matter
CFE related imaging findings are summarised in Table 3.
Between the presence rates of the walnut kernel and definitive starfield patterns (89.74% vs. 68.5%), Fisher exact test showed a significant (p = 0.0073) difference.
In the subset of patients where both microbleed and starfield patterns were possible to be evaluated (n = 29), the "walnut kernel pattern" was present in 27 cases (93.1%), while the starfield pattern was present in 12
cases (41.38%). The McNemar test showed these rates to be significantly different (p = 0.0003).
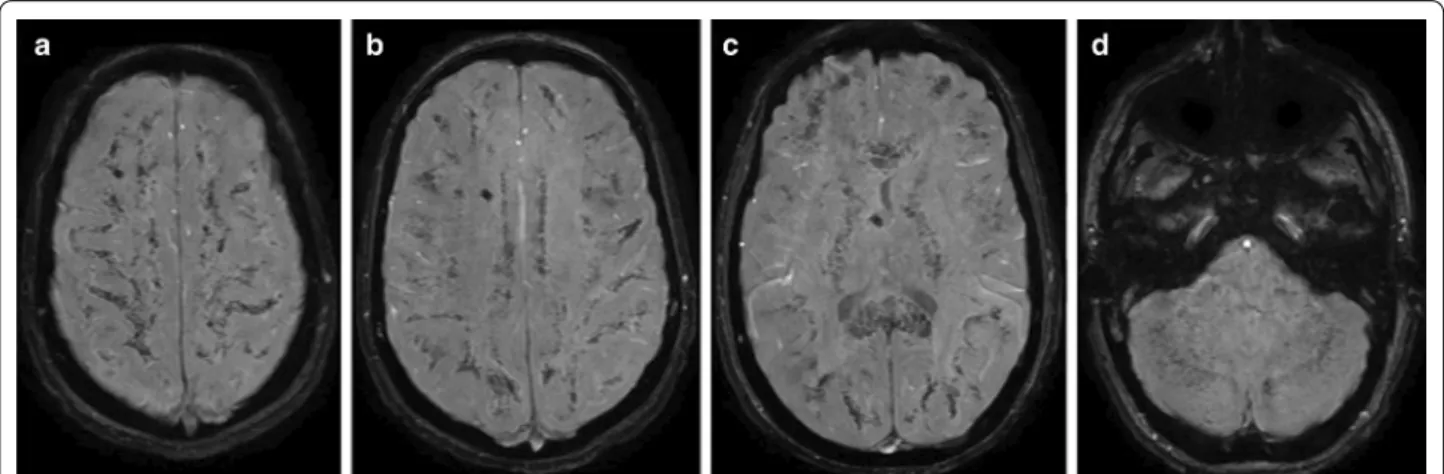
Regarding the temporal characteristics of the lesions (Fig. 7.), the starfield pattern was mostly pre- sent within the first 4 days after injury where 21 posi- tive and 6 negative cases existed, while only 3 positive cases were reported along with 3 negative cases in the 4–14 days period. In turn, the walnut kernel micro- bleed pattern had a more consistent presence among Fig. 4 A case representing the walnut kernel microbleed pattern. SWI (a–d) MRI images at the level of the centrum semiovale (a), at the level of the corona radiata (b), at the level of the basal ganglia (c), and at the level of the brainstem and the cerebellum (d) of a 16-year-old polytraumatised female patient acquired on day 12 after hospital admission. SWI shows very high number of monotonous punctuate microbleeds in the subcortical white matter, the internal capsule, the corpus callosum, the cerebellum and the brainstem resembling a “walnut kernel”. The larger hypointensity visible in the right centrum semiovale and near the third ventricle is due to a ventricular drain (a–c)
Fig. 5 A case representing the long-term radiological consequences of CFE. T2 MRI images at the level of the basal ganglia of a 16-year-old polytraumatised female patient acquired on day 12 after hospital admission (a), and 16 months later (b). The long-term follow-up images show resolution of the subcortical and corpus callosum T2 hyperintensities, and dilation of the intergyral sulci, and the lateral ventricles indicative of cerebral atrophy (b)
Fig. 6 A case representing the starfield pattern of restricted diffusion. MRI scan of an 18-year-old man with a closed displaced fracture of the left femoral shaft after a high velocity motor vehicle accident. Diffusion-weighted MR Image (10000/89; b value, 1000 s/
mm2) showing foci of hyperintensities within both centrum ovale (a), and the corresponding ADC map confirming restricted diffusion (b). Published under the permission of G. Bierry and S.
Kremer, Department of Radiology, University Hospital of Strasbourg, Strasbourg, France
time periods, with a case count of 9 positive vs 1 nega- tive until day 4, 7 positive vs 1 negative in the 4–14 day period and 2 positive in the day 14 + period.
Discussion
Since the clinical diagnosis of CFE is often difficult, imaging could provide significant help. We hypoth- esized that the increasingly described microbleeds and their particular distribution, the walnut kernel pattern (diffuse uniform punctiform microbleeds located in the subcortical region, the corpus callosum, and in the internal capsule) maybe an important marker for CFE.
Reviewing the literature and our database, it can be noted that although the authors have previously not referred to this actual pattern of microbleeds, the wal- nut kernel pattern appears to be indeed very common in CFE, as it was present in 89.74% of the cases. Rec- ognizing this specific pattern could be utmost impor- tant because microbleeds in other distributions can be associated with other, possibly coinciding pathologies such as diffuse axonal injury (DAI) or sepsis, but they are also common in cardiovascular diseases.
In contrast to the walnut kernel pattern, microbleeds in DAI are seen in groups with varying size and shape (linear, curvilinear, to ovoid), in specific locations [18].
Hypertension associated microbleeds are typically seen only in deeper areas of the brain, while in amyloid Table 3 Radiological findings
*Total number of cases eligible for analysis
**For definition see methods
a Cases with presented susceptibility- or T2* images, or with no presented images but with clear description regarding microbleed presence
b Cases with susceptibility- or T2* images in which the subcortical white matter, internal capsule, and the corpus callosum were evaluable, and cases with no presented images but description of findings regarding microbleeds in the specified locations
c Cases with presented DWI, or DWI and ADC. Cases with no such presented imaging but with clear description of any diffusion abnormality, or the absence of any diffusion abnormality were also included
d Cases with presented DWI and ADC images. Cases without presented images but with description of findings regarding the presence or absence of confluent cytotoxic edema were also included
e Cases with DWI and ADC images where the corpus callosum is visible. Cases without presented images but with clear description regarding the presence or absence of corpus callosum diffusion restriction were also included
f Cases with presented DWI and ADC images. Cases without presented images but with clear description regarding the presence or absence of lesions of facilitated diffusion were also included.
g Cases with presented follow-up MR or CT images. Cases without presented images but with clear description regarding the presence or absence of atrophy in the late stage
Variable (n) (Σ)* Rate (%) References
Radiological findings
Microbleeds 52 53a 98.11 [17, 18, 20, 21, 24–27, 39–71]
Walnut kernel microbleed pattern** 35 39b 89.74 [17, 18, 23–26, 39, 41, 45–47, 49, 50, 52–54, 56, 58, 61–63, 66, 70–73]
Diffusion abnormality 124 127c 97.64 [1, 8, 9, 11, 17, 18, 22–30, 39–55, 57–59, 61–71, 73–104]
Definitive starfield pattern** 87 127c 68.5 [1, 9, 11, 17, 18, 23, 24, 26–28, 40–42, 44, 46, 48, 50–52, 54, 58, 59, 61–65, 67–69, 74–78, 80–85, 88, 90, 91, 93–96, 98, 99]
Confluent cytotoxic edema in white matter 41 82d 50 [8, 17, 18, 24–26, 28, 29, 42, 44, 45, 47, 50–52, 54, 55, 65, 70, 76, 78, 84–87, 89, 90, 92–94, 97, 98, 100, 103–105]
Cytotoxic edema in the corpus callosum 34 44e 77.27 [9, 17, 18, 23–26, 28, 40, 44, 45, 61, 62, 65, 66, 70, 72, 81, 83–85, 88, 89, 93, 94, 96–98, 101]
Vasogenic edema lesions 17 58f 29.31 [8, 11, 17, 23, 26, 29, 30, 41, 42, 47, 50, 52, 55, 56, 78, 89, 92]
Atrophy 9 9g 100 [1, 17, 24–29]
Fig. 7 Bar graph indicating the positive proportion of radiological patterns against time. The starfield pattern was mostly present within the first 4 days after injury, while walnut kernel microbleed pattern had a more consistent presence among the different time periods
angiopathy the microbleeds show a diffuse lobar pat- tern of more heterogeneous, mainly larger size [30].
Acute haemorrhagic leucoencephalitis is generally also associated with widespread white matter T2 lesions, the microbleeds are more often randomly distributed, and its clinical presentation is substantially different [31].
Diffuse cerebral microbleeds have been reported in up to 2% of patients receiving extracorporeal membrane oxygenation (ECMO) [33]. While having a similarly favourable prognosis to CFE in the published cases, dif- fuse cerebral microbleeds related to ECMO also have a quite similar distribution, therefore it is very important for radiologist to be informed about the patient undergo- ing such therapy [34, 35]. Disseminated cerebral micro- hemorrhages have been described as a late complication in critically ill COVID-19 patients as well [36]. When compared to CFE, microbleeds in critically ill patients such as in sepsis, disseminated intravascular coagu- lopathy, COVID-19 infection, and patients undergo- ing ECMO therapy tend to be more variable in size, and shape [32, 36–38]. To date, the exact pathomechanism of cerebral microbleeds in the critically-ill in general and in patients undergoing ECMO therapy is not known, but a commonly accepted speculation is that it is probably multifactorial in its nature, involving an ischemic and/
or a biochemical insult induced a thrombotic or embolic event, hence the authors speculate that the underlying pathomechanism could be similar to that of CFE. Further imaging research and accompanying post-mortem stud- ies might elucidate differential diagnosis and the exact mechanisms of microbleeds in critically ill patients.
Beyond microbleeds several types of CFE MR signs have been described in previous studies. According to a comprehensive review published in 2014, the imaging patterns of CFE were classified in to 4 groups (scattered cytotoxic edema, confluent cytotoxic edema in white matter, vasogenic edema lesions that may enhance, pete- chial hemorrhage of white matter, and chronic sequel), amongst which the starfield appearance was the most commonly encountered (61.5% of 44 MRI scans) [17]. In our review, it was possible to include more recent papers and therefore a larger number of patients were analysed that revealed a very similar occurrence rate 68.5% of the starfield pattern in CFE. However, the more recent papers included also considerably more SWI and T2*
studies, revealing that microbleeds, and specifically the walnut kernel pattern may be even more common than the starfield pattern.
An emerging concern regarding the starfield pat- tern seems to be that there is a degree of uncertainty around its use in the literature. Originally, Parizel et al.
has described the starfield pattern as “scattered bright
spots on a dark background” on DW-MRI, which, according to their interpretation, “presumably reflect foci of cytotoxic edema” according to low ADC values [1]. Since then this expression has been used widely in the literature, but often without considering the ADC values. According to our findings this was the case in around half of the reviewed patients. In a few pub- lished cases the starfield pattern was used to describe confluent T2 hyperintense white matter lesions poten- tially representing other pathologies like vasogenic edema, while in other reports lesions of obviously high ADC values were referred to as starfield pattern.
From a practical point of view, it is important to note that compared to the starfield pattern, over time, micro- bleeds could be more consistently identified on MRI.
Although due to the small number of corresponding cases, reasonable statistical analysis was not possible, it seems that the starfield pattern is typically present in the first 4 days, as there are much more positive than negative cases in this period, whereas in the 4–14 day time interval the number of positive and negative cases are equal. In contrast, irrespective of the time point, microbleeds were always more commonly present than absent—indicating constant visibility (Fig. 7). This is in line with the article published by Kuo et al. [17].
An additional remarkable observation of our review is that the previously described “confluent cytotoxic edema” is mostly present in the corpus callosum, with a prevalence of 77.27%, which is comparable to the star- field and walnut kernel patterns.
There is limited data in the literature regarding the chronic radiological sequel of CFE. Although the long term prognosis of CFE is generally considered to be good, cerebral atrophy and persistent T2 hyperintensi- ties can be seen in some cases where follow-up imaging has been performed [1, 17, 24–29].
This study has certain limitations. First, comparison of the rates of the starfield and walnut kernel patterns is somewhat limited since considerably more articles investigated diffusion abnormalities than microbleeds.
Second, the presence rates of the investigated imaging patterns do not necessarily reflect their true sensitivity, since it is possible that authors published their imag- ing results more likely in case of positive findings, caus- ing seemingly higher presence rates of these imaging markers. Still, it can be safely postulated that the wal- nut kernel microbleed pattern, the starfield pattern and corpus callosum diffusion restriction are the most com- mon imaging alterations in CFE. Third, data regard- ing chronic changes induced by CFE are scarce and therefore the prevalence of cerebral atrophy remains unknown.
Conclusion
Microbleeds are very common and mostly occur in a char- acteristic pattern resembling a “walnut kernel” in the CFE MRI literature. Microbleeds of this pattern in SWI or T2*
MRI, along with the starfield pattern and corpus callosum diffusion restriction in DWI/ADC appear to be the most important imaging markers of CFE and may aid the differ- ential diagnosis in clinically equivocal cases.
Abbreviations
CFE: Cerebral fat embolism; CFES: Cerebral fat embolism syndrome; DAI:
Diffuse axonal injury; ECMO: Extracorporeal membrane oxygenation; FES: Fat embolism syndrome; GCS: Glasgow coma scale; HIS: Hospital information system.
Acknowledgements
The authors would like to thank Guillaume Bierry and Stephane Kremer (Department of Radiology, University Hospital of Strasbourg, Strasbourg, France) for providing us with previously unpublished images from their case [40], presented in Fig. 6.
Authors’ contributions
O.G. and A.T. conceived the presented idea of this review. O.G., A.T. and B.B.
developed the theory, collected data and performed the data analysis. A.T., P.B., and G.O. verified the analytical methods. O.G., A.T. and. B.B. created the tables and figures presented. P.B. is the scientific guarantor of this publication.
All authors discussed the results and made substantial contributions to the final manuscript.
Funding
The research was financed by the Higher Education Institutional Excellence Programme of the Ministry for Innovation and Technology in Hungary, within the framework of the 5. thematic programme of the University of Pécs. A.T.
and G.O. were supported by the Bolyai Scholarship of the Hungarian Academy of Science. A.T. was also supported by the ÚNKP-19–4-PTE-182 New National Excellence Program of the Ministry for Innovation and Technology.
Availability of data and materials
The datasets generated during the current study are available from the cor- responding author upon request.
Declarations
Ethics approval and consent to participate
The Institutional Review Board approved the institutional medical database search that was performed related to this study.
Consent for publication
The legal representative of the included patient was contacted, and a signed informed consent was acquired for the anonymised publication of her images and clinical data in this review.
Competing interests
The authors report no conflict of interest.
Author details
1 Department of Medical Imaging, University of Pécs Medical School, Ifjúság út 13, 7624 Pécs, Hungary. 2 Department of Neurosurgery, University of Pécs Medical School, Rét utca 2, Pécs 7623, Hungary. 3 MTA-PTE Clinical Neurosci- ence MR Research Group, University of Pécs Medical School, Ifjuság út 20, Pécs 7624, Hungary.
Received: 6 October 2020 Accepted: 19 March 2021
References
1. Parizel PM, Demey HE, Veeckmans G et al (2001) Early diagnosis of cerebral fat embolism syndrome by diffusion-weighted MRI (starfield pattern). Stroke 32:2942–2944
2. Shaikh N (2009) Emergency management of fat embolism syndrome.
J Emergencies, Trauma Shock 2:29. https:// doi. org/ 10. 4103/ 0974- 2700.
44680
3. Beiträge zur normalen und pathologischen Anatomie der Lunge - Friedrich Albert Zenker -. In: Norm. und Patol. https:// books. google. lu/
books? id= 4zpCA AAAcA AJ& print sec= front cover & hl= de#v= onepa ge&
q&f= false. Accessed 8 Feb 2020
4. Müller C, Rahn BA, Pfister U, Meinig RP (1994) The incidence, pathogen- esis, diagnosis, and treatment of fat embolism. Orthop Rev 23:107–117 5. Simon AD, Ulmer JL, Strottmann JM (2003) Contrast-enhanced MR
imaging of cerebral fat embolism: case report and review of the litera- ture. Am J Neuroradiol 24:97–101
6. Kamenar E (1980) Burger PC Cerebral fat embolism: a neuropathologi- cal study of a microembolic state. Stroke 11:477–84. https:// doi. org/ 10.
1161/ 01. str. 11.5. 477
7. Byrick RJ, Mullen JB, Mazer CD, Guest CB (1994) Transpulmonary systemic fat embolism: studies in mongrel dogs after cemented arthroplasty. Am J RespirCrit Care Med 150:1416–1422. https:// doi. org/
10. 1164/ ajrccm. 150.5. 79525 70
8. Pfeffer G, Heran MKS (2010) Restricted diffusion and poor clinical out- come in cerebral fat embolism syndrome. Can J NeurolSci 37:128–130.
https:// doi. org/ 10. 1017/ s0317 16710 00097 93
9. Scarpino M, Lanzo G, Lolli F, Grippo A (2019) From the diagnosis to the therapeutic management: cerebral fat embolism, a clinical challenge.
Int J Gen Med 12:39–48. https:// doi. org/ 10. 2147/ IJGM. S1774 07 10. Allen M (2016) Cerebral fat microembolism and its potential role in
postoperative cognitive dysfunction after major orthopaedic surgery. J Bone JtSurg - Am 98:e33
11. Dunkel J, Roth C, Erbguth F et al (2017) Cerebral fat embolism: clinical presentation, diagnostic steps and long-term follow-up. EurNeurol 78:181–187. https:// doi. org/ 10. 1159/ 00047 9002
12. Bollineni VR, Gelin G, Van Cauter S (2019) No Title. J Belgian SocRadiol 103:20. https:// doi. org/ 10. 5334/ jbsr. 1781
13. Kwiatt ME, Seamon MJ (2013) Symposium: embolism in the intensive care unit fat embolism syndrome. Int J CritIllnInjSci 3:64–68. https:// doi.
org/ 10. 4103/ 2229- 5151. 109426
14. Gurd AR, Wilson RI (1974) The fat embolism syndrome. J Bone Joint Surg Br 56B:408–416
15. Bardana D, Rudan J, Cervenko F, Smith R (1998) Fat embolism syndrome in a patient demonstrating only neurologic symptoms. Can J Surg 41:398–402
16. Georgopoulos D, Bouros D (2003) Fat embolism syndrome: clinical examination is still the preferable diagnostic method. Chest 123:982–
983. https:// doi. org/ 10. 1378/ chest. 123.4. 982
17. Kuo KH, Pan YJ, Lai YJ et al (2014) Dynamic MR imaging patterns of cerebral fat embolism: a systematic review with illustrative cases. Am J Neuroradiol 35:1052–1057
18. Rutman AM, Rapp EJ, Hippe DS et al (2017) T2∗-weighted and diffusion magnetic resonance imaging differentiation of cerebral fat embolism from diffuse axonal injury. J Comput Assist Tomogr 41:877–883. https://
doi. org/ 10. 1097/ RCT. 00000 00000 000635
19. Schoonjans F, Zalata A, Depuydt CE, Comhaire FH (1995) MedCalc:
a new computer program for medical statistics. Comput Methods Programs Biomed 48:257–262. https:// doi. org/ 10. 1016/ 0169- 2607(95) 01703-8
20. Blitstein MK, Tung GA (2007) MRI of cerebral microhemorrhages. Am J Roentgenol 189:720–725. https:// doi. org/ 10. 2214/ AJR. 07. 2249 21. Rothberg DL, Makarewich CA (2019) Fat embolism and fat embolism
syndrome. J Am AcadOrthopSurg 27:e346–e355. https:// doi. org/ 10.
5435/ JAAOS-D- 17- 00571
22. Il SuhS, Seol HY, Seo WK, Koh SB (2009) Cerebral fat embolism: suscep- tibility-weighted magnetic resonance imaging. Arch Neurol 66:1170.
https:// doi. org/ 10. 1001/ archn eurol. 2009. 173
23. Stienen MN, Gautschi OP (2012) Cerebral fat embolism after severe road traffic accident. Am J Emerg Med 30:831.e1-831.e2. https:// doi.
org/ 10. 1016/j. ajem. 2011. 02. 021
24. Metting Z, Rödiger LA, Regtien JG, van der Naalt J (2009) Delayed coma in head injury: consider cerebral fat embolism. ClinNeurolNeurosurg 111:597–600. https:// doi. org/ 10. 1016/j. cline uro. 2009. 03. 005 25. Lee J (2008) Gradient-echo MRI in defining the severity of cerebral fat
embolism. J ClinNeurol 4:164–166. https:// doi. org/ 10. 3988/ jcn. 2008.4. 4.
164
26. Hermann B, Brisson H, Langeron O et al (2018) Unexpected good out- come in severe cerebral fat embolism syndrome. Ann ClinTranslNeurol 5:988–995. https:// doi. org/ 10. 1002/ acn3. 596
27. De Feiter PW, Van Hooft MAA, Beets-Tan RG, Brink PRG (2007) Fat embo- lism syndrome: yes or no? J Trauma - Inj Infect Crit Care 63:429–431.
https:// doi. org/ 10. 1097/ 01. ta. 00002 34728. 27271. 1e
28. Guillevin R, Vallée JN, Demeret S et al (2005) Cerebral fat embolism: use- fulness of magnetic resonance spectroscopy. Ann Neurol 57:434–439.
https:// doi. org/ 10. 1002/ ana. 20388
29. Eguia P, Medina A, Garcia-Monco JC et al (2007) The value of diffusion- weighted MRI in the diagnosis of cerebral fat embolism. J Neuroimag- ing 17:78–80. https:// doi. org/ 10. 1111/j. 1552- 6569. 2006. 00068.x 30. Scarpino M, Lanzo G, Cappelli F et al (2016) Cerebral fat embolism
after video-assisted thoracic surgery. Ann ThoracSurg 102:e409–e411.
https:// doi. org/ 10. 1016/j. athor acsur. 2016. 04. 073
31. Acute hemorrhagic encephalomyelitis in childhood: Case report and literature review. https:// www. ncbi. nlm. nih. gov/ pmc/ artic les/ PMC31 73916/. Accessed 24 Dec 2020
32. Haller S, Vernooij MW, Kuijer JPA et al (2018) Cerebral microbleeds:
imaging and clinical significance. Radiology 287:11–28. https:// doi. org/
10. 1148/ radiol. 20181 70803
33. Luyt CE, Bréchot N, Demondion P et al (2016) Brain injury during veno- venous extracorporeal membrane oxygenation. Intensive Care Med 42:897–907
34. Gijs J, Lambert J, Meyfroidt G, Demeestere J (2018) Cerebral micro- bleeds and intracerebral hemorrhage associated with veno-venous extracorporeal membrane oxygenation. ActaNeurolBelg 118:513–515.
https:// doi. org/ 10. 1007/ s13760- 018- 0975-z
35. (2015) CORRESPONDENCE diffuse cerebral microbleeds after extracor- poreal membrane oxygenation support
36. Radmanesh A, Derman A, Lui YW et al (2020) COVID-19–associated diffuse leukoencephalopathy and microhemorrhages. Radiology 297:E223–E227. https:// doi. org/ 10. 1148/ radiol. 20202 02040 37. Cannac O, Martinez-Almoyna L, Hraiech S (2020) Critical illness-
associated cerebral microbleeds in COVID-19 acute respiratory distress syndrome. Neurology 95:498–499. https:// doi. org/ 10. 1212/ WNL. 00000 00000 010537
38. Thurnher MM, Boban J, Röggla M, Staudinger T (2021) Distinct pattern of microsusceptibility changes on brain magnetic resonance imaging (MRI) in critically ill patients on mechanical ventilation/oxygenation.
Neuroradiology. https:// doi. org/ 10. 1007/ s00234- 021- 02663-5 39. Akoh CC, Schick C, Otero J, Karam M (2014) Fat embolism syndrome
after femur fracture fixation: a case report. Iowa Orthop J 34:55–62 40. Molière S, Kremer S, Bierry G (2018) Case 254: posttraumatic migrating
fat embolus causing fat emboli syndrome. Radiology 287:1073–1080.
https:// doi. org/ 10. 1148/ radiol. 20181 60233
41. Bodanapally UK, Shanmuganathan K, Saksobhavivat N et al (2013) MR imaging and differentiation of cerebral fat embolism syndrome from diffuse axonal injury: application of diffusion tensor imaging. Neurora- diology 55:771–778. https:// doi. org/ 10. 1007/ s00234- 013- 1166-5 42. Chen JJS, Ha JC, Mirvis SE (2008) MR imaging of the brain in fat embo-
lism syndrome. EmergRadiol 15:187–192. https:// doi. org/ 10. 1007/
s10140- 007- 0664-3
43. Shobha N, Bermejo PG, Bhatia R et al (2011) Multimodal imaging tools for diagnosis of fat embolism. J Emerg Trauma Shock 4:306–308.
https:// doi. org/ 10. 4103/ 0974- 2700. 82232
44. Mittal MK, Burrus TM, Campeau NG et al (2013) Pearls & oy-sters: good recovery following cerebral fat embolization with paroxysmal hyper- activity syndrome. Neurology 81:e107–e109. https:// doi. org/ 10. 1212/
WNL. 0b013 e3182 a6ca3e
45. Yeap P, Kanodia AK, Main G, Yong A (2015) Role of susceptibility- weighted imaging in demonstration of cerebral fat embolism. BMJ Case Rep. https:// doi. org/ 10. 1136/ bcr- 2014- 207581
46. Fernández-Torre JL, Burgueño P, Ballesteros MA et al (2015) Super- refractory nonconvulsive status epilepticus secondary to fat embolism:
a clinical, electrophysiological, and pathological study. Epilepsy Behav 49:184–188. https:// doi. org/ 10. 1016/j. yebeh. 2015. 04. 045
47. Lützen N, Niesen WD, Kalbhenn J, Urbach H (2016) Teaching neuroim- ages: cerebral fat embolism after cemented hip replacement. ClinNeu- roradiol 26:249–250. https:// doi. org/ 10. 1007/ s00062- 015- 0474-z 48 Burns JD, Noujaim D, Scott BJ (2017) Susceptibility-weighted imaging
diagnosis of cerebral fat embolisfile. The Neurohospitalist 7:147. https://
doi. org/ 10. 1177/ 19418 74416 669284
49. Huang L-C, Wu M-N, Chen C-H, Huang P (2013) Susceptibility-weighted imaging in patient with consciousness disturbance after traffic acci- dent. Am J Emerg Med 31:261.e1–3. https:// doi. org/ 10. 1016/j. ajem.
2012. 03. 020
50. Zaitsu Y, Terae S, Kudo K et al (2010) Susceptibility-weighted imaging of cerebral fat embolism. J Comput Assist Tomogr 34:107–112. https:// doi.
org/ 10. 1097/ RCT. 0b013 e3181 a962c1
51. Dhakal LP, Bourgeois K, Barrett KM, Freeman WD (2015) The “starfield”
pattern of cerebral fat embolism from bone marrow necrosis in sickle cell crisis. The Neurohospitalist 5:74–76. https:// doi. org/ 10. 1177/ 19418 74414 554300
52. Gupta B, Kaur M, Dsouza N et al (2011) cerebral fat embolism: a diag- nostic challenge. Saudi J Anaesth 5:348–352. https:// doi. org/ 10. 4103/
1658- 354X. 84122
53. Huang P, Lin W-C, Huang P-K, Khor G-T (2009) Susceptibility weighted imaging in a patient with paroxysmal sympathetic storms. J Neurol 256:276–278. https:// doi. org/ 10. 1007/ s00415- 009- 0957-4
54. Zakhari N, Castillo M, Torres C (2016) Unusual cerebral emboli. Neuroim- aging Clin N Am 26:147–163. https:// doi. org/ 10. 1016/j. nic. 2015. 09. 013 55. Report C (2015) Concomitant fat embolism syndrome and pulmonary embolism in a patient with a femoral shaft fracture. 20–23. https://doi.
org/https:// doi. org/ 10. 1002/ ams2. 127
56. Buskens CJ, Gratama JWC, Hogervorst M et al (2008) Encephalopathy and MRI abnormalities in fat embolism syndrome: a case report. Med Sci Monit 14:125–129
57. Yanagawa Y, Kaneko N, Sakamoto T, Okada Y (2007) Fat embolism syn- drome with multiple hypointensity signals detected by head magnetic resonance imaging demonstrating a favorable outcome: a case report.
Am J Emerg Med 25:217–218. https:// doi. org/ 10. 1016/j. ajem. 2006. 06.
008
58. Kang JH, Hargett CW, Sevilis T, Luedke M (2018) Sickle cell disease, fat embolism syndrome, and “starfield” pattern on MRI. NeurolClinPract 8:162–164. https:// doi. org/ 10. 1212/ CPJ. 00000 00000 000443 59. Liauw L, van Buchem MA, Feuth JD et al (1998) Cerebral fat embolism.
EurRadiol 8:1059. https:// doi. org/ 10. 1007/ s0033 00050 515 60. Skalski KA, Kessler AT, Bhatt AA (2018) Hemorrhagic and non-hem-
orrhagic causes of signal loss on susceptibility-weighted imaging.
EmergRadiol 25:691–701. https:// doi. org/ 10. 1007/ s10140- 018- 1634-7 61. Lamotte G, Williams C (2017) Mystery case: a case of fulminant enceph-
alopathy in a 69-year-old woman. Neurology 89:e109–e114. https:// doi.
org/ 10. 1212/ WNL. 00000 00000 004288
62. Scheifer C, Lionnet F, Bachmeyer C et al (2017) cerebral fat embolism in hemoglobin SC disease. Am J Med 130:e187–e189
63. Gibbs WN, Opatowsky MJ, Burton EC (2012) Airp best cases in radiologic-pathologic correlation: cerebral fat embolism syndrome in sickle cellβ-thalassemia. Radiographics 32:1301–1306. https:// doi. org/
10. 1148/ rg. 32511 5055
64. Mossa-Basha M, Izbudak I, Gurda GT, Aygun N (2012) Cerebral fat embo- lism syndrome in sickle cell anaemia/β-thalassemia: Importance of susceptibility-weighted MRI. ClinRadiol 67:1023–1026. https:// doi. org/
10. 1016/j. crad. 2012. 03. 001
65. Kokatnur L, Rudrappa M, Khasawneh KR (2015) Cerebral fat embolism:
use of MR spectroscopy for accurate diagnosis. Ann Indian AcadNeurol 18:252–255. https:// doi. org/ 10. 4103/ 0972- 2327. 150604
66. Alobeidi F, Inusa BPD, Singh RR, U-King-Im JM (2015) Cerebral microhaemorrhages secondary to fat embolus syndrome in sickle cell disease. Postgrad Med J 91:55–56. https:// doi. org/ 10. 1136/ postg radme dj- 2014- 132984
67. Bollineni VR, Gelin G, Van Cauter S (2019) Cerebral fat embolism syn- drome. J Belgian SocRadiol 103:20. https:// doi. org/ 10. 5334/ jbsr. 1781 68. Chuang H-Y, Kung L-C, Huang M-Y (2018) An injured man with acute
altered mental status. Emerg Med J 35:148. https:// doi. org/ 10. 1136/
emerm ed- 2017- 206724
69. OliveraArencibia Y, Vo M, Kinaga J et al (2018) Fat embolism and non- convulsive status epilepticus. Case Rep Neurol Med 2018:1–4. https://
doi. org/ 10. 1155/ 2018/ 50576 24
70. Looby S, Royston D, Brett F (2017) Complicated fall in a 78-year-old lady.
Brain Pathol 27:109–110
71. Loupy A, Laissy JP, Klein I et al (2008) Fat emboli unleashed: an exceptional etiology of encephalitis in sickle cell disease. Ann Hematol 87:939–941
72. Medina FJ, Marquez JC, Castillo M (2012) Cerebral fat embolism detec- tion with susceptibility-weighted images in sickle cell disease. Neurora- diol J 25:411–414. https:// doi. org/ 10. 1177/ 19714 00912 02500 403 73. Singh DR, Chawla A, Peh WC (2018) Clinics in diagnostic imaging (184).
Fat embolism syndrome (FES). Singapore Med J 59:159–162. https://doi.
org/https:// doi. org/ 10. 11622/ smedj. 20180 29
74. Kammeyer R, Devnani R, Mehta R (2016) Cerebral fat embolism syn- drome mimicking thrombotic thrombocytopenic purpura in a patient with hemoglobin SC disease. Am J Hematol 91:539–542. https:// doi.
org/ 10. 1002/ ajh. 24286
75. Shaikh N, Mahmood Z, Ghuori SI et al (2018) Correlation of clinical parameters with imaging findings to confirm the diagnosis of fat embolism syndrome. Int J Burns Trauma 8:135–144
76. Godoy DA, Di Napoli M, Rabinstein AA (2018) Cerebral fat embolism:
recognition, complications, and prognosis. Neurocrit Care 29:358–365.
https:// doi. org/ 10. 1007/ s12028- 017- 0463-y
77. Xu X-L, Xu P, Zheng R-Q et al (2016) A case of cerebral fat embolism.
Chin Med J (Engl) 129:1761–1762. https:// doi. org/ 10. 4103/ 0366- 6999.
185870
78. Decaminada N, Thaler M, Holler R et al (2012) Brain fat embolism. A report of two cases and a brief review of neuroimaging findings. Neuro- radiol J 25:193–199. https:// doi. org/ 10. 1177/ 19714 00912 02500 207 79. Chiappa V, Gonzalez RG, Manian FA, Deshpande V (2016) Case 23–2016:
a 46-year-old man with somnolence after orthopedic surgery. N Engl J Med 375:370–378
80. Goenka N, Ropper AH (2012) Cerebral fat embolism. N Engl J Med 367:1045. https:// doi. org/ 10. 1056/ NEJMi cm110 0944
81. Aravapalli A, Fox J, Lazaridis C (2009) Cerebral fat embolism and the
“starfield” pattern: a case report. Cases J 2:212. https:// doi. org/ 10. 1186/
1757- 1626-2- 212
82. Herway ST, Slotto J, Harlan E, Newhouse B (2016) Cerebral fat embolism syndrome. Anesthesiology 124:1167
83. Duran L, Kayhan S, Kati C et al (2014) Cerebral fat embolism syndrome after long bone fracture due to gunshot injury. Indian J Crit Care Med 18:167–169. https:// doi. org/ 10. 4103/ 0972- 5229. 128707
84. Al-Shaer DS, Ayoub O, Ahamed NA et al (2016) Cerebral fat embolism syndrome following total knee replacement causing a devastating neurocognitive sequelae. Neurosciences 21:271–274
85. Rughani AI, Florman JE, Seder DB (2011) Clinical and radiographic improvement following cerebral fat emboli. Neurocrit Care 15:190–193.
https:// doi. org/ 10. 1007/ s12028- 010- 9388-4
86. Manousakis G, Han DY, Backonja M (2012) Cognitive outcome of cer- ebral fat embolism. J Stroke Cerebrovasc Dis 21:906.e1-906.e3. https://
doi. org/ 10. 1016/j. jstro kecer ebrov asdis. 2011. 07. 006
87. Forteza AM, Rabinstein A, Koch S et al (2002) Endovascular closure of a patent foramen ovale in the fat embolism syndrome: changes in the embolic patterns as detected by transcranial Doppler. Arch Neurol 59:455–459. https:// doi. org/ 10. 1001/ archn eur. 59.3. 455
88. Carlson DS, Pfadt E (2011) Fat embolism syndrome. Nursing (Lond) 41:72. https:// doi. org/ 10. 1097/ 01. NURSE. 00003 95312. 91409. 7f 89. Kumar S, Gupta V, Aggarwal S et al (2012) Fat embolism syndrome
mimicker of diffuse axonal injury on magnetic resonance imaging.
Neurol India 60:100–102. https:// doi. org/ 10. 4103/ 0028- 3886. 93597
90. Caricato A, Russo G, Biasucci DG, Annetta MG (2017) Fat embolism syndrome. Intensive Care Med 43:1411–1412. https:// doi. org/ 10. 1007/
s00134- 017- 4868-z
91. Uransilp N, Muengtaweepongsa S, Chanalithichai N, Tammachote N (2018) Fat embolism syndrome: a case report and review literature.
Case Rep. Med
92. Shaikh N, Parchani A, Bhat V, Kattren MA (2008) Fat embolism syn- drome: clinical and imaging considerations: case report and review of literature. Indian J Crit Care Med 12:32–36. https:// doi. org/ 10. 4103/
0972- 5229. 40948
93. Lin K-Y, Wang K-C, Chen Y-L et al (2015) Favorable outcome of cerebral fat embolism syndrome with a glasgow coma scale of 3: a case report and review of the literature. Indian J Surg 77:46–48. https:// doi. org/ 10.
1007/ s12262- 014- 1109-3
94. Whalen LD, Khot SP, Standage SW (2014) High-dose rosuvastatin treat- ment for multifocal stroke in trauma-induced cerebral fat embolism syndrome: a case report. PediatrNeurol 51:410–413. https:// doi. org/ 10.
1016/j. pedia trneu rol. 2014. 04. 025
95. Chen PC, Hsu CW, Liao WI et al (2013) Hyperacute cerebral fat embo- lism in a patient with femoral shaft fracture. Am J Emerg Med 31:1420.
e1-1420.e3. https:// doi. org/ 10. 1016/j. ajem. 2013. 05. 003
96. May J, Sullivan JC, LaVie D et al (2016) Inside out: bone marrow necrosis and fat embolism complicating sickle-β+ thalassemia. Am J Med 129:e321–e324
97. Marshall GB, Heale VR, Herx L et al (2004) Magnetic resonance dif- fusion weighted imaging in cerebral fat embolism. Can J NeurolSci 31:417–421. https:// doi. org/ 10. 1017/ s0317 16710 00035 65 98. Sethi D, Kajal S, Saxena A (2015) Neuroimaging findings in a case of
cerebral fat embolism syndrome with delayed recovery. Indian J Crit Care Med 19:674–677. https:// doi. org/ 10. 4103/ 0972- 5229. 169350 99. Yeo SH (2013) Pulmonary and cerebral fat embolism syndrome after
total knee replacement. J Clin Med Res 5:239–242. https:// doi. org/ 10.
4021/ jocmr 1251w
100. Shacklock E, Gemmell A, Hollister N (2017) Neurological effects of fat embolism syndrome: a case report. J Intensive Care Soc 18:339–341.
https:// doi. org/ 10. 1177/ 17511 43717 718664
101. You JS, Kim SW, Lee HS, Chung SP (2010) Use of diffusion-weighted MRI in the emergency department for unconscious trauma patients with negative brain CT. Emerg Med J 27:131–132. https:// doi. org/ 10. 1136/
emj. 2008. 066399
102. Nastanski F, Gordon WI, Lekawa ME (2005) Posttraumatic paradoxical fat embolism to the brain: a case report. J Trauma Inj Infect Crit Care 58:372–374. https:// doi. org/ 10. 1097/ 01. TA. 00001 08996. 10785. 0B 103. Han Y-T, Tang J, Gao Z-Q, Hu H-T (2016) Clinical features and neuroimag-
ing findings in patients with cerebral fat embolism. Chin Med J (Engl) 129:874–876. https:// doi. org/ 10. 4103/ 0366- 6999. 178963
104. Ryu CW, Lee DH, Kim TK et al (2005) Cerebral fat embolism: diffu- sion-weighted magnetic resonance imaging findings. ActaRadiol 46:528–533. https:// doi. org/ 10. 1080/ 02841 85051 00214 81
105. Sasano N, Ishida S, Tetsu S et al (2004) Cerebral fat embolism diagnosed by magnetic resonance imaging at one, eight, and 50 days after hip arthroplasty: a case report. Can J Anaesth 51:875–879. https:// doi. org/
10. 1007/ BF030 18883
Publisher’s Note
Springer Nature remains neutral with regard to jurisdictional claims in pub- lished maps and institutional affiliations.