Elsevier Editorial System(tm) for International Journal of Pharmaceutics
Manuscript Draft
Manuscript Number: IJP-D-18-00550R2
Title: Effect of delayed pMDI actuation on the lung deposition of a fixed-dose combination aerosol drug
Article Type: Research Paper
Section/Category: Personalised Medicine
Keywords: numerical drug deposition model, delayed device activation, drug deposition, beclomethasone dipropionate, formoterol fumarate Corresponding Author: Dr. Árpád Farkas,
Corresponding Author's Institution: Centre for Energy Research, Hungarian Academy of Sciences
First Author: Árpád Farkas
Order of Authors: Árpád Farkas; Alpár Horváth; Attila Kerekes; Attila Nagy; Szilvia Kugler; Lilla Tamási; Gábor Tomisa
Abstract: Lack of coordination between the beginning of the inhalation and device triggering is one of the most frequent errors reported in connection with the use of pMDI devices. Earlier results suggested a significant loss in lung deposition as a consequence of late actuation.
However, most of our knowledge on the effect of poor synchronization is based on earlier works on CFC devices emitting large particles with high initial velocities. The aim of this study was to apply numerical
techniques to analyse the effect of late device actuation on the lung dose of a HFA pMDI drug emitting high fraction of extrafine particles used in current asthma and COPD therapy. A computational fluid and
particle dynamics model was combined with stochastic whole lung model to quantify the amount of drug depositing in the extrathoracic airways and in the lungs. High speed camera measurements were also performed to
characterize the emitted spray plume. Our results have shown that for the studied pMDI drug late actuation leads to reasonable loss in terms of lung dose, unless it happens in the second half of the inhalation period.
Device actuation at the middle of the inhalation caused less than 25%
lung dose reduction relative to the value characterizing perfect coordination, if the inhalation time was between 2-5 s and inhalation flow rate between 30-150 L/min. This dose loss is lower than the
previously known values of CFC devices and further support the practice of triggering the device shortly after the beginning of the inhalation instead of forcing a perfect synchronization and risking mishandling and poor drug deposition.
Dear Editor,
Here we are sending you the second revision of the manuscript entitled „Effect of delayed pMDI actuation on the lung deposition of a fixed-dose combination aerosol drug” for consideration in your journal.
The manuscript has been carefully revised based on the minor comments of Reviewer
#2. To the best of our knowledge this is the first systematic numerical study quantifying the consequences of poor coordination between the start of inhalation and device actuation in case of an HFA pMDI drug with high extrafine particle fraction in terms of airway dose distributions. The work is based on experimental measurements of emitted plume characteristics and numerical modelling of airway deposition distributions for different inhalation flow rates, inhalation times and actuation delay times.
Thank you for considering the revised manuscript as a potential article in one of the future issues of the journal.
Yours Sincerely, Árpád Farkas PhD, Senior Research Fellow, Corresponding author
Centre for Energy Research, Hungarian Academy of Sciences Konkoly-Thege Miklós u. 29-33
1121 Budapest, Hungary
e-mail: farkas.arpad@energia.mta.hu Tel. +36-1-3922222 ext. 3404
Cover Letter
IJP AUTHOR CHECKLIST
Dear Author,
It frequently happens that on receipt of an article for publication, we find that certain elements of the manuscript, or related information, is missing. This is regrettable of course since it means there will be a delay in processing the article while we obtain the missing details.
In order to avoid such delays in the publication of your article, if accepted, could you please run through the list of items below and make sure you have completed the items.
Overall Manuscript Details
Is this the final revised version?X
Are all text pages present?X
Are the corresponding author’s postal address, telephone and faxnumbers complete on the manuscript?
X
Have you provided the corresponding author’s e-mail address?X
Manuscript type – please check one of the following:Full-length article
X
Review article
□
Rapid Communication
□
Note
□
Letter to the Editor
□
Other
□
Manuscript section – paper to be published in:Pharmaceutical Nanotechnology section
□
Personalised Medicine section
X
Manuscript elements
Short summary/abstract enclosed?X
3-6 Keywords enclosed?X
Complete reference list enclosed?X
Is the reference list in the correct journal style?X
Are all references cited in the text present in the reference list?X
Are all original figures cited in the text enclosed?X
Electronic artwork format? ---
Are figure legends supplied?X
Are all figures numbered and orientation provided?X
Are any figures to be printed in colour?X
If yes, please list which figures here: Figure 4
If applicable, are you prepared to pay for reproduction in colour?X
Are all tables cited in the text supplied?X
*Author Checklist
IJP-D-18-00550R1 Second revision
Answers to the minor comments of the reviewer
Ms. Ref. No.: IJP-D-18-00550R1
Title: Effect of delayed pMDI actuation on the lung deposition of a fixed-dose combination aerosol drug
International Journal of Pharmaceutics
The authors would like to thank again the reviewers for the careful review and the useful critics.
Hereon, we answer the minor comments of Reviewer #2:
Table 1b and associated discussion: In reality, it is not just droplets that are greater than 10 microns that collect on the inlet during cascade impactor testing. Due to the high velocity and high turbulence of the plume passing through the inlet particles even smaller than 10 microns are likely to collect. I think a more accurate way of referring to the inlet deposition would be "Unsized particles". Perhaps a comment that you are assigning the particles that collect in the inlet to be ">10 microns" even though they are not sized in the inlet would be sufficient to address this.
Indeed, some smaller particles may also deposit in the inlet. As suggested by the reviewer, we have changed the way we refer to the particles that collect on the inlet to ’unsized particles’. A short
comment on the assignement of particles depositing here to be ">10 microns" even though they are not sized was also included in the new version of the manuscript.
Page 10 - "The Flow splitting…" - "Flow" should not be capitalized.
Corrected to ’The flow splitting’.
The paragraph in Section 2.2 starting on page 9 and ending on page 12 is too long and should be broken down into multiple paragraphs.
For a better understanding the paragraph mentioned above was split into multiple paragraphs.
Label for Figure 2 is missing a period.
Corrected.
Bottom of page 13 - a comma is missing in "About 50 000 iteration steps…"
The comma was inserted.
Page 14 - Sentence starting "Through droplet evaporation rate depends…" is long and difficult to understand.
The sentence was split into three separate sentences.
*Response to Reviewers
IJP-D-18-00550R1 Second revision
Page 17 - replace "laryngeal get" with "laryngeal jet"
Replaced.
Page 19, line 4 - replace "nonzero" with "non-zero"
Replaced.
Page 23, sentence starting on line 3 - For clarity, consider rewording to "Most of the current drugs do not have a significant amount of drug in this size range."
It has been reworded to the suggested sentence.
Page 25, line 8 - replace "floe" with "flow"
Replaced.
Page 25, 4th line from the bottom - replace "The why this study focused…" with "The reason this study focused…"
Replaced according to the suggestion.
100% 92% 79%
delay
0.0 s 1.0 s delay 2.0 s delay
Normalized flow rate
1.0 0.8 0.6 0.4 0.2 0.0
Time (s)
0.0 0.5
Inhalation curve
1.0 1.5 2.0 2.5 3.0
*Graphical Abstract (for review)
Effect of delayed pMDI actuation on the lung deposition of a fixed-dose combination aerosol drug
Árpád Farkas1, Alpár Horváth3,4, Attila Kerekes2, Attila Nagy2, Szilvia Kugler2, Lilla Tamási3, Gábor Tomisa3,4
1Centre for Energy Research, Hungarian Academy of Sciences, Konkoly-Thege Miklós út 29-33, 1121 Budapest, Hungary
2Wigner Research Centre for Physics, Konkoly-Thege Miklós út 29-33, 1121 Budapest, Hungary
3Department of Pulmonology, Semmelwies University, Diós árok 1/C,1125 Budapest, Hungary
4Chiesi Hungary Ltd., Dunavirág u. 2, 1138 Budapest, Hungary
Keywords: numerical drug deposition model, delayed device activation, drug deposition, beclomethasone dipropionate, formoterol fumarate
Corresponding author:
Árpád Farkas
Centre for Energy Research Hungarian Academy of Sciences Konkoly Thege Miklós út. 29-33 1121 Budapest, Hungary
E-mail: farkas.arpad@energia.mta.hu Tel: +36 1 3922222 Ext. 3404 Fax: +36-1-3922712
*Manuscript
Click here to view linked References
Abstract
Lack of coordination between the beginning of the inhalation and device triggering is one of the most frequent errors reported in connection with the use of pMDI devices. Earlier results suggested a significant loss in lung deposition as a consequence of late actuation. However, most of our knowledge on the effect of poor synchronization is based on earlier works on CFC devices emitting large particles with high initial velocities. The aim of this study was to apply numerical techniques to analyse the effect of late device actuation on the lung dose of a HFA pMDI drug emitting high fraction of extrafine particles used in current asthma and COPD therapy. A computational fluid and particle dynamics model was combined with stochastic whole lung model to quantify the amount of drug depositing in the extrathoracic airways and in the lungs. High speed camera measurements were also performed to characterize the emitted spray plume. Our results have shown that for the studied pMDI drug late actuation leads to reasonable loss in terms of lung dose, unless it happens in the second half of the inhalation period. Device actuation at the middle of the inhalation caused less than 25% lung dose reduction relative to the value characterizing perfect coordination, if the inhalation time was between 2-5 s and inhalation flow rate between 30-150 L/min. This dose loss is lower than the previously known values of CFC devices and further support the practice of triggering the device shortly after the beginning of the inhalation instead of forcing a perfect synchronization and risking mishandling and poor drug deposition.
1. Introduction
One of the main advantages of pressurized metered dose inhalers (pMDI) over dry powder inhalers (DPI) is the emission of constant active pharmaceutical ingredient (API) doses. In case of pMDIs the amount of drug leaving the device and its size distribution are not influenced by the breathing capability of the patient. However, one of the main drawbacks of pMDIs is the need for simultaneous device actuation and inhalation. There are several studies in the open literature reporting on the high fraction of patients who are not able to synchronize device triggering and the beginning of the inhalation (e.g. Crompton, 1982; McFadden, 1995; Molimard et al, 2003; Ivanova et al, 2016). In these studies the frequency of patients who had inhalation-actuation difficulties varied between 27%- 51%. Azouz et al (2013) have reported that 14% of the patients actuated the device too early, while 35% of them actuated it too late (any actuation before the beginning of the inhalation was considered too early and more than 0.2 s delay after the beginning of the inhalation was considered too late). In their work early device actuation ranged between -0.04 s and -2.4 s, while late actuation between 0.24 s and 1.71 s. The effect of inhalation technique when using a metered dose inhaler including the coordination between pMDI device actuation and inhalation on lung deposition was extensively studied in several earlier experimental works (e.g. Newman et al, 1980; Lawford et al, 1983; Farr et al, 1995; Newman et al, 1995). The main conclusion of these works was that slow inspiration (inspiration time > 4s) with low flow rate (around 30 L/min) and actuation at the beginning of the inhalation resulted in the highest lung deposition. One of the most extended studies is the work of Farr et al (1995) who developed a microprocessor controlled pMDI (SmartMist) and performed scintigraphic deposition measurements of 99mTc labelled salbutamol (Ventolin) in healthy individuals.
They compared the lung deposition fractions corresponding to early and late device actuations at different inhalation flow rates ranging from 30 L/min to 270 L/min. Early actuation was defined as actuation at a point when 10% of the total inhaled air volume is inspired, while late actuation meant device actuation when 55% of the total air volume is already inhaled. Late actuation caused a
decrease of lung deposition fraction from 14.1% to 10.6% compared to early actuation, if the inhalation flow rate was 30 L/min. At 270 L/min flow rate the decrease was from 8.4% to 7.6%. The authors concluded that delayed actuation may lead to low lung deposition especially for high inhalation flow rates. One decade later, Leach et al (2005) studied the effect of mis-coordination on the deposited lung dose of BDP (beclomethasone dipropionate, QvarTM). They concluded that in case of a 3 s inhalation (breath-hold time: 10.5 s) a 1.5 s delay in the pMDI actuation caused less than 20% relative lung dose loss, while a 0.5 s early actuation resulted in more than 40% loss relative to the case of optimal coordination. The relatively low loss corresponding to late device actuation was assumed to be a consequence of small particles (MMAD around 1 m), lower spray force and temperature and longer spray duration of HFA (hydrofluoralkane), compared to CFC (clorofluorocarbon) propelled pMDIs. In their recent experimental work Biswas et al (2017) has demonstrated that contrary to the earlier results on CFC pMDI devices, aerosol deposition emitted from Ventolin HFA pMDI is most optimal for actuation in the first half of inspiration at flow rates between 60 L/min and 90 L/min. The results of the two last publications indicate that our knowledge on the effect of late actuation mostly based on earlier works on CFC devices needs to be updated.
This recognition has motivated the present numerical study, which proposes to analyse the effect of delayed pMDI firing on airway deposition. Among the advantages of numerical models over the experiments it is worth noting that a large variety of inhalation parameters and actuation delay times can be considered and there are no ethical barriers. In addition, computer simulations are fast, easily reproducible and cost effective. Different numerical techniques have been applied to quantify the deposition of medical aerosols emitted by both DPIs (e. g. Longest et al, 2016; Horváth et al, 2017;
Farkas et al, 2016) and pMDIs (e.g. Yousefi et al, 2017; Longest et al, 2012; Longest et al, 2016) . However, to the best of the author’s knowledge, a numerical analysis of the effect of late pMDI device actuation is still missing in the open literature. Therefore, the objective of this study was to
develop, validate and apply numerical models in order to quantify the effect of delayed device actuation on the lung dose of a HFA pMDI drug used in current asthma and COPD therapy.
2. Methods
The subject of our investigation was the Foster® pMDI inhalation solution (Chiesi Farmaceutici S.p.A.), containing a fixed-dose combination of beclomethasone dipropionate (corticosteroid) and formoterol fumarate (long-acting β2-agonist) used in current asthma and COPD therapy. Both experimental and computer modelling techniques were applied to study the airway deposition of this aerosol drug as a function of the degree of delay between the beginning of the inhalation and the actuation of the inhaler device. Transport and deposition of inhalation aerosols is a complex process depending on multiple factors related to the geometry of the airways, aerosol properties and breathing parameters. Most of the input data needed for the modelling of drug transport and deposition within the airways could be retrieved in the open literature. To correlate the modelling results with the experimental deposition measurements, particle size distribution and one of the simulated breathing patterns were taken from the work of de Backer et al (2010), who assessed the extrathoracic and lung doses of Foster® pMDI drug in healthy volunteers and asthmatic and COPD patients by scintigraphic measurements. Based on our recent work (Horváth et al, 2017) breath-hold time may significantly influence the lung deposition of drugs with high amount of fine and extrafine particles such as Foster®, therefore both 5 s and 10 s breath-holds were considered in this study. In addition, the computations were performed for 2 s, 3 s and 5 s inhalation times and the inhalation flow rates were 30 L/min, 60 L/min, 90 L/min, 120 L/min and 150 L/min. These breathing data complemented with the main aerosol parameters are summarised in Table 1a. These aerosol parameters are the mass median aerodynamic diameter (MMAD), geometric standard deviation (GSD) of the drug size distribution, the fraction of mass depositing in the device (as a percent of the metered mass), the fraction of unsized particles (droplets), which are emitted, but filtered out before entering the impactor (expressed as a percent of the metered dose) and the fine particle fraction (FPF,
Formatted: Indent: First line: 0 cm
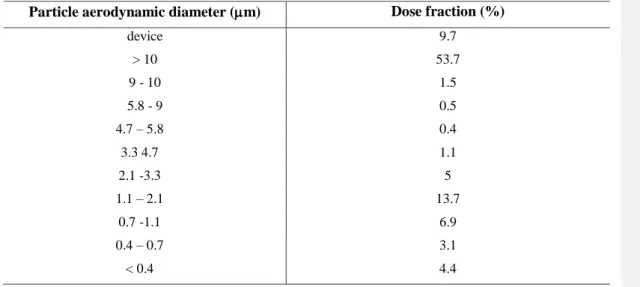
which is the mass fraction of particles with diameters smaller than 5 m expressed as a percent of metered dose). Table 1b contains the whole aerosol size distribution as measured by and adopted from De Backer et al (2010). Since aerodynamic properties of the beclomethasone (BDP) and formoterol (FF) components are pretty similar (Lewis et al, 2006), only the deposition of BDP was simulated in this study.
Table 1a. Breathing and aerosol parameters used in the model calculations. Unsized particle fraction is the percentage of the metered dose represented by the droplets deposited in the throat of the impactor in the experiment of De Backer et al (2010). In the present case these are the droplets with diameter >10 m, though some particles even smaller than 10 m are likely to be collected on the inlet. FPF – fine particle fraction
Breathing parameters Aerosol data
Inhaled volume (L) 1.5 and 2.5 MMAD (m) 1.4
Inhalation time (s) 2, 3 and 5 GSD 1.9
Breath-hold time (s) 5 and 10 Unsized particle fraction (%) 53.7
Exhalation time (s) 2, 3 and 5 FPF (%) 34.1
Flow rate (L/min) 30, 60, 90, 120 and 150
Table 1b. Size distribution of BDP adopted from De Backer et al (2010)
Particle aerodynamic diameter (m) Dose fraction (%)
device 9.7
> 10 53.7
9 - 10 1.5
5.8 - 9 0.5
4.7 – 5.8 0.4
3.3 4.7 1.1
2.1 -3.3 5
1.1 – 2.1 13.7
0.7 -1.1 6.9
0.4 – 0.7 3.1
< 0.4 4.4
Formatted: Line spacing: single
Formatted: Font: Symbol
Formatted: Font color: Accent 5
2.1 Description of the experimental technique
Foster® has been developed based on the Modulite® technology. This technology enables modulation of aerosol cloud formation with well-defined aerodynamic particle sizes and plume speeds. For this purpose the non-volatile content of a solution formula, actuator orifice geometry (length and diameter), metered volume and vapour pressure of the propellant are optimized.
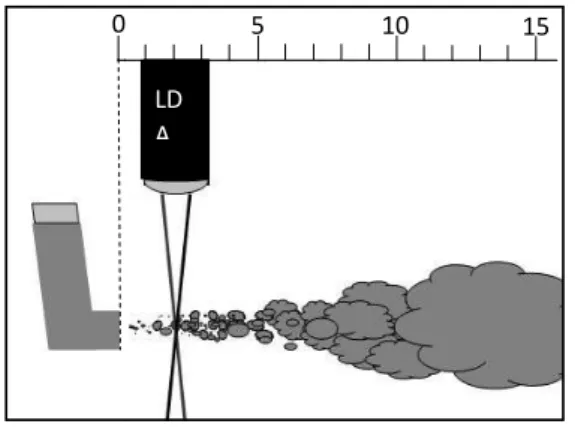
(Ganderton et al, 2002; Lewis et al, 2004; Lewis 2016; Gavtash et al, 2017). However, the exact values of the plume parameters of Foster® pMDI needed for the modelling of drug deposition could not be found in the literature. The scope of the experimental measurements was to provide missing input data for the numerical model. One of the parameters measured in this work was the duration of the emitted aerosol bolus. This important parameter depends on several factors related to the inhaler, propellants and formulation. Most of the commercialized HFA pMDI products have plume durations between 0.1 - 0.5 s (Hochrainer et al, 2005; Gabrio et al, 1999; Johal et al, 2015). To measure the plume duration of Foster® a high speed camera (Basler scA640-120gm, Ahrensburg, Germany) with a maximum time resolution of 120 frames/s, but set to 100 frames/s has been used and five independent measurements were performed. Another key parameter from the perspective of aerosol drug deposition is spray velocity, which was measured by Laser Doppler Anemometry (LDA) technique. The LDA equipment is an in house development of the authors (Kerekes et al, 2016). The laser beam was perpendicular to the plume axis with the source situated at a working distance of 40 mm. By this technique velocities of individual particles with diameter larger than 0.5 m can be determined. The sampling volume was 15×80×80 m3. Axial velocity values were measured in a plane perpendicular to the plume axis at 20 mm distance from the mouthpiece, that is, at 45 mm from
the nozzle orifice, then at 40 mm and 120 mm from the mouthpiece. The near orifice value of the axial velocity has been estimated by extrapolating the measured values. It was assumed that the spray plume follows quasi-steady plume relationships described by Abramovich (1976), that is, the velocity is inversely proportional to the distance from the source as described by
(1)
equation, where vcl and vref are centreline and reference velocities, d is the distance to the spray orifice, ds is the distance from the spray orifice exit to the effective plume source location, while Dso denotes the diameter of the orifice (0.3 mm in case of Foster® inhaler, see Lewis, 2016). The scheme of the experimental setup is demonstrated in Figure 1. Beside spray duration and velocity, plume cone angle is also an important parameter influencing upper airway deposition (and indirectly also lung deposition). A few cone angle measurements are available in the published literature. For instance, Oliveira et al (2013) have measured a value of 14º for the cone angle of salbutamol HFA pMDI. However, the value corresponding to Foster® pMDI could not be found in the open literature, thus it was measured in this work. In a recent work Yousefi et al (2017) have demonstrated that the effect of spray cone angle on particle deposition was more significant than effect of the initial spray velocity, thus effort has been spent to precisely determine this parameter.
Figure 1. Scheme of the experimental setup for the measurement of spray velocity
0 5 10 15
LD A
Formatted: Font: 8 pt
2.2 Description of the computational model
In our earlier works we have applied a whole respiratory system stochastic particle deposition model for the simulation of the deposition of drugs emitted by DPIs (dry powder inhaler; e.g. Farkas et al, 2016; Horváth et al, 2017, Farkas et al, 2017). The inhaled particles are tracked through a stochastic asymmetric lung structure by randomly selecting the sequence of airways for each individual particle and the application of stochastic modeling techniques (Monte Carlo method).
The airway geometry is based on rigorous statistical analyses of the extensive morphometric data sets of bronchial (Raabe et al. 1980) and alveolar (Haefeli-Bleuer and Weibel 1988) airways. This morphology describes the inherent asymmetry and variability of the human airway system. The variability of airway diameters, lengths, branching and gravity angles, constrained by correlations among some of these parameters, is mathematically described by probability density and correlation functions. In agreement with the database of Raabe et al. (1980), in this model the bronchial airways contain both the bronchi and the bronchioli, starting from the trachea (as generation 1) and ending with the terminal bronchioles. The airway generation number of a terminal bronchiolus varies between 12 and 21. The acinar airways start with the respiratory bronchioles, which have generation numbers between 13 and 22, and contain the alveolar ducts, the alveoli and the alveolar sacs. The maximum generation number, corresponding to alveolar sacs, varies between 18 and 33. In the airway segment corresponding to airway generations 13–21 one part of the airways is still bronchial but another part is already acinar. In this study, the joint bronchial and acinar airways are termed as lung.
For the simulation of particle transport through this stochastic lung structure, individual particles are tracked. At airway bifurcations the particles enter one of the daughter branches with probabilities proportional to the airflow splitting. The flow splitting between the two asymmetric daughter airways is assumed to be related to the peripheral air volume supported by each of them.
Deposition of particles in a given airway generation is computed by analytical equations describing the average deposition of many particles in cylindrical airways due to inertial, gravitational and Brownian forces (Koblinger and Hofmann 1990). In the oro-pharyngeal region particle deposition is computed by empirical equations derived by Cheng (2003). Due to the variability of the airway geometry and related flows, particle deposition may vary along different paths. Thus, penetration probabilities to a given airway generation, i.e., the probability of inhaled particles to reach that airway generation, exhibits significant fluctuations, depending on the individual history of each particle in upstream airways. By simulating the random paths of many particles, typically of the order of tens of thousands, statistical means can be calculated for total, regional and generational deposition, providing also information on the underlying statistical distributions.
However, the upper airway sub-model of the stochastic deposition model cannot be applied for the inhalation phase in case of pMDI aerosols. The empirical formulas integrated in the stochastic deposition model were deduced for solid particles with the same entrance velocity as the velocity of the inhaled air, which is the case of DPI drugs. In the case of the aerosols emitted by pMDIs the velocity of the aerosol exceeds the velocity of the inhaled airflow and evaporation of the propellant solvent takes place, thus the above empirical formulas cannot be applied. Therefore, we replaced the upper airway part of the stochastic model by a finite volume numerical method applied in a 3D reconstructed mouth-throat-larynx geometry.
Due to computing power limitations and the impossibility to digitally reconstruct many millions of units of the whole airway system, a fully CFPD (computational fluid and particle dynamics) based simulation was not a viable option. In this way our deposition model became a hybrid computational model with a CFPD based sub-model for the computation of upper airway deposition during inspiration and a stochastic analytical lung model for the modelling of lung deposition during inspiration, breath-hold and expiration and for the computation of extrathoracic deposition during
expiration. Since the stochastic model has been presented in details in our recent works, here we restrict to the presentation of the CFPD sub-model.
For the prediction of drug particle trajectories during inspiration the inhaled air and the propellant gas were considered as continuums in which discrete droplets were injected (Euler-Lagrange approach). The first step of the modelling was the reconstruction of the three dimensional geometry of the inhaler and the upper airways of interest (oral cavity, pharynx, larynx, and beginning of the trachea). The digital replica of the pMDI geometry has been constructed by CAD (computer aided design) techniques. The three dimensional oral model was derived from the human cast of Cheng et al (1999). Unlike the original replica, present geometry has circular cross sections with diameters equal to the hydraulic diameters measured from the cast. Other minor modifications suggested by Kleinstreuer and Zhang (2003) were made at the level of soft palate, mouth inlet and at the glottis.
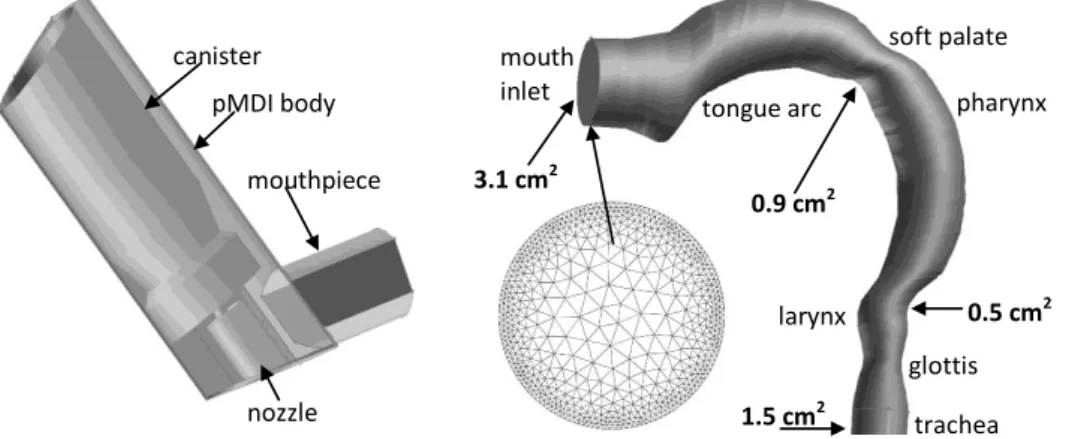
Figure 2 demonstrates the reconstructed three dimensional geometry of the inhaler and upper airways with cross-sectional areas at a few anatomically relevant locations. The inhaler and airway geometries were unified to simulate their relative position during the inhalation of the drug and the unified 3D body has been spatially discretized by the application of an unstructured tetrahedral mesh.
For this purpose the GAMBIT code (version 2.2.30) was used, which is a pre-processor of FLUENT.
The mesh density was higher near the boundaries, where higher gradients of flow parameters are expected. This has been achieved by using a ‘size function technique’ included in GAMBIT. A mesh independency study has been performed. The mesh was consecutively refined until the converged solution of the monitored flow parameters remained constant. This resulted in a total number of 2.2 million control volumes (cells). A cross section of the mesh corresponding to the mouth inlet can also be seen in Figure 2.
Figure 2. Three dimensional models of the inhaler (left) and the oral – pharyngeal - laryngeal airways (right). The front sidewall of the inhaler has been “removed” to make the inside components visible. A cross section of the numerical mesh corresponding to the mouth inlet is also demonstrated
The inhaled airflow was modelled both in the inhaler and the oro-pharyngeal-laryngeal geometry.
The density of the air was 1.23 kg/m3, while its viscosity was 1.79×10⁻⁵ kg/(m s). Based on our earlier work (Farkas et al, 2006) and also the work of Longest and Vinchurkar (2007) the Low Reynolds Number (LRN) k- turbulence model is suitable for the modelling of the airflow in this region of the airways. Transport equations of mass, momentum, turbulent kinetic energy and its dissipation rate were solved numerically by the solver of the commercially available FLUENT CFD code (version 6.1.22). A finite volume method has been applied to numerically solve the mathematical equations describing the air flow. The integral forms of the equations were discretized.
Each discrete governing equation was linearized implicitly, then a Gauss-Seidel point implicit linear equation solver was used in conjunction with an algebraic multigrid (AMG) method. For the computation of cell face values, a second-order upwind scheme was applied. At the end of every iteration step, scaled residuals were computed for each conserved variable. Convergence was speed up by fine tuning the under-relaxation factors. About 50,000 iteration steps were needed. All the scaled residuals fell below 10-4 and remained nearly constant over the last 5,000 iteration steps. As boundary conditions, constant air velocity (2.68 m/s, 5.36 m/s, 8.04 m/s, 10.72 m/s and 13.4 m/s
trachea glottis soft palate mouth
inlet
tongue arc pharynx
larynx 3.1 cm2
0.9 cm2
0.5 cm2
1.5 cm2 canister
pMDI body
nozzle mouthpiece
Formatted: Indent: First line: 0.5 cm
corresponding to 30 L/min, 60 L/min, 90 L/min, 120 L/min and 150 L/min inhalation flow rates) and 3% turbulence intensity was assumed at the inhaler airflow inlet and zero gauge pressure was prescribed at the outlet boundary surface.
The next step of the simulation would be to include spray injection into the stabilized airflow field.
Due to evaporation of formulation inside the pMDI actuator the emitted spray is a mixture of droplets and vapour. It is difficult to assess the size distribution of the droplets at near orifice region, but it is known that due to the rapid evaporation of the propellant the size of droplets decreases drastically. Droplet evaporation rate depends on several factors being influenced, among others, by the concentration and vapour pressure of the cosolvent (Sheth et al, 2017). However, it was demonstrated that for pMDI and drug-solvent-cosolvent physico-chemical properties close to the present case key plume dynamics in terms of interphase phenomena takes place only in near-orifice region. After an axial distance of 30 mm from spray orifice (which in our case approximately corresponds to the exit of the mouthpiece) the droplets reach their final size and temperature (Gavtash et al, 2016).
In this work the change of droplet sizes was not modelled, but the airflow field of the gas phase propellant was determined and polydisperse particles with constant diameters were tracked in the computed air and propellant flow field. Neglecting the rapid change of particle diameter within the first 3 cm after the nozzle orifice may induce error mainly in the estimation of particle deposition within the inhaler. However, for this region the experimentally measured deposition fraction (9.7%, De Backer et al, 2010) was adopted in this study instead of the numerical solution. Since intensive momentum change between evaporating and slowing down droplets and air is neglected in the first 3 cm after the nozzle orifice, deposition outside the device (in the oral cavity) could also be indirectly affected. However, Longest et al (2012) have demonstrated by comparison of numerical results with experimental measurements that the assumption of constant particle size is not inducing significant errors in the estimation of upper airway deposition fractions.
In this study the formulation exiting the nozzle was assumed to be at the HFA 134a boiling point for atmospheric pressure. Conservation of mass was used to estimate the density of the slurry exiting the nozzle. The velocities of the propellant and particles were assumed to be the same at the orifice exit. Particlesize distribution was derived from the work of De Backer et al (2010). Unit density particles were tracked, since measured aerodynamic diameters were adopted in this study. The main characteristics of the distribution are depicted in Table 1a, while the whole aerosol size distribution is presented in Table 1b. As far as the implementation of the PSD is concerned, series of monodisperse particles were tracked (with diameters corresponding to the cut-offs of the impactor), then deposition fraction was determined as the weighted sum of the monodisperse deposition fraction values. The weights were identical to the values in the last column of Table 1b.
The particles were released into the computational domain at the location of the nozzle orifice with initial velocity deduced from our measurements (see above). The velocity vectors of the particles were inside a cone with the opening angle determined by our own measurements. Particle trajectories were determined based on the computed airflow field by numerically integrating their force balance equations. It was considered that a particle deposits if its trajectory intersects the wall of the airways.
The considered deposition mechanisms were inertial impaction, gravitational settling and turbulent dispersion. The last mechanisms was modelled by the application of a “discrete random walk” model included in FLUENT solver. In this model a particle interacts with a succession of random discrete turbulent eddies, with each eddy defined by a lifetime, length, and velocity scale.
2.3 Model validation
The stochastic deposition model used in this work for the modelling of particle deposition in the lungs at inhalation and breath-hold, and in the whole respiratory system at exhalation has been validated in our recent works by the help of scintigraphic deposition measurements (e.g. Farkas et al,
Formatted: Indent: First line: 0.5 cm
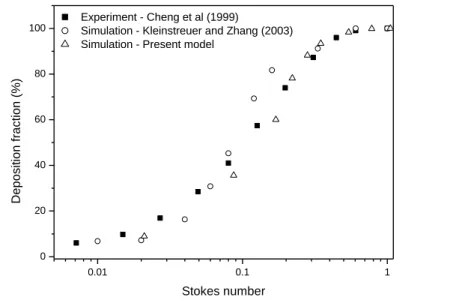
2016). Therefore, here we restrict to the validation of our CFPD model described in the previous paragraph. The results of the simulations of monodisperse particle upper airway deposition were compared to the experimental measurements of Cheng et al (1999) and to the simulation results of Kleinstreuer and Zhang (2003) who simulated the efficiency of particle deposition in the same upper airway geometry. In this case the inhaler was missing and both the air and the particles entered the airway geometry at the mouth inlet. The results of this comparison are presented in Figure 3. The Stokes number is defined here as by Cheng et al. (1999), i.e., St = pdp2v/9D, with v being the mean velocity evaluated as (Q/A), where A is the mean cross-sectional area (4.43 cm2) and D is the minimum hydraulic diameter (1.71 cm). In addition, p denotes the density of the particles, dp is particle diameter and is the viscosity of air. Our simulated deposition values reasonably retrace the trends depicted by the data points of the above investigators. The good agreement suggests that our CFPD model can appropriately estimate the deposition of aerosol drugs within the upper airways.
Figure 3. Comparison of deposition fractions obtained by the current CFPD model with the experimental data of Cheng et al (1999) and simulation results of Kleinstreuer and Zhang (2003)
Results and discussion
0.01 0.1 1
0 20 40 60 80 100
Deposition fraction (%)
Stokes number Experiment - Cheng et al (1999)
Simulation - Kleinstreuer and Zhang (2003) Simulation - Present model
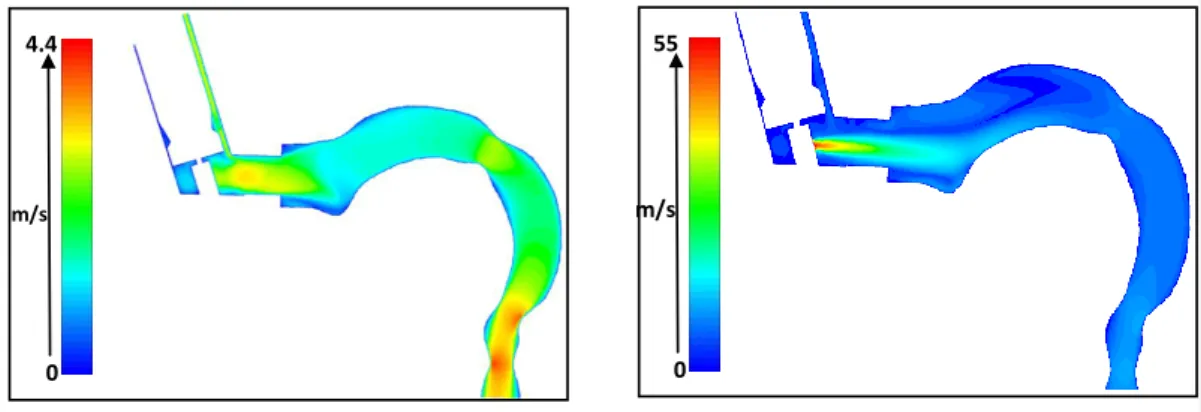
The simulated inspiratory airflow in the pMDI device and in the upper airways for 30 L/min flow rate is demonstrated in Figure 4, left panel. The air enters the inhaler with a mean velocity of 2.68 m/s and flows downwards around the canister. At the entrance to the mouth geometry the air velocity profile becomes skewed towards the bottom surface of the mouthpiece. However, inside the oral cavity the direction of the air becomes upward because the arch of the tongue. Due to the curvature the flow is then directed towards the throat. As a result of the decrease of the cross sectional surface area at the level of the larynx the flow accelerates and a so called „laryngeal jet” appears, which is located approximately at the centre of the tube, but closer to the inner (front) side of the geometry.
The results related to spray injection into the stabilised airflow field are shown in Figure 4, right panel. The velocity field in the mid-plane demonstrates a deceleration of the propellant with the increase of axial distance from the nozzle due to the momentum exchange with the air. The propellant and airflow characteristics will evidently influence particle deposition patterns. However, particle deposition simulations require a few plume parameters which were measured in this study.
Therefore the results of these measurements will be presented first.
Figure 4. Simulated inspiratory air (30 L/min flow rate, left panel) and air plus propellant (right panel) velocity contours coloured by velocity magnitude in the mid-sagittal symmetry plane of the inhaler and upper airways
0 4.4 6
m/s
0 55 .8
m/s
Formatted: Indent: First line: 0.5 cm
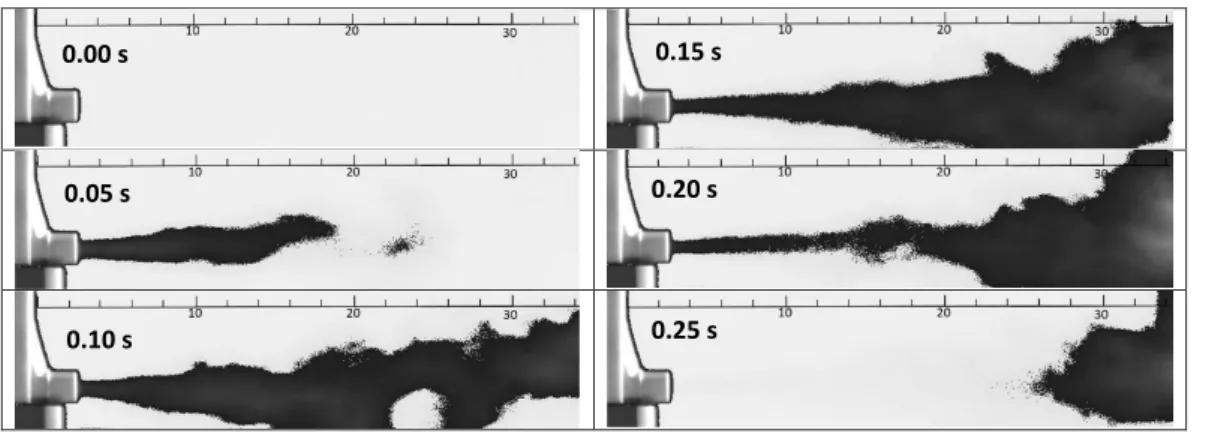
Figure 5 shows selected high speed camera images recorded during the emission of aerosol bolus in quiescent air. The figure presents the plume structure at 0.05 s time intervals from the beginning of the emission, but the high speed camera images were detected at a time resolution of 100 s-1. Our plume visualization experiments provided a mean value of 0.194 s for the spray duration and a standard deviation of 0.005 s. This mean value was used in the present aerosol drug transport and airway deposition simulations. Besides spray duration, the visualization of plume patterns allowed us the measurement of spray cone angle, as well. Our measurements yielded a value of 14º for the whole cone opening (angle of cone generators in the same planar cone section), which means that the maximum injection angle (angle of particle entrance velocity vector and the axis perpendicular to the circular inlet in figure 2) was 7º. The measured axial plume velocity at 2 cm from the inhaler exit was 14±1.2 m/s. The same values at 4 cm and 12 cm were 6.9±0.6 m/s and 0.7±0.3 m/s, respectively.
Fitting the best curve to these values based on equation 1 and extrapolating to the location of the orifice yielded 55 m/s initial axial velocity.
Figure 5. High speed camera images of an aerosol bolus emitted by Foster® pMDI taken at different moments of the actuation. For better visualization the colours were inverted and an image filter was applied. The length scale is provided in cm
0.25 s 0.10 s
0.20 s 0.05 s
0.15 s 0.00 s
The computed airflow fields, the measured plume parameters, the aerosol characteristics derived from the open literature (Tables 1a and 1b) and the selected breathing parameters were used to determine the extrathoracic and lung doses. The simulations were performed assuming perfect coordination (zero delay time) and for different non-zero actuation delay times. Based on our numerical simulation results at a fixed flow rate the extrathoracic deposition fractions did not change significantly by the variation of delay time. For instance, assuming 30 L/min inhalation flow rate and 10 s breath-hold the extrathoracic deposition fractions were between 51.2%-54.4%, expressed as a percent of the metered dose. The change in upper airway deposition dose for different flow rates and 10 s breath-hold varied between 51.2%-60.1%. This moderate extrathoracic deposition fraction variance as a function of flow rate and actuation delay time is due to the special size distribution of the studied drug. As demonstrated in Table 1a, 53.7% of the emitted aerosol particles are droplets with diameter larger than 10 m, while the second half of the particles are very small with an MMAD of only 1.4 m. Actually, the large droplets contain primarily propellant and ethanol rather than the residual particles, which is the case of the second mode (particles smaller than 2 microns).
The probability of upper airway deposition of the fraction of large droplets is very high at every studied flow rate, while extrathoracic deposition of the aerosolized fraction (< 10 m) is constantly low and hardly influenced by inhalation flow rate due to the very high subfraction of extrafine (< 2
m) particles. By the same token, impaction of large droplets in the upper airways takes place within
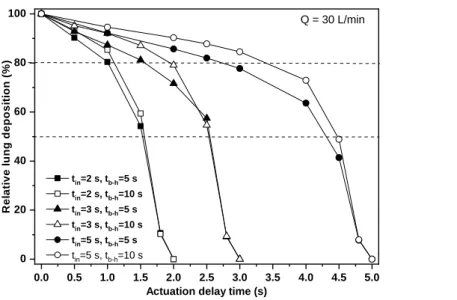
milliseconds after the emission of the drug, which is a very short time compared to the inhalation time and even compared to the duration of the puff. Therefore, the influence of delay time to the extrathoracic deposition fraction is also low. Figure 6 presents the relative lung deposition (ratio of deposition fraction at delayed actuation to the deposition fraction at perfect coordination) values as a function of actuation delay time for 30 L/min inhalation flow rate (which is recommended by current guidelines, see GINA 2018) , 2 s (upper panel), 3 s (middle panel) and 5 s (bottom panel) inhalation time, 5 s and 10 s breath-hold and 2 s (upper panel), 3 s (middle panel) and 5 s (bottom panel)
Formatted: Font color: Auto
exhalation time. The figure demonstrates that for a firing at the middle of inhalation the relative loss of lung dose is less than 20%, while 50% relative loss corresponds to firing in the last quarter of the inhalation period. The decrease of lung deposition proved to be very high only when actuation happened at the very end of the inhalation period. The absolute values of the lung dose for zero actuation delay expressed as a percent of the metered dose were 26.6%, 29.4% and 32.6% for 2 s, 3 s and 5 s inhalation times and 5 s of breath-hold, and 30 %, 32% and 34.2% for 2 s, 3 s and 5 s inhalation times, respectively, if the breath-hold time was 10 s. The absolute values of lung doses for different actuation delay times can be computed by multiplying the above values with the values (between 0 and 1) corresponding to the actuation delay time in Figure 6. It is worth noting that all the results of Figure 6 refer to 30 L/min. inhalation flow rate, but only a low fraction of patients inhale with such a low flow rate. Indeed, our measurements on 27 healthy individuals inhaling through the same pMDI inhaler of Chiesi have shown that the average peak inspiratory flow rate (PIF) was 143 L/min. In addition, our measurements on 17 COPD patients with different degrees of disease severity yielded an average inhalation peak flow of 99.6 L/min (Jókay et al, 2015). The results of Al-Showair et al (2007) are in agreement with our measurements (average PIF=110 L/min for COPD patients).
Figure 6. Computed lung deposition in case of late actuation relative to the deposition at perfect coordination as a function of actuation delay time assuming 2 s, 3 s and 5 s inhalation time and 5 s
0.0 0.5 1.0 1.5 2.0 2.5 3.0 3.5 4.0 4.5 5.0 0
20 40 60 80 100
Relative lung deposition (%)
Actuation delay time (s) tin=2 s, tb-h=5 s
tin=2 s, tb-h=10 s tin=3 s, tb-h=5 s tin=3 s, tb-h=10 s tin=5 s, tb-h=5 s tin=5 s, tb-h=10 s
Q = 30 L/min
and 10 s breath-hold after the inhalation phase. Q – flow rate; tin – inhalation time; tb-h – breath-hold time; tout – exhalation time
In a work of Ammari and Chrystyn (2013) 29 out of 34 asthmatic patients had PIF > 90 L/min.
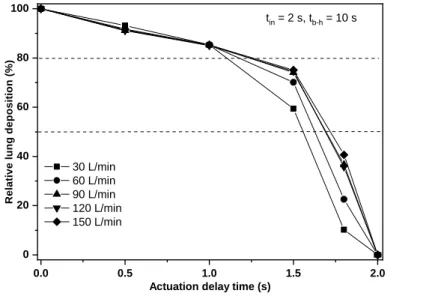
Moreover, there is increasing evidence that optimal flow rate through HFA pMDIs may be higher (e.g. Biswas et al, 2017; Cheng et al, 2001).Haidl et al (2016) have defined a maximum flow rate of 120 L/min as a “useful upper limit” for HFA pMDIs. Therefore, present investigations were extended also to higher inhalation flow rates. Deposition distribution of Foster® has been computed for 60 L/min, 90 L/min, 120 L/min and 150 L/min inhalation flow rates and different actuation delay time values. In these simulations the inhalation time was 2 s, the breath-hold time was 10 s and the exhalation time was 2 s. Figure 7 demonstrates the evolution of lung doses as a function of the delay time of the actuation compared to the beginning of the inhalation for the five selected flow rates. The lung dose on the vertical axis is expressed as a percent of lung dose at perfect coordination.
Figure 7. Effect of late actuation on the lung dose for different inhalation flow rates. The lung dose on the vertical axis is expressed as a percent of lung dose at perfect coordination (zero delay time).
tin – inhalation time; tb-h – breath-hold time; tex –exhalation time
In Figure 7 the total inhaled volume rises with increasing flow rate at 2 s fixed inhalation time from 1 L (at 30 L/min) to 5 L (at 150 L/min), but 5 L of inhaled air may seem too much. Our flow
0.0 0.5 1.0 1.5 2.0
0 20 40 60 80 100
Relative lung deposition (%)
Actuation delay time (s) 30 L/min
60 L/min 90 L/min 120 L/min 150 L/min
tin = 2 s, tb-h = 10 s
measurements revealed that healthy individuals inhaled 3.7 L of air (range: 2.6-5.1) through Foster® pMDI. Patients may inhale less air volume than healthy individuals, thus considering the highest flow rate may have only academic importance. However, the role of Figure 7 was to capture the main tendencies by increasing the flow rate. The tendencies are so clear that avoiding the highest flow rate (which may be not realistic (due to the above reason) would not influence the outcome of the figure. The figure demonstrates that the tendencies observed for 30 L/min hold also for higher flow rates and actuation of the pMDI as late as the middle of the inhalation period causes a relative lung dose loss of less than 20%. Nevertheless, this loss could lead to significantly lower lung doses at high flow rates if the absolute value of lung dose was sensitive to the flow rate. However, our simulation results have shown that for 0 s actuation delay the value of lung dose as a percent of metered dose decreased from 30% to only 26.4%, while the flow rate increased from 30 L/min to 150 L/min. The physical reason for the low change in the lung doses is due to the high fraction of the emitted extrafine particles. Deposition of these particles is mostly due to gravitational settling and possibly thermal diffusion, while impaction becomes less important. The last mechanism could be important mainly for particles smaller than 100 nm. Most of the current drugs do not have a significant amount of drug in this size range. However, deposition by gravitational settling depends on the residence time rather than on flow rate. This fact reflects also in the presently computed only slightly changing lung doses. Based on these results lung deposition of Foster® remains higher than 20% even at high flow rates and actuation at the middle of inhalation phase. Since patients with such a poor inhalation-actuation and inhaling with undesirable high flow rate receive more than two thirds of the lung dose characteristic of the ideal case of perfect coordination and low flow rate, for the studied drug the probability of the worsening of the clinical outcome is low. Since drug receptors are nonuniformly distributed within the lung, from the perspective of therapeutic effect it would be interesting to further differentiate lung deposition. Technically this would be possible, since the stochastic deposition model is able to provide the deposited amount even at airway generation level.
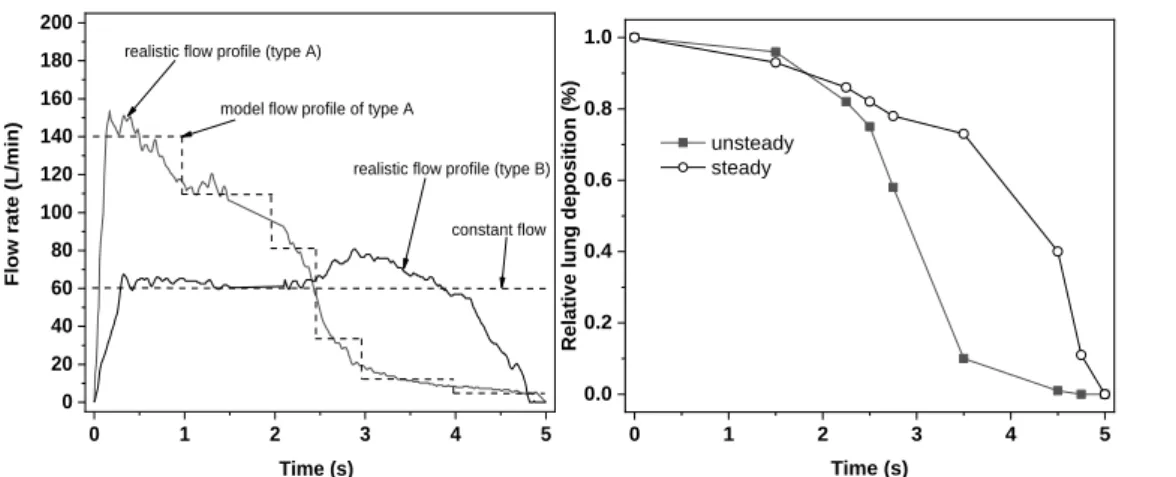
However, this was not the scope of the current work. More importantly, based on the present results for individuals with decreased lung capacity (severe COPD patients, old patients) and for whom the use of DPIs is not an appropriate choice, and who are not able to perfectly synchronize pMDI actuation with their breathing but who are able to actuate the pMDI in the first half of the inhalation phase, the use of Foster pMDI can also be a viable option. It is also worth noting that even the inhalation through breath-actuated devices leads to some delay in drug emission. For instance, the release of the drug from the Autohaler® breath-actuated device begins at a mean delay time of 0.18 s after the beginning of the inhalation (Leach et al, 2005). Present results also suggest that the effect of delayed actuation on the dose deposition within the lungs of the patients could be more pronounced for drugs with higher fractions of large emitted particles. However, the demonstration of this hypothesis falls beyond of the scope of the present work. Since most of our perceptions on the effect of poor coordination are based on earlier works on CFC pMDIs with higher spray velocity and emitting higher fractions of large particles, studies on currently marketed HFA pMDIs emitting drugs with different particle size distributions are highly needed. It is worth noting that the results in figures 6 and 7 refer to constant inhalation flow rates. In reality the inhalation flow curve can have various shapes. The left panel of Figure 8 demonstrates two realistic flow profiles selected from our database of curves emerging while patients inhale through the Foster® device. The two curves were selected based on inhalation time (about 5 s) and the mean flow rate (about 60 L/min) to compare them with the case of 60 L/min constant flow. One of the curves (type A) shows a case when the patient inhales forcefully at the beginning of the inhalation then the flow rate decreases, while the second curve (type B in the figure) corresponds to a patient who was able to breath with a relatively constant force. Most of the inhalation profiles fall between these two cases. Since it is not expected that profile B will lead to results significantly different from the case of constant flow rate, only the deposition corresponding to profile A was computed. Although the upgrade of our hybrid numerical model to unsteady cases is in progress, at this moment only steady flows can be simulated. Therefore,
the type A flow profile was approximated with a stair-shaped profile (see the left panel of Figure 8).
The corresponding inhalation flow rates were 140 L/min between 0 s and 1 s, 110 L/min between 1 s and 2 s, 80 L/min between 2 s and 2.5 s, 30 L/min between 2.5 s and 3 s, 10 L/min between 3 s and 4 s and 5 L/min between 4 s and 5 s.
Figure 8. Realistic and idealized inhalation flow profiles (left panel) and relative lung deposition as a function of actuation time for realistic unsteady (typeA) and constant flows. Q = 60 L/min; Tin = 5 s
Figure 8 demonstrates that using a constant flow profile we may slightly overestimate the decrease of lung dose due to late actuation if the delay time is relatively small (below 1.5 s) and significantly underestimate it for larger delay time values. To understand the causes of the differences between the results corresponding to steady and time dependent cases it should be emphasized that if the flow rate is constant, then the decrease of lung dose is caused by the lower particle residence times inside the lungs and because particles entering the airways cannot penetrate into the deeper airways (the lungs are partly full with the air entering before the inhalation of drug particles). On the other hand, when time dependent flow rate is considered two competing effects due to late actuation can be captured. At late actuation the inhalation flow rate is decreased which causes lower upper airway deposition fraction and concomitantly higher lung deposition. At the same time, due to late inhalation the drug cannot penetrate deeply in the lungs (which are already almost full) and also particles have less time to deposit by settling before exhalation. Therefore, this second effect causes
0 1 2 3 4 5
0 20 40 60 80 100 120 140 160 180 200
model flow profile of type A
constant flow realistic flow profile (type B) realistic flow profile (type A)
Flow rate (L/min)
Time (s)
0 1 2 3 4 5
0.0 0.2 0.4 0.6 0.8 1.0
Relative lung deposition (%)
Time (s) unsteady
steady
lower lung deposition. Based on our computations the first effect is more powerful mainly in the first part of the inhalation time period, while the second predominates toward the end of inhalation.
Therefore, the unsteady lung dose decay is lower at the beginning, then drastically enhances. More importantly, based on the results in Figure 8 the main conclusion of figures 6 and 7, that is, the decrease of lung dose is not very significant until the middle of the inhalation time remains valid also when considering unsteady flow profiles.
Last but not least, it is worth noting that besides late actuation, early actuation is also a serious problem, although it is less frequent than late actuation (Azouz et al, 2013). The reason this study focused only on late actuation is technical. The stochastic whole airway deposition model is based on analytical deposition formulas which are functions of air velocity, thus currently it cannot simulate the deposition without airflow. Its development in this direction will be the subject of a future work.
Conclusions
Present work has demonstrated that numerical models can be powerful tools in the quantification of airway deposition distribution of the inhaled aerosol drugs. Current results obtained by combining CFPD techniques and analytical models suggest that, at least in the case of pMDIs emitting high fraction of extrafine particles with moderate velocity, late actuation (up to the middle of the inhalation) does not cause a drastic reduction of lung dose, which was earlier observed for CFC devices and larger particles. Lung deposition of Foster® remained reasonably high even assuming poor coordination, unless the actuation of the device happened at the second half of the inhalation.
The decrease of lung deposition fraction due to late device actuation was fairly low at all the inhaled volumes, inhalation times and breath-hold times considered in this study, assuming that actuation is in the first half of the inhalation period. It is well known that many patients are unable to achieve a good synchronization. In such cases, it may be plausible to advice the patients to trigger the device as soon as possible after the beginning of the inhalation, rather than forcing them to perform two simultaneous activities with the risk of mishandling and poor drug deposition. Although it was not
Formatted: Font color: Accent 5
the aim of this work to analyse the exact effect of premature device triggering, it is known that late actuation causes less deposition loss then premature activation (Leach et al, 2005). By advising the patients to actuate the device shortly after the beginning of the inhalation the chances of premature actuation will also be reduced. Present work is the first step of a more extended study of the effect of delayed pMDI actuation. Study of the effect of late actuation for drugs emitting larger particles with higher flow rate dependency of drug deposition is needed in the future.
Author disclosure statement
None of the authors have shares in any pharmaceutical company. ÁF has received honoraria for presentation from Chiesi Hungary Ltd. AH and TG are full time employees of Chiesi Hungary Ltd.
AN, AK, Sz K and LT have no conflict of interest regarding this material.
Acknowledgement
The work of ÁF and LT was supported by the Bolyai János Scholarship of the Hungarian Academy of Sciences.
References
Abramovich G. Applied gasdynamics. 4th revised edition, Izdatel’stvo Nauka, Moscow, 1976.
Al-Showair RAM, Tarsin WY, Assi KH, Pearson SB, Chrystyn H. Can all patients with COPD use the correct inhalation flow with all inhalers and does training help? Respiratory Medicine 101: 2395- 2401, 2007.
Ammari WG, Chrystyn H. Optimizing the inhalation flow and technique through metered dose inhalers of asthmatic adults and children attending a community pharmacy. Journal of Asthma 50:
505-513, 2013.
Azouz W, Campbell J, Stephenson J, Saralaya D, Chrystyn H. Improved metered dose inhaler technique when a coordination cap is used. Journal of Aerosol Medicine and Pulmonary Drug Delivery 27: 193-199, 2014.
Biswas R, Hanania NA, Sabharwal A. Factors determining in vitro lung deposition of Albuterol aerosol delivered by Ventolin metered dose inhaler. Journal of Aerosol Medicine and Pulmonary Drug Delivery 30: 256-266, 2017.
Cheng YS, Zhou Y, Chen BT. Particle deposition in a cast of human oral airways. Aerosol Science and Technology 31: 286–300, 1999.
Cheng YS, Fu CS, Yazzie D, Zhou Y. Respiratory deposition patterns of Salbutamol pMDI with CFC and HFA-134a formulations in a human airway replica. Journal of Aerosol Medicine 14: 255- 266, 2001.
Cheng YS. Aerosol deposition in the extrathoracic region. Aerosol Science and Technology 104:
145-149, 2003.
Crompton GK. Problems patients have using pressurized aerosol inhalers. European Journal of Respiratory Diseases 63: 101-104, 1982.
De Backer W, Devolder A, Poli G, Acerbi D, Monno R, Herpich C, Sommerer K, Meyer T, Mariotti F. Lung deposition of BDP/Formoterol HFA pMDI in healthy volunteers, asthmatic and COPD patients. Journal of Aerosol Medicine and Pulmonary Drug Delivery 53: 137-148, 2010.
Farkas Á, Balásházy I, Szőcs K. Characterization of regional and local deposition of inhaled aerosol drugs in the respiratory system by computational fluid and particle dynamics methods. Journal of Aerosol Medicine 19: 329-343, 2006.
Farkas Á, Jókay Á, Balásházy I, Füri P, Müller V, Tomisa G, Horváth A. Numerical simulation of emitted particle characteristics and airway deposition distribution of Symbicort® Turbuhaler® dry powder fixed combination aerosol drug. European Journal of Pharmaceutical Sciences 93: 371-379, 2016.
Farkas Á, Lewis D, Church T, Tweedie A, Mason F, Haddrell AE, Reid JP, Horváth A, Balásházy I.
Experimental and computational study of the effect of breath-actuated mechanism built in the NEXThaler® dry powder inhaler. International Journal of Pharmaceutics 533: 225-235, 2017.
Farr JS, Rowe AM, Rubsamen R, Taylor G. Aerosol deposition in the human lung following administration from a microprocessor controlled pressurized metered dose inhaler. Thorax 50: 639- 644, 1995.
Gabrio BJ, Stein SW, Velasquez DJ. A new method to evaluate plume characteristics of hydrofluoroalkane and chlorofluorocarbon metered dose inhalers. International Journal of Pharmaceutics 186: 3-12, 1999.