Therapeutic Drug Monitoring Guides the Management of Crohn’s Patients with Secondary Loss of Response to Adalimumab
Sophie Restellini, MD,
1,*
,†Che-yung Chao, MBChB, FRACP,
1,*
,‡Peter L. Lakatos, MD, PhD, FEBG, AGAF,*
,§Achuthan Aruljothy, MD,
¶Haya Aziz, MD,
¶Omar Kherad, MD, MPH, PD,
‖Alain Bitton, MDCM, FRACP,* Gary Wild, MD, PhD,*
Waqqas Afif, MDCM, MSc, FRCPC,* Talat Bessissow, MDCM, MSc, FRCPC*
Background: Managing loss of response (LOR) in Crohn’s disase (CD) patients remains challenging. Compelling evidence supports therapeutic drug monitoring (TDM) to guide management in patients on infliximab, but data for other biologics are less robust. We aimed to asses if empiric dose escalation led to improved clinical outcome in addition to TDM-guided optimization in CD patients with LOR to adalimumab (ADA).
Methods: Retrospective chart review of patients followed between 2014 and 2016 at McGill IBD Center with index TDM for LOR to ADA was performed. Primary outcomes were composite remission at 3, 6, and 12 months in those with empiric adjustments versus TDM-guided optimization.
Results: There were 104 patients (54.8% men) who were included in the study. Of this group, 81 patients (77.9%) had serum level (SL) ≥5µg/
ml at index TDM with a median value of 12µg/ml (IQR 6.1–16.5). There were 10 patients (9.6%) who had undetectable SL with high anti-ADA antibodies and 48 (46.2%) received empiric escalation. TDM led to change in treatment in 58 patients (55.8%). Among them, 28 (48.3%) had discontinued ADA, 12 (21.7%) had addition of immunomodulator or steroid, and 18 (31%) had ADA dose escalation. Empiric dose escalation before TDM-based optimization was not associated with improved outcomes at 3, 6, and 12 months, irrespective of SL levels. Clear SL cutoff associated with composite remission was not identified.
Conclusions: Our data do not support empiric dose adjustment beyond that based on the result of the TDM in patients with LOR to ADA.
TDM limits unnecessary dose escalation and provides appropriate treatment strategy without compromising clinical outcomes.
Key Words: loss of response, adalimumab, therapeutic drug monitoring
INTRODUCTION
Crohn’s disease (CD) is a chronic relapsing disorder that can lead to debilitating symptoms and morbid complications.
No curative therapies are available and the current manage- ment focuses on achieving disease remission with modulation of various inflammatory pathways.1, 2 Treatments utilizing monoclonal antibodies against TNF alpha (anti-TNFα) have been the most advanced therapeutic option available for CD in the last decade and became standard of care for the treat- ment of patients with moderate-to-severe CD. Landmark trials confirmed their efficacy both in induction and mainte- nance of the remission. Adalimumab (ADA), a completely human immunoglobulin G1 anti-TNFα monoclonal antibody, was approved in 2007 by the United States Food and Drug Administration to induce and maintain clinical remission in patients with moderate to severe active CD.3 Managing loss of response (LOR), however, remains a complex and frequent challenge in CD patients.
Advances in therapeutic drug monitoring (TDM) have led to significant improvements in the understanding of the relationship between anti-TNF-α drug concentrations, devel- opment of antibodies, and disease activity. Emerging data
Received for publications August 21, 2017; Editorial Decision November 7, 2017.
*Division of Gastroenterology, McGill University Health Centre, Montreal, Canada; †Division of Gastroenterology and Hepatology, Geneva’s University Hospitals and University of Geneva, Geneva, Switzerland; ‡Department of Gastroenterology and Hepatology, Princess Alexandra Hospital, Brisbane, Australia;
§1st Department of Medicine, Semmelweis University, Budapest, Hungary; ¶Division of Internal Medicine, McGill University Health Centre, Montreal, Canada; ‖Internal Medicine Department, La Tour Hospital and University of Geneva, Switzerland
© 2018 Crohn’s & Colitis Foundation. Published by Oxford University Press.
All rights reserved. For permissions, please e-mail: journals.permissions@oup.com.
Conflicts of Interest: The authors have no conflicts of interest to report.
1Both authors contributed equally to this work.
Supported by: This work was funded by an advanced training grant from Geneva University Hospital (Sophie Restellini)
Correspondence address: Division of Gastroenterology, Montreal General Hospital, McGill University Health Center, 1650 Avenue Cedar C7-200, Montreal, Quebec (Canada) H3G 1A4.
Email: talat.bessissow@mcgill.ca
Abbreviations. CD, Crohn’s disease; Anti-TNFα, against TNF alpha; ADA, Adalimumab; LOR, loss of response; CRP, C-reactive protein; FCP, fecal calprotec- tin; TDM, therapeutic drug monitoring; MUHC, McGill University Health Centre;
HBI, Harvey-Bradshaw index; AAA, anti-adalimumab antibodies; SL, serum level;
SES-CD, simple endoscopy score for CD; ORs, odds ratios; CIs, confidence intervals.
doi: 10.1093/ibd/izy044 Published online 13 April 2018
Downloaded from https://academic.oup.com/ibdjournal/article-abstract/24/7/1531/4969821 by Semmelweis University user on 14 July 2019
support the use of TDM to guide management decisions in cer- tain scenarios in patients treated with infliximab (IFX), such as dose intensification, addition of immunomodulator, or switch- ing out of class.4 Less data exists for ADA to support regular TDM. The current literature is still conflictive.5–9 A threshold of 4.9–5.9 µg/mL has been suggested for clinical remission and
>7–10 µg/mL for mucosal healing.10, 11 Our retrospective study aimed to examine the clinical utility of TDM-guided ADA optimization for CD patients with LOR to ADA in a “real-life”
setting at the McGill University Health Center (MUHC).
MATERIALS AND METHODS Study Population and Design
We performed a retrospective cohort study including patients followed between June 2014 and November 2016 at the tertiary MUHC in Montreal, Canada. Eligible patients were identified through their index TDM test through the MUHC IBD Center and retrospective chart reviews were performed by the designated members of the research team (Sophie Restellini, Che-yung Chao ).
We included adult patients with established diagnosis of CD based on standard objective methodology (clinical, bio- chemical, endoscopic, histological, and radiological criteria) and routine treatment with ADA at any time between January 2014 and December 2016 (not including clinical trials). Patients with a minimum of one ADA TDM testing in the context of second- ary LOR were included if they had a minimum of 3 months fol- low-up available following TDM testing. Secondary LOR was defined as those patients with Harvey-Bradshaw index (HBI)
> 5 and/or biochemical evidence for active disease [C-reactive protein (CRP/fecal calprotectin (FCP)] and/or endoscopic find- ings confirming active disease in patients who were in remission before; consistent current clinical practice. All patients who received a diagnosis of indeterminate colitis or ulcerative colitis and pediatric patients were excluded. The impact of perform- ing TDM in those patients with secondary LOR was assessed.
The remission rates and associated ADA level in patients who had dose escalation on a clinical basis, before the ADA level was available, were compared to those who had dose escalation based on the ADA level results.
For all eligible patients, the following demographic and clinical variables were collected if available and analyzed:
age, sex, date of diagnosis and duration of disease, extension and severity of disease defined by the Montreal classification, extraintestinal manifestations, prior surgery, prior treatment and reason for stopping, previous or current concomitant med- ical therapy, dose of ADA and intervals of administration, duration of treatment, number of repeated TDM and date of collection, rationale for testing TDM, objective evidence of active disease, empiric change before TDM results such as dose escalation, deescalation, discontinuation, empiric addition of another drugs, ADA serum value, presence of anti-adalimumab antibodies (AAA), and posttest result change such as escal- ation, deescalation, addition of another drug, or discontinu- ation. Both the index TDM and subsequent repeat TDM results (if available) were collected. Rates of complications, including hospitalization, surgery, adverse reaction, clostridium difficile infection, and corticosteroid use also were documented.
Additionally, serological variables including hemoglo- bin concentration, white blood count, platelets level, albumin, CRP and FCP were also collected when available. Drug levels were measured on serum samples using a commercially avail- able ELISA kit (Promonitor-ADL, Progenika Biopharma SA, Spain). Results were expressed as µg/mL. The reference cut points in our laboratory were as: < 5 ug/mL: subtherapeutic levels, between 5–20 ug/mL: therapeutic levels and > 20 ug/mL:
supratherapeutic levels. Free ADA antibodies were measured in parallel to drug levels using the ELISA kit. AAA were detectable when their level was ≥10 AU//mL or undetectable if <10 AU/mL.
As the drug level seem not to fluctuate over time for ADA, we have used the term serum level (SL) instead of trough level.
Clinical outcome was assessed by HBI, CRP, FCP, and endoscopic assessment by simple endoscopy score for CD (SES-CD) if available at 3, 6, and 12 months following index TDM. Composite remission was defined as HBI<5, with CRP<5mg/L, FCP <250µg/g, and SES-CD score <3.
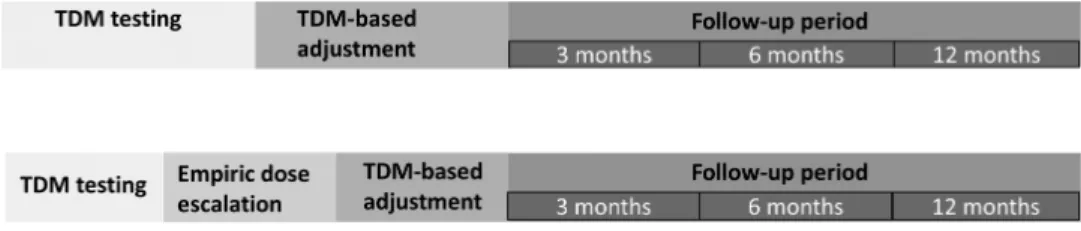
Our primary objective was to assess whether empiric dose escalation improves clinical outcome compared to TDM -guided optimization in CD patients with secondary LOR to ADA. Our secondary objective was to identify factors predic- tive of composite remission for TDM-guided therapeutic opti- mization and optimal ADA SL cutoffs. (Fig. 1)
FIGURE 1. Groups of comparison: empiric dose escalation versus TDM-based adjustment.
Downloaded from https://academic.oup.com/ibdjournal/article-abstract/24/7/1531/4969821 by Semmelweis University user on 14 July 2019
Statistical Analysis
Anonymized data were collected and stored in Excel in a password protected document. Statistical analyses were per- formed using Statistical Package for the Social Sciences (SPSS 20.0; SPSS INC., Chicago, Illinois). All continuous data were expressed as median ± inter-quartile range (IQR). Continuous variables were analyzed by a 2-tailed t test and the Mann–
Whitney U test. Logistic regression modeling was used to calcu- late the odds ratios (ORs) and 95% confidence intervals (CIs).
All P values were 2-tailed, and P values < 0.05 were considered statistically significant.
Ethical Considerations
The study was approved by the MUHC institutional review board and ethics committee (REB: 2017–2936).
RESULTS Patient Characteristics
A total of 104 patients (54.8% men) ranging in age from 18 years to 83 years (median 32, IQR 24–52) were included. Most patients (N = 70, 67.3%) were diagnosed between the age of 17 to 40. The median duration of disease was 54 months (IQR 44–195) and 49 patients (47.1%) had a previous IBD-related surgery. There were 37 patients (35.6%) who were previously exposed to IFX and 28 (26.9%) were on combotherapy with azathioprine/6-mercapto- purine at the time of TDM measurement. The patient demograph- ics at baseline for the entire cohort are summarized in Table 1.
Additional information for those included in the primary end point analysis at 3 months are presented in supplementary Table 1.
TDM Results
The majority of patients (N = 80, 76.9%) had serum lev- els (SL) ≥5µg/ml at the index TDM. Median ADA SL was 12µg/
ml with IQR 6.1–16.5. Among them, 9.6% (N = 10) had unde- tectable drug level with positive AAA (all of whom had high antibody levels of ≥10AU/ml).
TDM-guided Therapeutic Adjustments
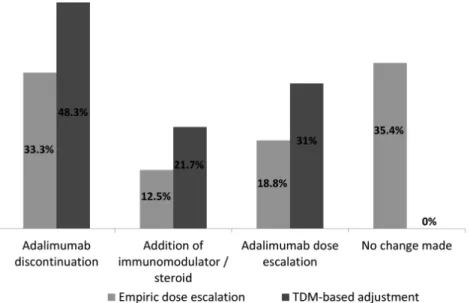
TDM result led to immediate change in treatment in 55.8% of all patients out of which, 48.3% had discontinued ADA, 21.7% had an addition of an immunomodulator or ster- oids, and 31% had ADA dose escalation (Fig. 2). The majority (76.5%) of the TDM-guided changes occurred within 1 month (Mean 1.7 SD 0.9) of the index testing. Fifty percent of those discontinued ADA changed to another anti-TNF agent and 50% changed to ustekinumab.
Clinical Outcomes for Empiric Versus TDM- guided Adjustments
In those with LOR to ADA, empiric dose escalation was not associated with improved composite remission at 3 months
42.31%, P = 0.619). Multivariate logistic regression analysis was used to adjust for baseline characteristic differences between 2 groups. Similarly, the 6- and 12-months composite remission did not differ significantly (30.77% vs 45.5%, P = 0.328, 27.3%
vs 39.39%, P = 0.978, respectively) (Fig. 3). Only 18 (17.3%) of patients had endoscopic assessment data available, and there was no difference between the 2 groups in terms of endo- scopic remission rates (33.3% vs 33.3%). There was no signifi- cant difference in median SL between those who had empiric dose escalation before TDM results versus others (P = 0.194).
Similar outcome was also observed for the end points of mucosal healing, IBD-related surgery, and hospitalization rates. In those with index SL ≥ 5 ug/mL empiric dose escalation was associated with lower composite remission at 3 months compared to those with TDM-guided adjustment (12.5% vs 47.1%, P = 0.034). No difference was found at 6 and 12 months between these two cohorts (29.4% vs 54.2%, P = 0.120, 37.5%
vs 39.1%, P = 0.919). Finally, for patients on standard ADA dosing of 40mg every other week, there was still no differences between the empiric escalation and the TDM group at 3 (28.6%
vs 47.1%, P = 0.413), 6 (60% vs 55%, P = 0.844), and 12 (33.3%
vs 47.4%, P = 0.656) months.
Empiric Dose Escalation
ADA dose was empirically escalated before TDM results became available in 48 patients (46.2%). These patients were more likely to have ileal disease (P < 0.001), stricturing pheno- type (P = 0.005), concurrent steroid use (P = 0.001), longer ADA treatment duration (P < 0.001), higher HBI (P = 0.015), higher FCP (P = 0.003), lower albumin (P = 0.041), and less likely to be on standard ADA dose (P = 0.001). Sixteen of these patients dis- continued ADA following TDM results and the majority of them (87.5%) due to adequate SL. In addition, 58 patients (55.8%) had no empiric changes and 37.5% of these patients were already on a higher than standard dosing regimen of 40mg every 2 weeks.
Clinical Outcomes of Serum Levels ≥5 versus
<5µg/ml
Composite remission rate at 3 and 6 months were not dif- ferent in patients with therapeutic SL (≥5µg/ml) compared to patients with SL (<5µg/ml) (31.3% vs 29.4%, P = 0.900, 33.3%
vs 57.1%, P = 0.510, respectively). Furthermore, receiver oper- ating curve analysis failed to identify a particular SL cutoff that statistically differentiated between those achieving composite remission at 3 and 6 months, with others not in remission (area under curve: 0.43).
Predictors of Composite Remission in Patients with LOR to ADA following TDM-guided Therapeutic Optimization
A 3-months composite remission was more likely to occur in patients with shorter disease duration (P = 0.038),
Downloaded from https://academic.oup.com/ibdjournal/article-abstract/24/7/1531/4969821 by Semmelweis University user on 14 July 2019
platelets (P = 0.035), and higher albumin (P = 0.001) (Table 2).
Additionally, those achieving composite remission at 3 months had higher baseline FCP .
A 12-months composite remission was more likely to occur in patients naive to IFX (P = 0.025), older age at diagno- sis (P < 0.05), higher baseline hemoglobin (P = 0.001), higher TABLE 1: Patient Baseline Characteristics
Empiric TDM Pvalue
No. overall (104) 48 56
Males, no. (%) 26 (54.2% %) 32 (7.1% %) 0.768
Age at TDM, median (range) 36 (18–75) 30 (17.83) 0.075
Extraintestinal manifestations (n, %) 23 (47.9%) 12 (21.4%) 0.004
IBD-related surgery (no., %) 21 (45.7%) 26 (46.4%) 0.943
Disease duration (months, IQR) 120 (59–228) 78 (36–171) 0.095
Age at diagnosis
A1 (<16) 14 (29.2%) 16 (28.6%) 0.947
A2 (17–40) 33 (68.8%) 37 (66.1%) 0.771
A3 (>40) 1 (2.1 %) 3 (5.4 %) 0.387
Disease location: CD
L1-terminal ileum 14 (29.2%) 12 (21.4%) 0.362
L2-colon 33 (68.8%) 16 (28.6%) <0.0001
L3-ileocolonic 1 (2.1%) 27 (48.2%) <0.0001
L4: upper GI tract 0 1 (1.8%) 0.353
Disease behavior: CD
B1- Inflammatory 18 (37.5%) 33 (68.8%) 0.102
B2-Stricturing 26 (54.2%) 30 (53.6%) 0.0003
B3-Penetrating 4 (8.3%) 11 (19.6%) 0.0154
Perianal disease, n (%) 15 (31.3%) 15 (26.8%) 0.615
HBI at TDM 6 (4–8) 5 (1–7) 0.015
Endoscopic activity (SES-CD score, median, IQR) 9 (5–12) 5 (3–8) 0.095
Biochemical assessment (median, IQR)
Hemoglobin (g/l) 130 (120–142) 130 (133–142) 0.229
White blood cell (g/l) 6.8 (5.6—8.5) 7.6 (6.1–9.7) 0.308
Platelet (g/l) 278 (225–337) 266 (194–360) 0.619
Albumin (g/l) 39 (36–42) 41 (38–43) 0.040
CRP (mg/l) 7.7 (2.1–21.9) 3.2 (1–7.8) 0.112
FCP (ug/g) 266 (121–687) 509 (126--1801) 0.003
Treatment
Prior IFX treatment 21 (43.8%) 16 (26.8 %) 0.071
Oral corticosteroids 13 (27.1%) 2 (3.6%) 0.0007
Immunomodulators:
Azathioprine/mercaptopurine 16 (33.30%) 12 (21.4%) 0.175
Methotrexate 2 (4.2%) 2 (3.6%) 0.875
Duration of ADA in months (median, IQR) 22 (6–36) 10 (4–24) <0.0001
Dosage:
40 mg EOW 12 (25%) 35 (62.5%) 0.0001
40 mg Weekly 32 (66.7%) 20 (35.7%) 0.0017
80 mg EOW 1 (2.1%) 0 0.278
80 mg Weekly 3 (6.3%) 1 (1.8%) 0.238
No., Number; TDM, therapeutic drug monitoring; IBD, Inflammatory bowel disease; IQR, Interquartile range; GI, gastrointestinal; HBI, Harvey Bradshaw Index; SES-CD:
Simple Endoscopic Score for Crohn’s disease; EOW, every other week
Downloaded from https://academic.oup.com/ibdjournal/article-abstract/24/7/1531/4969821 by Semmelweis University user on 14 July 2019
baseline albumin (P = 0.001), lower baseline CRP (P = 0.035), and lower baseline FCP (P = 0.043) (Table 3).
None of the outcomes was associated with past IFX exposure, ADA serum level and antibody level.
Patients with Positive Antibodies Against ADA
Out of the 10 patients with high AAA, 1 was on combin- ation therapy with an immunomodulator. All of them discon- tinued ADA in light of the TDM results. Four of these patients were IFX naive patients and were switched to IFX. The oth- ers were IFX experienced patients and they were switched to ustekinumab (N = 5) and golimumab (N = 1).
DISCUSSION
LOR to ADA remains a major problem for the man- agement of CD with an estimated incidence rate of 30%. In primary anti-TNF responders, around 36% will require ADA dose intensification.12 Previous studies have attempted to dem- onstrate the clinical utility of an algorithmic approach to ther- apeutic optimization based on TDM results.13, 14 Conversely, others have also shown that empiric ADA dose escalation is effective in recapturing disease control after secondary LOR.15 Currently there is no randomized controlled study examining whether empiric dose adjustments lead to improved outcomes as compared to those with TDM-guided changes for ADA.
FIGURE 2. TDM- guided treatment changes postindex test results between empiric dose escalation versus TDM-based adjustment group.
FIGURE 3. Composite remission in patients with empiric escalation versus TDM-based adjustment.
Downloaded from https://academic.oup.com/ibdjournal/article-abstract/24/7/1531/4969821 by Semmelweis University user on 14 July 2019
This present study is the largest retrospective study to date which compared the clinical utility of empiric versus TDM- based strategy. In patients with secondary LOR to ADA, empiric dose escalation before TDM results were not associated with bet- ter outcomes at 3 months, irrespective of the SL. Multivariable analysis was utilized to adjust for potential confounding differ- ences in baseline disease activity and characteristics. Similarly,
it also did not lead to improved outcomes at 6 and 12 months.
Therefore, treatment optimization should be guided by TDM results. Even though the physicians were not blinded to the TDM results, this actually reflects the real-world clinical practice where clinicians could empirically dose escalate and/or use TDM- guided approach in their management. Furthermore, despite intention of early action with TDM results, there will always be a TABLE 2: Predictors of Composite Remission in Patients with TDM-Based Dose Adjustment at 3 Months
No Composite Remission Composite Remission Pvalue
Males (%) 41.70 40 0.911
Age at TDM, median (range) 39 (17–74) 30 (19–62) 0.046
Extraintestinal manifestations (%) 36.10 20 0.264
IBD-related surgery (%) 53.8 26.7 0.080
Disease duration (median months, IQR) 142 (36–223) 66 (23–90) 0.038
Age at diagnosis (%):
A1 (<16) 22.2 20.0 0.863
A2 (17–40) 72.2 73.3 0.937
A3 (>40) 5.6 6.7 0.881
Disease location (%):
L1-terminal ileum 22.2 26.7 0.733
L2-colon 22.2 40.0 0.199
L3-ileocolonic 52.8 33.3 0.208
L4: upper GI tract 2.8 0 0.517
Disease behavior (%):
B1- Inflammatory 41.7 60.0 0.238
B2-Stricturing 36.1 26.7 0.521
B3-Penetrating 22.2 13.3 0.470
Perianal disease (%) 33.3 26.7 0.567
HBI at TDM (median, IQR) 6(5–8) 4(1–7) 0.076
Biochemical assessment (median, IQR):
Hemoglobin (g/l) 9 (116–132) 7 (127–143) 0.241
White blood cell (g/l) 7.3 (5.7–8.6) 8.7 (6.2–9.8) 0.125
Platelet (g/l) 338 (274–382) 261 (195–350) 0.025
Albumin (g/l) 37 (33–41) 41 (40–43) 0.030
CRP (mg/l) 19.4 (1.5–29.8) 11.8 (2.5–9.2) 0.340
FCP (ug/g) 600 (119–798) 1143 (717–1801) 0.018
Treatment (%):
Prior IFX treatment 41.7 20.0 0.144
Oral corticosteroids 16.7 6.7 0.350
Immunomodulators:
Azathioprine/mercaptopurine 19.4 26.7 0.567
Methotrexate 2.8 0 0.517
Duration of ADA in months (median, IQR) 22 (5–33) 10 (4–19) 0.063
Dosage (%):
40 mg EOW 38.9 66.7 0.073
40 mg Weekly 50 33.3 0.280
80 mg EOW 0 0 -
80 mg Weekly 11,1 0 0.183
TDM, therapeutic drug monitoring; IBD, inflammatory bowel disease; IQR, Interquartile range; GI, gastrointestinal; HBI, Harvey Bradshaw index; EOW, every other week
Downloaded from https://academic.oup.com/ibdjournal/article-abstract/24/7/1531/4969821 by Semmelweis University user on 14 July 2019
delay due to results turnover time and the logistics involved with therapeutic changes. This study confirmed that early empiric changes did not lead to meaningful clinical improvements.
Moreover, the systematic review by Martelli and colleagues has demonstrated that TDM treatment strategy leads to major cost savings in IBD and rheumatoid arthritis without negative
impact on efficacy. Indeed, more than half of the patients in this LOR to ADA cohort had treatment adjustments based on TDM without inferior clinical outcomes subsequently. Finally, the development of point of care anti-TNF SL and AAA testing may further improve cost effectiveness of this strategy by short- ening the time delay with the standard results turnover interval.16 TABLE 3: Predictors of Composite Remission in Patients with TDM-Based Dose Adjustment at 12 Months
No Composite Remission Composite Remission Pvalue
Males (%) 58.3 36.8 0.133
Age at TDM, median (range) 38 (17–75) 33 (18–62) 0.231
Extraintestinal manifestations (%) 33.3 36.8 0.797
IBD-related surgery (%) 55.6 47.4 0.566
Disease duration (months, IQR) 156 (46–208) 102 (30–114) 0.192
Age at diagnosis (%):
A1 (<16) 19.4 31.6 0.315
A2 (17–40) 84.6 57.9 0.030
A3 (>40) 0 10.5 0.049
Disease location (%):
L1-terminal ileum 19.4 26.3 0.559
L2-colon 16.7 26.3 0.402
L3-ileocolonic 63.9 47.4 0.242
L4: upper GI tract 0 0 -
Disease behavior (%):
B1- Inflammatory 38.9 47.4 0.547
B2-Stricturing 38.9 31.6 0.596
B3-Penetrating 22.2 21.1 0.926
Perianal disease (%) 30.6 26.3 0.741
HBI at TDM (median, IQR) 6 (4–7) 4 (0–6) 0.052
Biochemical assessment (median, IQR):
Hemoglobin (g/l) 123 (114–136) 136 (132–140) 0.009
White blood cell (g/l) 7.9 (5.1–11) 7.5 (5.8–9.6) 0.848
Platelet (g/l) 326 (259–379) 278 (198–360) 0.122
Albumin (g/l) 37 (33–41) 42 (40–43) 0.001
CRP (mg/l) 19.4 (3.2–23.5) 7 (0.6–3.6) 0.035
FCP (ug/g) 946 (316–1656) 523 (104–749) 0.043
Index ADA SL 12.4 (3.5–14.9) 10.6 (6.4–13.5) 0.533
Treatment (%):
Prior IFX treatment 52.8 21.1 0.025
Oral corticosteroids 13.9 5.3 0.336
Immunomodulators: 30.6 42.1 0.398
Azathioprine/mercaptopurine 2.8 5.3 0.642
Methotrexate
Duration of ADA in months (median, IQR) 21 (4–32) 16 (6–24) 0.374
Dosage (%):
40 mg EOW 33.3 52.6 0.169
40 mg Weekly 55.6 47.4 0.556
80 mg EOW 0 0 -
80 mg Weekly 11,1 0 0.135
TDM, therapeutic drug monitoring; IBD, inflammatory bowel disease; IQR, Interquartile range; GI, gastrointestinal; HBI, Harvey Bradshaw index; SL, serum level; EOW, every other week
Downloaded from https://academic.oup.com/ibdjournal/article-abstract/24/7/1531/4969821 by Semmelweis University user on 14 July 2019
Serum ADA level was not associated with treatment out- come in this cohort. Some patients in this cohort (37.5%) were already on a higher ADA dose and 76.9% had serum ≥5 µg/
ml at index TDM that may have limited the power to detect differences and could limit the generalizability of the study results to all ADA patients with LOR since an attempt to opti- mize the dosage of ADA had already been made. However, in the sub-analysis for those on standard ADA 40mg every other week, there were still no differences in clinical outcomes between the empiric escalation and TDM group. This adds to the current debate on the optimal cutoff of SL and AAA levels in relation to clinical outcomes. In a trial of 130 patients receiv- ing maintenance therapy with ADA who had available serum samples, no relationship was reported between outcomes at 4 weeks and SL of ADA. SL were significantly lower in those who discontinued ADA use (P = 0.012).17 Another study examined the impact of SL in a subgroup of 48 patients receiving ADA, of whom 24 were in both clinical and endoscopic remission.
Twenty-one of 24 patients meeting these criteria had through levels >2 μg/ml. However, in this study, 17 of 24 who did not reach deep remission also had ADA levels above this cutoff.
Conversely, a recent meta-analysis revealed that patients with ADA SL over >5.9 µg/mL were more likely to achieve remission (OR = 2.6 (95% CI: 1.79–3.77, P < 0.0001)).18 Higher ADA SL were also likely to be associated with sustained clinical response (P = 0.01).17 Similarly, SL of ADA were also higher in patients who achieved mucosal healing (6.5 μg/mL) than in patients without (4.2 μg/mL; P < 0.005).
Several predictors of clinical response following TDM- guided optimization were identified. These were predominantly factors associated with lower index clinical disease activity or biochemical markers such as index hemoglobin, albumin, CRP, and platelets indirectly reflecting lower inflammatory burden and, therefore, higher likelihood of responding to therapy adjustments. Potential mechanisms underlying this intuitive observation may be related to higher anti-TNF drug clearance through the reticuloendothelial system and gut loss in the set- ting of higher inflammatory activity and the need of higher drug levels to overcome the degree of inflammation.19
The main limitations to this study are inherent to the retrospective nature of the study design that included selec- tion bias, potential missing data, and inability to control for potential confounding factors. For example, it was difficult to adjust for medication compliance, access to recommended dose optimization due to financial or logistic issues, time delay differences in treatment adjustment following TDM, and mul- tiple adjustments and their correlation with subsequent TDM results. Furthermore, only 17% of the cohort had mucosal healing assessment within 12 months and less than 3% had IBDrelated surgery and hospitalization, thus, this may have limited the power to detect significant differences in these objective endpoints. It is the standard practice in this institu- tion that patients with secondary LOR will be assessed with
TDM irrespective of empiric dosing changes thus limiting the potential selection bias of including only patients with TDM results.
CONCLUSIONS
In summary, in CD patients with secondary LOR to ADA, empiric dose escalation before TDM-guided optimization did not lead to improved clinical outcome and therefore is unnecessary.
SUPPLEMENTARY DATA
Supplementary data are available at Inflammatory Bowel Diseases online.
REFERENCES
1. Dignass A, Van Assche G, Lindsay JO, et al.; European Crohn’s and Colitis Organisation (ECCO). The second European evidence-based Consensus on the diagnosis and management of Crohn’s disease: current management. J Crohns Colitis. 2010;4:28–62.
2. Dignass A, Lindsay JO, Sturm A, et al. Second European evidence-based consen- sus on the diagnosis and management of ulcerative colitis part 2: current manage- ment. J Crohns Colitis. 2012;6:991–1030.
3. Hanauer SB, Sandborn WJ, Rutgeerts P, et al. Human anti-tumor necrosis fac- tor monoclonal antibody (adalimumab) in Crohn’s disease: the CLASSIC-I trial.
Gastroenterology. 2006;130:323–33; quiz 591.
4. Strik AS, Bots SJ, D’Haens G, et al. Optimization of anti-TNF therapy in patients with inflammatory bowel disease. Expert Rev Clin Pharmacol. 2016;9:429–39.
5. Roblin X, Marotte H, Rinaudo M, et al. Association between pharmacokinetics of adalimumab and mucosal healing in patients with inflammatory bowel dis- eases. Clin Gastroenterol Hepatol. 2014;12:80–84.e2.
6. Imaeda H, Takahashi K, Fujimoto T, et al. Clinical utility of newly developed immunoassays for serum concentrations of adalimumab and anti-adalimumab antibodies in patients with Crohn’s disease. J Gastroenterol. 2014;49:100–9.
7. Mazor Y, Almog R, Kopylov U, et al. Adalimumab drug and antibody levels as predictors of clinical and laboratory response in patients with Crohn’s disease.
Aliment Pharmacol Ther. 2014;40:620–8.
8. Chiu YL, Rubin DT, Vermeire S, et al. Serum adalimumab concentration and clinical remission in patients with Crohn’s disease. Inflamm Bowel Dis.
2013;19:1112–22.
9. Ward MG, Warner B, Unsworth N, et al. Infliximab and adalimumab drug levels in Crohn’s disease: contrasting associations with disease activity and influencing factors. Aliment Pharmacol Ther. 2017;46:150–61.
10. Ungar B, Levy I, Yavne Y, et al. Optimizing anti-TNF-α therapy: serum levels of infliximab and adalimumab are associated with mucosal healing in patients with inflammatory bowel diseases. Clin Gastroenterol Hepatol. 2016;14:550–7.e2.
11. Zittan E, Kabakchiev B, Milgrom R, et al. Higher adalimumab drug levels are associated with mucosal healing in patients with Crohn’s disease. J Crohns Colitis.
2016;10:510–5.
12. Qiu Y, Chen BL, Mao R, et al. Systematic review with meta-analysis: loss of response and requirement of anti-TNFα dose intensification in Crohn’s disease. J Gastroenterol. 2017;52:535–54.
13. Yanai H, Lichtenstein L, Assa A, et al. Levels of drug and antidrug antibodies are associated with outcome of interventions after loss of response to infliximab or adalimumab. Clin Gastroenterol Hepatol. 2015;13:522–30.e2.
14. Baert F, Glorieus E, Reenaers C, et al.; BIRD (Belgian IBD Research and Development). Adalimumab dose escalation and dose de-escalation success rate and predictors in a large national cohort of Crohn’s patients. J Crohns Colitis.
2013;7:154–60.
15. Ma C, Huang V, Fedorak DK, et al. Adalimumab dose escalation is effective for managing secondary loss of response in Crohn’s disease. Aliment Pharmacol Ther. 2014;40:1044–55.
16. Bantleon FI, Kräuchi S, Schuster TB, et al. P283 Quantum blue® adalimumab:
development of the first point of care rapid test for therapeutic drug monitoring of serum adalimumab levels. J Crohns Colitis. 2017;11:S222-S.
17. Karmiris K, Paintaud G, Noman M, et al. Influence of trough serum levels and immunogenicity on long-term outcome of adalimumab therapy in Crohn’s dis- ease. Gastroenterology. 2009;137:1628–40.
18. Paul S, Moreau AC, Del Tedesco E, et al. Pharmacokinetics of adalimumab in inflammatory bowel diseases: a systematic review and meta-analysis. Inflamm Bowel Dis. 2014;20:1288–95.
19. Ordás I, Feagan BG, Sandborn WJ. Therapeutic drug monitoring of tumor necrosis factor antagonists in inflammatory bowel disease. Clin Gastroenterol Hepatol. 2012;10:1079–87; quiz e85.
Downloaded from https://academic.oup.com/ibdjournal/article-abstract/24/7/1531/4969821 by Semmelweis University user on 14 July 2019