REL LATION M
NSHIP MOISTU
B
Cor Depa
OF DIE URE CO
Th
Bíborka
Su Dr. D Prof.
rvinus Un Faculty artment o
Bud
ELECT ONTEN hesis Bo
by Zsuzsan
upervisor David B.
József Fe
niversity y of Food of Physic
dapest, 2
TRIC PR NT OF G ook
na Gillay
rs:
Funk elföldi
of Buda Science cs and Co
2013
ROPER GRAIN
y
apest ontrol
RTIES A NS
AND
1
INTRODUCTION
Moisture content is one of the most important grain quality factors, and, despite the 100-year history of grain moisture meters, there are still several unanswered questions that impede the development of accurate moisture meters. Moisture meters do not directly sense moisture content but rather a moisture-dependent physical property. Their accuracy is dependent on numerous factors.
Measurement systems affected minimally by these disturbing factors are not used widely in industry due to their complexity and high cost. Capacitive-type instruments are fairly accurate and the applied measurement technologies are simpler than for moisture meters operating at higher frequencies. For the financial endeavor of manufacturers designing low cost meters, there is interest in properties of grain below 100 MHz. For this reason the goal of my research was to investigate the effects of disturbing factors to dielectric spectra such as would occur in online measurements in grain driers and on combine harvesters.
OBJECTIVES
My research was focused on two major topics. The first was exploring the impact of loading methods and pressure. The second topic was determining the effect of inhomogeneous moisture distribution among and within grain kernels. The objective of my research was to answer the following questions:
EFFECT OF LOADING METHODS AND PRESSURE 1. Do loading methods and applied pressure affect
a. the dielectric properties of grains,
b. the effectiveness of the Landau-Lifshitz, Looyenga (LLL) density correction, c. the moisture content prediction of grains?
2. Does the test cell geometry influence the effectiveness of LLL density correction?
3. Is there any difference between the effects of various loading methods and pressure on the dielectric properties of grains?
EFFECT OF INHOMOGENEOUS MOISTURE DISTRIBUTION Inhomogeneous Moisture Distribution within Kernels
4. Does inhomogeneous moisture distribution within corn kernels significantly influence the dielectric properties of bulk corn?
2
5. To what extent does inhomogeneous moisture distribution within corn kernels cause moisture prediction differences (relative to equilibrated corn kernels) at various moisture contents and measurement frequencies?
6. Can a dielectric sensing method discriminate between corn samples with inhomogeneous moisture distributions within kernels (as caused by drying) and corn samples that are well equilibrated?
Mixtures of Dry and Wet Corn
7. Do inhomogeneous moisture distributions among the kernels cause significant differences in moisture measurement results for mixtures of dry and wet grain (as opposed to equilibrated grain)? Does the choice of the measurement frequency influence the observed differences?
8. What are the differences in predicted moisture content of mixtures of wet and dry corn before and after equilibrium at various moisture contents and mixing ratios.
9. Can a dielectric sensing method discriminate between corn samples with inhomogeneous moisture distributions among kernels (mixtures of wet and dry corn) and corn samples that are well equilibrated?
MATERIALS AND METHODS
TEST CELLS
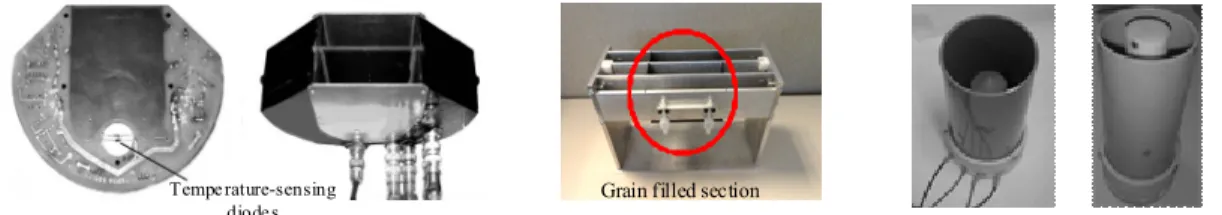
For my measurements I used three test cells: two parallel plate test cells and a coaxial test cell with two variations (without and with extended center electrode) .(figure 1)
Figure 1. Test cells. GAC 2100 test cell (left), UGMA test cell (center), coaxial test cell (right)
Using mathematical models of the test cells (based on physical dimensions and measurements of the permittivity of distilled water), I calculated the permittivity of grain samples. The moisture was calculated from the relative dielectric constant with or without Landau-Lifshitz, Looyenga density correction and temperature correction.
Tempe rature-sensing
diode s Grain filled section
3 LOADING METHODS
Each loading method was applied the same way for each test cell. For the slow pouring method, the grain sample was slowly poured into the test cell within approximately 30 seconds, shaking the test cell during the loading to achieve a relatively high packing density. The fast drop method was performed using a drop mechanism that was temporarily set on the test cell. Releasing a door on the mechanism caused the sample to drop into the test cell very quickly.
EFFECT OF PRESSURE
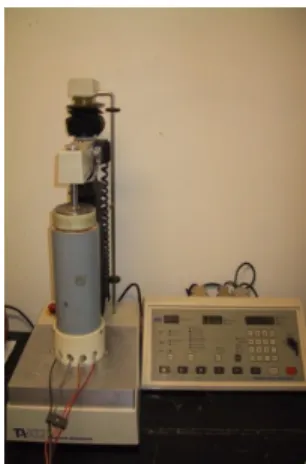
The pressure which caused compaction of the bulk grain was carried out in two ways. For the first parallel-plate test cell in figure 1 (the GAC 2100 test cell) and for the coaxial and modified coaxial test cell, a SMS TA-XT2 precision penetrometer (figure 2) was applied to compress the grain samples. The dielectric measurements were performed when the defined forces were reached, and corresponding displacements were recorded to permit assessment of density changes.
For the second parallel-plate test cell in figure 1 (the UGMA test cell), an expanded polyurethane slab with proper design was placed on the sample in the test cell, and on top of this various masses (1, 2 and 3 kg) were placed (figure 3) for 5 seconds. The dielectric measurements were performed after removing the weights.
INHOMOGENEOUS MOISTURE DISTRIBUTION Inhomogeneous moisture
distributions can occur among kernels (in mixtures of dry and wet kernels) and within kernels (after drying) (figure 4).
Figure 2.SMS TA-XT2 precision penetrometer and coaxial test cell
Figure 3. UGMA test cell with applied load
Wet Dry
Figure 4. Inhomogeneous moisture distribution among kernels (left), and within kernels (right) in the test cell
4 MIXTURES
Three sets of measurement were carrying out regarding mixtures:
The first set of measurements involved portions of one dry corn sampleand samples with different moisture content blended at a 50:50 mass ratio. (figure 5)
The second set of measurements was
targeting a 16.5 % moisture content in the mixtures to duplicate the effects of blending wet and dry corn to reach a desired moisture content. (figure 6)
The third set contained mixtures with 90:10, 75:25 and 50:50 mass ratios blended using 13 % dry and 18
%, 20 %, 25 % and 30 % wet corn to reveal the effect of different ratios.
MOISTURE INHOMOGENEITY WITHIN KERNELS The samples were dried using a Venticell 110 forced air oven at 70 °C temperature (figure 7). Table 1 shows the initial and the final moisture contents of the samples.
For tests regarding inhomogeneous moisture distributions, the dielectric measurements were run using the GAC test cell right after mixing or drying and then again 24 hours later when the samples were equilibrated.
Inital Moisture
air oven (%) Drying
Time (h) Final Moisture air oven (%) 22.9 1 18.5 22.9 2 16.5 25.4 1 20.3 25.4 2.3 15.6 25.4 3 14.9 26.2* 2 14.6
26.2* 3 12.1 26.2* 4 11.2 26.2* 5 10.2
34.0 2 23.5 34.0 3 21.0 * Burrows 700 moisture tester value
50 : 50 13.1 % + 23.3 %
50 : 50 13.1 %+ 25.8 %
50 : 50 13.1 %+ 34. 0 %
1.
2.
3. 1.
2.
1. 3.
2.
3.
Figure 5. Schematic of mixtures with a 50:50 ratio of components
13 % + 18 % 13 % + 20 % 13 % + 25 % 13 % + 30 %
Goal:
16.5 %
Figure 6. Schematic of mixtures with specified target moisture
Table 1. Air oven moistures before and after drying
Figure 7. Drying the samples
5
RESULTS AND DISCUSSION
BEHAVIOR OF LLL DENSITY CORRECTION BELOW 100 MHZ
I have investigated the effectiveness of LLL density correction for two effects causing compaction of grain sample: 1) shaking and slow pouring, and 2) pressure applied on the top of bulk grain. To demonstrate the behavior of dielectric properties with different loading methods, I plotted the ratio of the relative dielectric constants measured with slow pouring (higher density) and fast drop. For the study of the effects of pressure, I used the ratio of relative dielectric constants with the applied pressure divided by the results of the measurement loaded using fast drop without pressure. The assessment was the same for both cases—if the value of the ratio was very near1.0 when the LLL density correction was applied, the LLL correction was deemed effective in eliminating the impact of the different densities on the density-corrected dielectric measurements.
THE LLL DENSITY CORRECTION AND LOADING METHODS
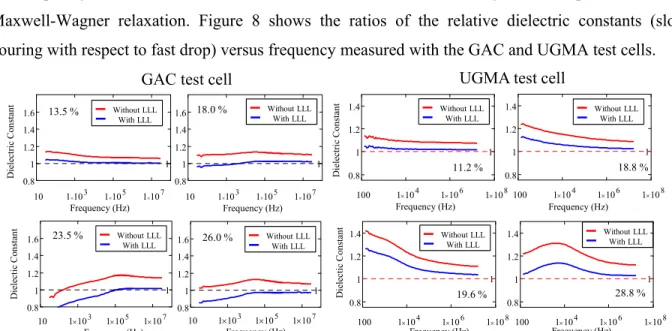
I have found that the effectiveness of the LLL density correction is dependent on the test cell geometry and frequency below 28 MHz. The observed differences were caused by electrode polarization and Maxwell-Wagner relaxation. Figure 8 shows the ratios of the relative dielectric constants (slow pouring with respect to fast drop) versus frequency measured with the GAC and UGMA test cells.
Figure 8. The ratios of the relative dielectric constants for corn (ε'slow/ε'fast) versus frequency before and after applying LLL density correction at different moisture contents using the GAC and the
UGMA test cells
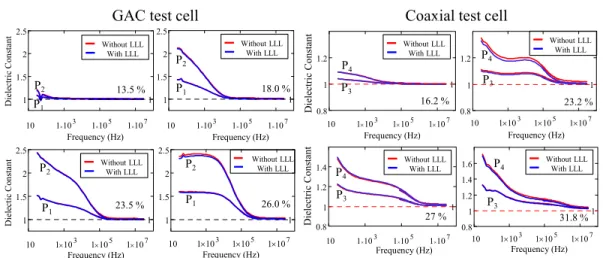
I have found that if the center electrode is shorter than the outer electrode in the coaxial test cell (so the bulk density of the grain sample is different in the electrically active part between the electrodes and above the center electrode where the grain is not sensed) the effectiveness of the LLL density correction is substantially reduced. Figure 9 shows the ratios of the relative dielectric constants
10 1 10 3 1 10 5 1 10 7 0.8
1 1.2 1.4 1.6
1 10 1 10 3 1 10 5 1 10 7
0.8 1 1.2 1.4 1.6
1
10 1 10 3 1 10 5 1 10 7
0.8 1 1.2 1.4 1.6
1
Frequency (Hz)
Frequency (Hz)
Dielectic Constant
18.0 %
10 1 10 3 1 10 5 1 10 7
0.8 1 1.2 1.4 1.6
1
Frequency (Hz)
Dielectric Constant
13.5 %
26.0 %
Frequency (Hz) 23.5 %
GAC test cell
100 1 10 4 1 10 6 1 10 8 0.8
1 1.2 1.4
1
100 1 10 4 1 10 6 1 10 8 0.8
1 1.2 1.4
1
100 1 10 4 1 10 6 1 10 8 0.8
1 1.2 1.4
1
100 1 10 4 1 10 6 1 10 8 0.8
1 1.2 1.4
1
11.2 % 18.8 %
28.8 % 19.6 %
Frequency (Hz)
Frequency (Hz)
Dielectic Constant
Frequency (Hz)
Dielectric Constant
Frequency (Hz)
UGMA test cell
Without LLL With LLL Without LLL
With LLL
Without LLL With LLL Without LLL
With LLL
Without LLL With LLL Without LLL
With LLL
Without LLL With LLL
Without LLL With LLL
6
(ε'slow/ε'fast) of corn samples using the coaxial test cell without and with the center electrode extended (to the height of the outer electrode) by a dielectric cylinder of the same diameter as the center electrode.
Figure 9. The ratios of the relative dielectric constants for corn (ε'slow/ε'fast) versus frequency before and after applying LLL density correction at different moisture content using the coaxial and the
modified coaxial test cells
I have concluded that LLL density correction successfully reduced the differences in the 100 KHz – 28 MHz frequency range caused by bulk density differences for corn in the 11.2 % -31 % moisture range using any of the test cells with equal height of the inner and outer electrodes.
LLL DENSITY CORRECTION AND PRESSURE
Figure 10. The ratios of the relative dielectric constants (ε'P1/ε'fast and ε'P2/ε'fast) for corn with moisture contents of 13.5 % - 26.0 % versus frequency before and after applying LLL density correction using
the GAC and coaxial test cells; P1 = 2.8 kPa, P2 = 5.6 kPa and P3=1.5 kPa, P4=3 kPa
10 1 10 3 1 10 5 1 10 7
0.8 1 1.2 1.4 1.6
1 10 1 10 3 1 10 5 1 10 7 0.8
1 1.2 1.4 1.6
16.2 %1 23,2 %
27 %
LLL korrekció nélkül LLL korrekcióval
LLL korrekció nélkül LLL korrekcióval
31,8 % 10 1 10 3 1 10 5 1 10 7 0.8
1 1.2 1.4 1.6
1
10 1 10 3 1 10 5 1 10 7 0.8
1 1.2 1.4 1.6
1
Frequency (Hz)
Frequency (Hz)
Dielectic Constant
Frequency (Hz)
Dielectric Constant
Frequency (Hz) 23.2 %
31.8 %
Coaxial test cell
10 1 10 3 1 10 5 1 10 7
0.8 1 1.2 1.4 1.6
1 10 1 10 3 1 10 5 1 10 7
0.8 1 1.2 1.4 1.6
1
10 1 10 3 1 10 5 1 10 7 0.8
1 1.2 1.4 1.6
1 10 1 10 3 1 10 5 1 10 7
0.8 1 1.2 1.4 1.6
1
16.2 % 20.5 %
23.5 % 31.8 %
Frequency (Hz)
Frequency (Hz)
Dielectic Constant
Frequency (Hz)
Dielectric Constant
Frequency (Hz)
Modified Coaxial test cell
Without LLL
With LLL Without LLL
With LLL
Without LLL
With LLL Without LLL
With LLL Without LLL
With LLL Without LLL
With LLL
Without LLL With LLL
Without LLL With LLL
GAC test cell Coaxial test cell
Dielectic ConstantDielectric Constant
10 1 10 3 1 10 5 1 10 7 1
1.5 2 2.5
1 10 1 10 3 1 10 5 1 10 7
1 1.5 2 2.5
1
10 1 10 3 1 10 5 1 10 7 1
1.5 2 2.5
1 10 1 10 3 1 10 5 1 10 7
1 1.5 2 2.5
1
13.5 % 18.0 %
26.0 % 23.5 %
P1 P2
P1 P2 P2
P1
P1 P2
Frequency (Hz)
Frequency (Hz) Frequency (Hz)
Frequency (Hz) Without LLL
With LLL
Without LLL With LLL
Without LLL With LLL
Without LLL With LLL
10 1 10 3 1 10 5 1 10 7 0.8
1 1.2 1.4 1.6
1 10 1 10 3 1 10 5 1 10 7
0.8 1 1.2
1
10 1 10 3 1 10 5 1 10 7 0.8
1 1.2
1
10 1 10 3 1 10 5 1 10 7
0.8 1 1.2 1.4
1
Frequency (Hz) Frequency (Hz)
16.2 %
Frequency (Hz) 23.2 %
27 % 31.8 %
Frequency (Hz) P3
P4
P3 P4 P4
P3 P3
P4
Dielectric ConstantDielectric Constant
Without LLL With LLL
Without LLL With LLL
Without LLL
With LLL Without LLL
With LLL
7
I have found that the LLL density correction did not significantly reduce the changes in dielectric constant caused by compacting samples by applying pressure.The value of the ratios of the relative dielectric constant (with pressure divided by without pressure) of the samples with moisture above 13.5 % increased with decreasing frequency below 100 kHz, but the dielectric spectra did not change significantly with applying the LLL density correction—regardless of the test cell type. (figure 10)
DESCRIBING DIELECTRIC PROPERTIES USING ARGAND PLOTS
I have shown for corn and soybean samples that the Argand plots have three types of appearance depending on which conductivity effect or effects were dominant at that moisture level. Below 14 % moisture content, only an arc representing the Maxwell-Wagner relaxation was observable. At about 14% moisture content, a line appeared at the low frequency end of the Argand plot. With increasing moisture content, the length of the line representing the electrode polarization became longer, and above 20 % moisture content the electrode polarization dominated the curves.
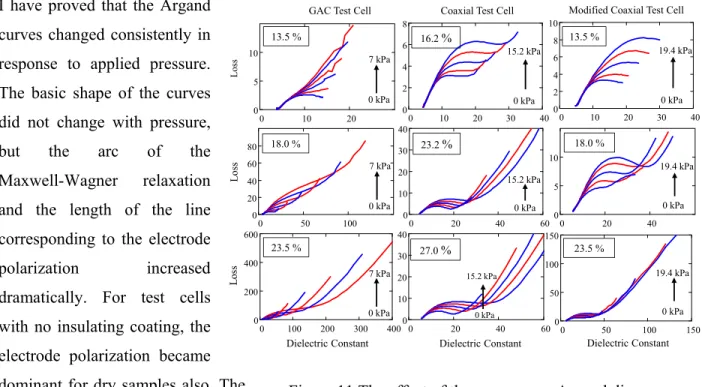
PRESSURE EFFECT ON THE ARGAND PLOTS I have proved that the Argand
curves changed consistently in response to applied pressure.
The basic shape of the curves did not change with pressure, but the arc of the Maxwell-Wagner relaxation and the length of the line corresponding to the electrode
polarization increased dramatically. For test cells
with no insulating coating, the electrode polarization became dominant for dry samples also. The relationship between the chord
length of the arc of the Maxwell-Wagner relaxation and the pressure is a line with the equation (1):
Chord_Length = 1.114*Pressure+12.633, coefficient of determination was 0.954.
0 10 20
0 5 10
13.5 %
0 50 100
0 20 40 60 80 18.0 %
0 100 200 300 400
0 200 400 600
23.5 %
0 10 20 30 40
0 2 4 6 8
16.2 %
0 20 40 60
0 10 20 30 40
23.2 %
0 20 40 60
0 10 20 30 40
27.0 %
0 50 100 150
0 50 100 150
0 10 20 30 40
0 2 4 6 8 10
0 20 40
0 5 10
13.5 %
18.0 %
23.5 %
LossLossLoss
Dielectric Constant Dielectric Constant Dielectric Constant 0 kPa
7 kPa 0 kPa 7 kPa 0 kPa 7 kPa
0 kPa 15.2 kPa
0 kPa 15.2 kPa
0 kPa 15.2 kPa
0 kPa 19.4 kPa
0 kPa 19.4 kPa
0 kPa 19.4 kPa GAC Test Cell Coaxial Test Cell Modified Coaxial Test Cell
Figure 11 The effect of the pressure on Argand diagram
8
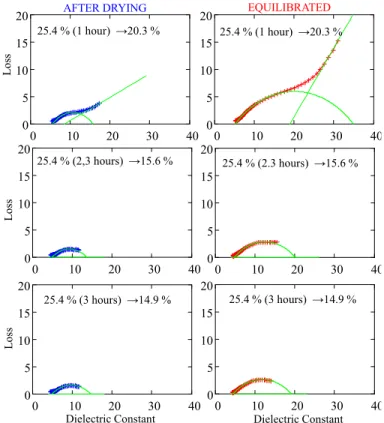
INHOMOGENEOUS MOISTURE DISTRIBUTION WITHIN KERNELS I have determined that there is difference
between the dielectric properties of samples immediately after drying and after equilibration. My goal was to develop a method to discriminate the inhomogeneous and the equilibrated samples. Figure 12 shows the Argand diagrams (with fitted arcs and lines) for corn samples with 25.4
% moisture content (after various drying times) after drying and after equilibration.
As visible on the plots, the basic shapes of the Argand diagrams did not change, but the size almost doubled. The behavior of the curves was very similar for corn samples with 22.9 % and 34,0 % moisture content also.
On the graphs, the electrode polarization was not observable or was barely observable for dry samples. However the Maxwell-Wagner relaxation was always present for all dry and wet samples. I have hypothesized that the significant difference of the dielectric properties of samples immediately after drying and after equilibration is detectable using the parameters (chord length, angle corresponding to the chord and the characteristic frequency) derived from the fitted arc corresponding to the Maxwell-Wagner relaxation. I have concluded that only the chord length showed significant differences between samples immediately after drying and equilibration regardless of the moisture
0 10 20 30 40
0 5 10 15 20
0 10 20 30 40
0 5 10 15 20
0 10 20 30 40
0 5 10 15 20
0 10 20 30 40
0 5 10 15 20
0 10 20 30 40
0 5 10 15 20
0 10 20 30 40
0 5 10 15 20
Loss
AFTER DRYING EQUILIBRATED
Loss
Dielectric Constant Dielectric Constant
25.4 % (1 hour) →20.3 % 25.4 % (1 hour) →20.3 %
25.4 % (2,3 hours) →15.6 % 25.4 % (2.3 hours) →15.6 %
25.4 % (3 hours) →14.9 %
Loss
25.4 % (3 hours) →14.9 %
Figure 12. Argand diagrams of corn samples with 25.4 % moisture, green – fitted arc and line
8 10 12 14 16 18 20
8 10 12 14 16
22.9 % (1 hour)→18.5 % 1822.9 % (2 hours)→16.5 %
Chord Length
0 10 20 30 40
50 2.4 % (1 hours)→20.3 %
8 10 12 14 16
1825.4 % (2.3 hours)→15.6 %
8 10 12 14
1625.4 % (3 hours)→14.9 %
Chord Length
0 50 100
150 34.0 % (2 hours)→23.5 %
0 20 40 60 80
10034.0 % (3 hours)→21.0 %
Chord Length
Equilibrated After Drying
Figure 13. Mean of the chord lengths (3 repeats) and the 95
% confidence intervals for corn with 22.9 %, 25.4 % and 34.0 % moisture contents and various drying times
9
content and drying time. Figure 13 shows the mean of the chord lengths for 3 repeats and the corresponding 95 % confidence intervals for corn samples with 22.9 %, 25.4 % and 34.0 % moisture content.
MIXTURES OF DRY AND WET CORN
In this part of my work, the goal was to determine the error of the predicted moistures over frequency caused by inhomogeneity of the moisture distribution of mixtures of wet and dry grain. I have proven that the predicted moisture of recently blended corn is significantly different from that of equilibrated samples. Figure 13 shows the difference of the predicted moisture over frequency calculated from the relative dielectric constant (applying temperature and density correction). The ratios of the wet and dry components of the grain mixtures were calculated to achieve 16.5 % moisture content for each of the mixtures.
It is visible on the plot that the magnitudes and the signs of the differences are dependent on measurement frequency and differences in the moisture contents of the components of the mixtures.
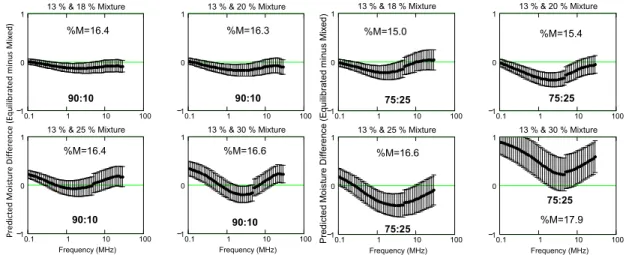
Similar tendencies were observable for mixtures with predefined weight proportions (Figure 14).
Figure 15. Mean differences of predicted moisture (equilibrated minus non-equilibrated) with 95 % confidence intervals versus frequency for corn mixtures with 90:10 (four left plots) and 75:25 (four
right plots) proportions of the components
0.1 1 10 100
1 0
1 13 % & 18 % Mixture
0.1 1 10 100
1 0
1 13 % & 20 % Mixture
0.1 1 10 100
1 0
1 13 % & 25 % Mixture
Frequency (MHz)
0.1 1 10 100
1 0
1 13 % & 30 % Mixture
Frequency (MHz)
Predicted Moisture Difference (Equilibrated minus Mixed)
%M=15.0
%M=16.6
%M=15.4
%M=17.9
0.1 1 10 100
1 0
1 13 % & 18 % Mixture
0.1 1 10 100
1 0
1 13 % & 20 % Mixture
0.1 1 10 100
1 0
1 13 % & 25 % Mixture
Frequency (MHz)
0.1 1 10 100
1 0
1 13 % & 30 % Mixture
Frequency (MHz)
Predicted Moisture Difference (Equilibrated minus Mixed)
%M=16.4 %M=16.3
%M=16.6
%M=16.4
90:10 90:10
90:10 90:10
75:25 75:25
75:25
75:25
1 10 5 1 10 6 1 10 7 1 10 8
0.5
0 0.5 1
0
▲13 % + 18 % → 16.4 % + 13 % + 20 % → 16.3 %
■13 % + 25 % → 16.4 %
●13 % + 30 % → 16.6 %
Frequency (Hz) Moisture difference (Equilibrated -Mixed) (%M)
Figure 14. Mean differences of the predicted moisture
(equilibrated minus– non-equilibrated)
10
There was a tendency for the predicted differences between equilibrated and mixed grain to be lower (less positive or more negative) in the 1 to 10 MHz frequency range than at lower or higher frequencies. This effect was less pronounced for mixtures whose final moisture levels were below 15 percent (first three plots of Figure 14). Confidence intervals tended to increase for mixtures that involved higher moisture corn. The mean differences were statistically significant (confidence intervals did not include zero) for much of the frequency range for mixtures involving 18 and 20 percent moisture corn, but not for 25 and 30 percent moisture corn.
The strong curvature observed in figures 13 and 14 suggested that it might be possible to detect whether a corn sample was a mixture of wet and dry corn or was equilibrated. Several types of discriminant analysis were attempted, including principal components analysis and partial least squares regression, but the most effective was a quadratic discriminant function involving the differences in predicted moisture values based on dielectric measurements at 5 MHz and 28 MHz:
− = −0,01 ∙ − 14 − 0,18
where M5MHz was the predicted moistrure at 5 MHz, and M28MHz was the predicted moisture at 28 MHz. The mixture is equilibrated if M28 MHz – M5 MHz ≥ -0.01·( M28 MHz - 14)2 – 0.18
The results of the method for naturally moist and artificaly moistened corn samples are visible on the next plot (Figure 16):
Figure 16. Predicted moisture differences between 28 MHz and 5 MHz for mixed and equilibrated
corn samples. The dashed line represents the quadratic discrimination boundary for mixed and equilibrated samples.
This discriminant method correctly identified mixed and equilibrated samples for more than 92 % of the tests for both artificially moistened and naturally moist samples.
12 14 16 18 20 22 24
1.5 1 0.5 0
0.5 Artificially Moistened Samples
Predicted Moisture @ 28 MHz (%)
Predicted Moisture Difference (%) 12 14 16 18 20 22 241.5
1 0.5 0
0.5 Naturally Moist Samples
Predicted Moisture @ 28 MHz (%)
Predicted Moisture Difference (%)
o Equilibrated o Equilibrated
+ Mixed
+ Mixed
11
NEW SCIENTIFIC RESULTS
The effectiveness of the Landau-Lifshitz, Looyenga density correction below 100 MHz
1. I demonstrated that the Landau-Lifshitz, Looyenga density correction achieved the following:
a. It successfully corrected the impact of different bulk densities caused by different loading methods for corn samples with moisture content between 11.2 % -31.8 % in the frequency range of 100 kHz – 28 MHz.
b. It became less and less effective at correcting for differences in bulk density at measurement frequencies below 100 kHz.
2. Based on the measurements on the coaxial test cell, I have proven that if the center electrode is shorter than the outer electrode in the coaxial test cell (so that the bulk density of the grain sample is different in the electrically active part than above it), then the effectiveness of the LLL density correction is substantially reduced. For eliminating the error caused by density differences in grain moisture measurement, it is essential and fundamental to accurately determine the grain density in the electrically active part of the test cell.
3. I have proved that the differences of the dielectric properties caused by pressure were statistically significant in 100 Hz – 28 MHz frequency range. I have shown that the cause of the change of the dielectric properties is not the density difference as a result of pressure but the increased conductivity effects. The Landau-Lifshitz, Looyenga density correction is incapable of correcting the errors caused by these effects.
Dielectric Properties in Argand Plots
4. I demonstrated that the Argand plots are generally describable using an arc for the Maxwell- Wagner relaxation and a line for electrode polarization (independent of test cell type) in the 100 Hz – 28 MHz frequency range.
a. Only arc for corn and soybean samples below 14 % moisture,
b. Both arc and line were applicable for corn with 14% - 35.2 % moisture content and soybeans with 14 % - 22.9 % moisture content.
Pressure Effect
5. I have found that frequency ranges of Maxwell-Wagner relaxations and electrode polarization shifted for each grain type, test cell type, and moisture content. The electrode polarization in the spectra became more dominant with increasing pressure and moisture content of the samples.
12
6. I have found that the basic shape of the of the Argand plots did not change with pressure for corn with 11.2 % - 36.9 % moisture content for each test cell, but the chord length of the fitted arc (distance intercepted on the dielectric constant axis) and the length of the electrode polarization line increased with increasing pressure.
7. I determined that the relationship between the chord length (derived from Argand diagrams) and pressure was linear and independent of the moisture content between 14.3 % and 20.4 % moisture content for corn using the modified coaxial test cell. The functional relationship was Chord_length = 1.114 * Pressure + 12.633. The coefficient of determination was 0.954.
Moisture Inhomogeneity within the Kernels
8. I proved that inhomogeneous moisture distribution within the kernels after drying caused significant differences in the values of chord length on the Argand diagram relating to the Maxwell-Wagner relaxation. This can be a basis for determining a certain threshold discriminating states of equilibrium and non-equilibrium corn samples.
Mixtures of Dry and Wet Corn
9. The difference of the predicted moisture between equilibrated and non-equilibrated mixtures of dry and wet corn is dependent on the moisture content of the wet component of the mixture and the measurement frequency.
10. I developed a method to discriminate equilibrated and non-equilibrated mixtures of dry and wet corn using the predicted moisture derived from the relative dielectric constants measured at 5 MHz and 28 MHz. The effectiveness of the discrimination for equilibrated and non equilibrated mixtures was 92 % with the following criteria:
The mixture is equilibrated if
M28 MHz – M5 MHz ≥ -0.01·( M28 MHz - 14)2 – 0.18
13
RECOMMENDATION FOR FURTHER RESEARCH
My recommendations for further research in this area are as follows:
• Conduct further wide-range frequency tests with many corn and soybean samples and fit the data as Argand diagrams to better define the frequency ranges where Maxwell-Wagner relaxation and electrode polarization are important.
• Perform additional tests to study the relationships between electrode polarization and test cell electrode shape and materials.
• Determine the temperature effects on the fitted parameters of Argand diagrams to develop a more complete and accurate mathematical model of dielectric behaviour of grain at sub-Megahertz frequencies.
• Define the range of compacting pressures that grain could experience in on-line measurement situations, and attempt to develop ways to correct for the effects of pressure on dielectric characteristics in this pressure range.
• Develop a more robust discriminant function for identifying mixtures of wet and dry grain.
Test the applicability of the discriminant function to different grain types and test cell geometries.
• Conduct additional tests with dried and equilibrated grain to refine the discriminant function for dried grains based on the chord length of the Argand diagram. Apply this method to grains other than corn.
14
PUBLICATIONS RELATED TO THE THESIS
International Reviewed Publications (IF):
Gillay, B., Funk, D. B. (2006) Effects of moisture distribution on measurement of moisture content of dried corn. Acta Alimentaria, 35(2), pp. 171-181.
International Reviewed Publications:
Gillay B., Funk D. B. (2005) Effects of Non-uniform Kernel Moisture Content on Moisture Measurement of Corn Progress in Agricultural Engineering Sciences, 1(1) pp. 77-93.
Hungarian Publication
Gillay B., (2005) Szemes termények nedvességtartalmának meghatározása-Agro Napló IX.
évf. 2005/6-7 pp.
International Conference (Full):
Gillay B., Fekete A. (2001) Sensing corn moisture content at different bulk densities– In proceedings ASAE Annual International Meeting, Sacramento, (paper number: 013101)
Gillay B., Funk D. B. (2002) Efficacy of the Landau-Lifshitz, Looyenga mixture equation for density-correcting dielectic measurements of yellow-dent corn subjected to vibration and pressure – In proceedings ASAE/CIGR Annual International Meeting, Chicago (paper number: 0238207, lecture)
Gillay B., Funk B. D. (2002) On-line RF grain moisture measurement – In proceedings of ICC Conference, Budapest. (P47)
Gillay B, Funk D. B. (2002) Temperature effects in corn moisture measurement– In proceedings of EurAgEng Conference, Budapest [CD - 02-PH-074]
Gillay B., Funk D. B. (2003) Mathematical modeling of the low-frequency range changes in dielectric constant measurements due to settling and pressure – In proceedings ASAE Annual International Meeting, Las Vegas Paper number: 033135.
Funk D. B., Gillay B., Gillay Z. (2011) Maxwell-Wagner Relaxations in Grain Dielectric Measurements-Microscopic or Macroscopic Effects – ISEMA, Kansas City, USA, pp. 100-109.
15 Hungarian Conference (Full):
Gillay B., Funk D. B. (2003) Inhomogén nedvességeloszlás hatása a dielektromos nedvességmérésre – MTA AMB Kutatási és Fejlesztési Tanácskozás. Gödöllő, SZIE Gépészmérnöki Kar - FVM Műszaki Intézet, Nr. 27
Gillay B., Funk D. B. (2002)Vibráció és nyomás hatása kukoricaminták dielektromos jellemzőire – MTA AMB Kutatási és Fejlesztési Tanácskozás. Gödöllő, SZIE Gépészmérnöki Kar - FVM Műszaki Intézet, Nr. 26(2) pp. 120-124.
Gillay B. (2001) Nedvességtartalom mérésének laboratóriumi modellezése –MTA AMB Kutatási és Fejlesztési Tanácskozás. Gödöllő, SZIE Gépészmérnöki Kar - FVM Műszaki Intézet, Nr. 25(1) pp. 147-151.
Citations:
B. Gillay, D. Funk (2003) Mathematical modeling of the low-frequency range changes in dielectric constant measurements due to settling and pressure – In proceedings ASAE Annual International Meeting, Las Vegas Paper number: 033135.
Cited by:Sheu J. I., Sheu E. Y. (2006) Characterization of DNA degradation using direct current conductivity and dynamic dielectric relaxation AAPS PharmSciTech. 7(2) pp. 33-44.
Gillay B., Funk D. B. (2006). Effects of moisture distribution on measurement of moisture content of dried corn. Acta Alimentaria, 35(2): 171-181.
Cited by: Oliveros-Tascón, C. E., et al. (2010) Determinación del contenido de humedad del café durante el secado en silos. Cenicafé 61(2): 108-118.
ACKNOWLEDGEMENTS
I would like to express my appreciation to:
Dr. András Fekete for his valuable support and advice,
Dr. David Funk for the valuable advising and help,
Dr. József Felföldi for the valuable advising and help,
to all my colleagues at the Department of Physics and Control for the support, and
my family for the their patience.