CERS-IE WORKING PAPERS | KRTK-KTI MŰHELYTANULMÁNYOK
Conditional cooperation in group contests
HUBERT JÁNOS KISS – ALFONSO ROSA-GARCIA – VITA ZHUKOVA
CERS-IE WP – 2020/42
October 2020
https://www.mtakti.hu/wp-content/uploads/2020/10/CERSIEWP202042.pdf
CERS-IE Working Papers are circulated to promote discussion and provoque comments, they have not been peer-reviewed.
Any references to discussion papers should clearly state that the paper is preliminary.
Materials published in this series may be subject to further publication.
ABSTRACT
In this paper we show experimentally that conditional cooperation, a phenomenon described in the private provision of public goods, is also present in group contests, where participants’ contributions to their group performance partially determines if they overcome a rival group. This environment allows us to identify new determinants of conditional cooperation. We observe conditional cooperation in successful groups and in groups where members contribute more than rivals (even if they lose), but it vanishes in those groups that lose the contest due to low group performance. A random-effect linear panel regression analysis with an extensive set of controls confirms the findings.
JEL codes: C72, C92, D70
Keywords: conditional cooperation, group contest
Hubert János Kiss
KRTK KTI, 1097 Budapest, Tóth Kálmán u. 4, Magyarország.
and
Budapesti Corvinus Egyetem, 1093 Budapest, Fővám tér 8, Magyarország.
e-mail: kiss.hubert.janos@krtk.mta.hu Alfonso Rosa-Garcia
Departamento de Fundamentos del Análisis Económico, Facultad de Economía y Empresa, Universidad de Murcia, Campus de Espinardo, 30100 Murcia, Murcia, Spain.
e-mail: alfonso.rosa@um.es Vita Zhukova
Department of Business, Universidad Católica San Antonio de Murcia, Campus de los Jerónimos, Guadalupe 30107 Murcia, Spain.
e-mail: vzhukova@ucam.edu
[Feltételes együttműködés csoportos versengésben]
[HUBERT JÁNOS KISS] – [ALFONSO ROSA-GARCIA] – [VITA ZHUKOVA]
ÖSSZEFOGLALÓ
Ebben a tanulmányban kísérleti úton mutatjuk meg, hogy a feltételes együttműködés, amit közjószág-játékokban leírtak, csoportos versengésben is jelen van. Ezen versengés során a csoport tagjainak a hozzájárulása határozza meg részben azt, hogy az egyén csoportja legyőzi-e a rivális csoportot. Ebben a környezetben a feltételes együttműködés új meghatározó tényezőit azonosítottuk. Megfigyelünk feltételes együttműködést sikeres csoportokban és olyan csoportokban is, ahol a tagok hozzájárulása nagyobb, mint a rivális csoportban (habár ennek ellenére veszítenek), de a feltételes együttműködés eltűnik az olyan csoportokban, ahol a csoport alacsony teljesítménye miatt veszítenek. Véletlen hatású lineáris panel regresszióval végzett elemzésünk, melyben számos kontroll-változót használunk, megerősíti az előző eredményeket.
JEL: C72, C92, D70
Kulcsszavak: Csoportos versengés, Feltételes együttműködés
Conditional cooperation in group contests
Hubert J´anos Kiss1,2, Alfonso Rosa-Garcia3, Vita Zhukova4,
1Center for Economic and Regional Studies, Institute of Economics (KRTK KTI), Budapest, Hungary
2Department of Economics, Corvinus University of Budapest, Budapest, Hungary 3Departamento de Fundamentos del An´alisis Econ´omico, Universidad de Murcia, Murcia, Spain
4Department of Business, Universidad Cat´olica San Antonio de Murcia, Murcia, Spain
Abstract
In this paper we show experimentally that conditional cooperation, a phenomenon described in the private provision of public goods, is also present in group contests, where participants’ contributions to their group performance partially determines if they overcome a rival group. This environment allows us to identify new determinants of conditional cooperation. We observe conditional cooperation in successful groups and in groups where members contribute more than rivals (even if they lose), but it vanishes in those groups that lose the contest due to low group performance. A random-effect linear panel regression analysis with an extensive set of controls confirms the findings.
1 Introduction
Conditional cooperation is the tendency of individuals to engage in cooperation depending on the degree of cooperation of other individuals, and is argued to be one of the main sources of high contributions in social dilemmas [1]. Numerous lab
experiments [2–7] have documented the existence of conditional cooperation using the public goods game. In an overview, [8] report that the findings are quite stable across studies, about 61% of participants being classified as conditional cooperators (followed by about 20% of free-riders). This behavior has been described in other related environments, for instance, in collective-risk social dilemmas (a variant of public goods games), where a group must achieve a given threshold through common contributions to avoid a general loss (i.e., as a climate change environment), see [9]. It is thus natural to assume that this behavior should at least partly explain how individuals behave in group contests, i.e., situations in which members of a group face a social dilemma when competing with other rival groups. [10–13] provide a nice introduction to the theory of group contest.
Group contests are pervasive, including rent-seeking and lobbying, innovation tournaments and R&D races or sports competitions. The experimental group contest literature consistently finds that average effort level (though often showing a declining pattern) is significantly higher than the equilibrium prediction, a phenomenon known as overexpenditure, see for instance [14–21]. Some explanations provided by the literature are pure joy of winning [22–25], bounded rationality [26–28], relative payoff
maximization [29] and social identity [17]. Surprisingly, the role of conditional cooperation in group contests has not been analyzed yet. In this paper we approach experimentally this question. Some studies investigate how participants react to
feedback information about others’ contribution in individual contests. For instance, [30] find that individuals ranking higher (lower) decrease (increase) their contribution. Similar findings were reported by [29, 31] in a different setup. [7] report that most of the participants in individual contests with fixed groups behave
reciprocally to opponents’ previous choices.
The first question when studying conditional cooperation in group contests is if such a behavior is still present under the simultaneous presence of cooperation and
competition. Moreover, the group contest environment makes possible to test how conditional cooperation is shaped by the competitive elements. In this environment, with the lottery contest success function in place, the success of a group in the contest is due to a mixture of group behavior and randomness. This allows us to test if conditional cooperation is affected by 1) the group efforts (that may be larger or lower than those of the rival group) and 2) winning or losing the contest just due to randomness.
To this aim, we designed a laboratory experiment where subjects played a group contest. Individuals where matched in groups of four subjects and each group played a contest against a rival group repeatedly during 20 rounds. Subjects contributed from their individual endowment to generate the group total contribution. Individual contributions were added up linearly (known in the literature as a perfect substitution performance function). The probability of winning the contest was proportional to the share of the group contribution in the sum of the two groups’ contribution (known as the lottery contest success function, CSF hereafter). Finally, the prize obtained by the winner group was shared equally among the group members (known as the egalitarian sharing rule). We say that a group won the contest deservedly (by chance) if the winning group’s total contribution was larger (lower) than the rival group’s total contribution. Similarly, a group lost deservedly (by chance) if the group lost having a lower (larger) group total contribution than the rival group’s total contribution. After each round, the subjects received information about a) their group’s total contribution, b) the rival group’s total contribution, and c) the winner of the contest. This
informational setup allows us to isolate how individuals reacted a) to be in the winner or loser group, b) to be in a group that had a larger or a lower total group contribution than the rival group. Hence, it gives us the opportunity to test to which extent conditional cooperation is affected by these conditions.
As an illustration, consider the following example. In a group of 4 individuals, member A contributes 200 tokens in a given round. She knows that the total
contribution of her own group was 1500 tokens, while that of the rival group was 1600 tokens. She knows also that the rival group won the contest. In this case, member A is aware that her contribution was less than the average of her group
(200<1500/4 = 375) and that her group lost deservedly as they accumulated less tokens than the rival group. In the next round, when deciding how much to contribute to the group performance from her endowment, member A may be affected by the fact that a) she contributed less than the average contribution in her group; b) they have lost the contest; c) her group accumulated less tokens than the rival group. The first factor is the standard conditional cooperation argument studied in social dilemma games (see, for instance, [3, 4]) that assumes that individuals tend to conform to the others in their group when deciding how much to contribute to the cooperative effort.
This may be driven by social preferences like altruism [32], fairness [33] or inequality aversion [34]. The second factor (winning or losing the contest) may affect the participants in several ways. On the one hand, they may derive non-monetary utility from winning the contest [25] or they may be driven by relative payoff
maximization [22, 29]. On the other hand, the aforementioned social preferences affecting cooperation may be enhanced through the contest, participants having stronger feelings toward in-group members and being hostile toward members of the
rival group as proposed by theories like parochial altruism [35–37] or social
identity [17, 20, 38, 39]. Note that the contest may strengthen or weaken the effect of standard conditional cooperation. For instance, in our example member A may feel bad having contributed less than the average to the group performance and this feeling is exacerbated by the fact that the group lost. Hence, in the next round she may feel urged to increase her contribution to conform to the others in the group and to increase the probability of winning the contest. However, imagine that member A’s group wins the contest in the previous example. Then her desire to conform to the others may be mitigated by the fact that her group won in spite of her lower-than-average contribution.
Thus, it is an empirical question to find out how the competitive element affects conditional contribution. The third factor (winning or losing deservedly or not) adds a nuance to the effect of winning or losing. If a group wins after having contributed more than the rival group, then a group member may feel more comfortable than if the group wins by chance. In the latter case, a participant may be more inclined to change her behavior in order to increase the probability of winning in the next round. The opposite argument applies to the case of losing, because losing after having accumulated more tokens than the rival group (that is, by chance) may feel better than losing deservedly (that, in turn, may urge participants to change their contributions in the next round).
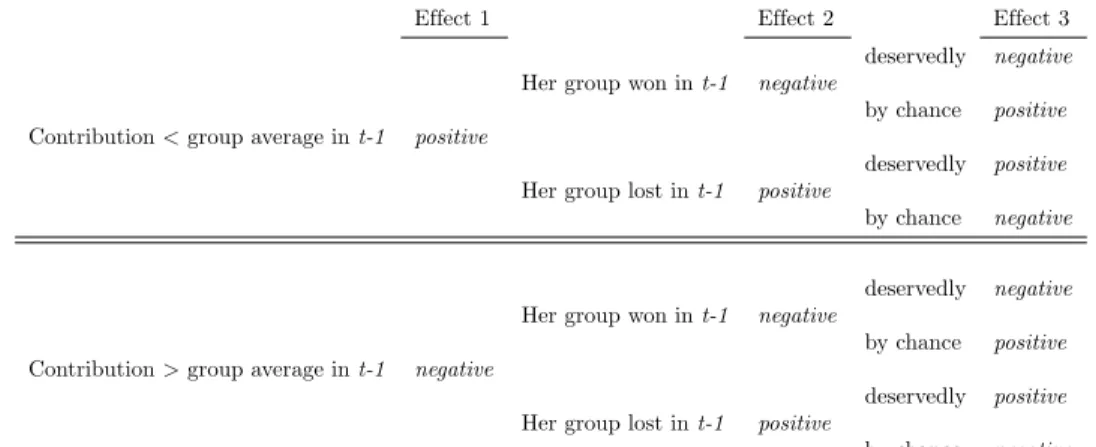
Based of the former arguments, we formulate the following conjectures. If a participant contributed less (more) than the average contribution in her group in the previous round, then in the current round she will increase (decrease) her contribution as an attempt to move toward the group average. If the participant contributed less than the group average in the previous round, then her behavior to conform with the group average is strengthened if her group lost the contest. Having lost deservedly (by chance) may make her more (less) likely to increase her contribution. If her group won the contest, then she may be less willing to conform to the group average. This lack of willingness is stronger (weaker) if her group won deservedly (by chance). We expect the opposite if the participant contributed more than the group average in the previous round. She will decrease her contribution, and more so if her group won. Having won deservedly (by chance) makes her decrease her contribution more (less). If her group lost in the previous round, then her desire to decrease her contribution may be mitigated.
Having lost deservedly (by chance) makes her decrease her contribution less (more).
Effect 1 Effect 2 Effect 3
deservedly negative Her group won int-1 negative
by chance positive Contribution<group average int-1 positive
deservedly positive Her group lost int-1 positive
by chance negative
deservedly negative Her group won int-1 negative
by chance positive Contribution>group average int-1 negative
deservedly positive Her group lost int-1 positive
by chance negative
Table 1. Conjectures: Reaction to group average in the previous round, conditioned by winning / losing, deservedly / by chance. Positive: increase contribution, negative:
decrease contribution.
We summarize the conjectures in Table 1. Note that we expect that the participants are most likely to increase their contributions if they contributed less than the group average in the previous round and their group lost deservedly, because in this case all
the factors that we expect to affect contribution point toward increasing the
contribution. Similarly, we expect that participants are most likely to decrease their contributions if they contributed more than the average in the previous round and they won deservedly. We expect the least reaction to having contributed less (more) than the group average when the group won (lost) deservedly.
In the following section we describe our experiment, then we present the results and finally we conclude.
2 The experiment
We ran a session at the LINEEX lab in Valencia in July, 2018. The share of males was 41.1%, and participants had a diverse background. The composition of the subject pool according to field of study was the following: 29% Social Sciences and Law, 27% Health Sciences, 20% Engineering and Architecture, 13% Business and / or Economics, 7%
Arts and Humanities, 4% Science. The session started with the group contest, followed by experimental games to gather information about the participants’ characteristics and a questionnaire. More concretely, we measured social attitudes using the social value orientation task [40], cooperativeness using the public goods game, risk preferences using the bomb risk elicitation task [41], competitiveness using the competitiveness game ´a la Niederle-Vesterlund [42]. There was no feedback on performance between these experimental measurements. Complete instructions are in S4 Appendix.
Participants knew that they will be paid for the group contest and from the other experimental games the computer would pick randomly one to be paid. At the beginning of the experiment the participants received a consent sheet that they read and signed (if they agreed) before starting the experiment. This written consent contained information about the experiment, the confidentiality of the data and the anonymity of the decisions. No minors were involved in the experiment.
For the group contest, 14 groups of four were formed randomly and anonymously.
Although making uncertain the number of rounds would avoid the last-round effect, in order to have a setup comparable with previous experiments on group contests, we follow [14], so groups were fixed for the 20 rounds of the group contest and the rival group remained the same as well. Participants were endowed with 1000 tokens at the beginning of each round. They could buy competition tokens for their groups, one competition token costing one token. Unused tokens added to the payoff of the participant. We used the lottery CSF, so in each round the probability of winning the contest was proportional to the total competition tokens of a given group divided by the competition tokens of both groups. The winner group received a prize of 4000 tokens, each member obtaining an equal share (1000 tokens). At the end of each round, each participant received information i) on the amount of competition tokens that she bought;
ii) on the total amount of competition tokens of the group; iii) on the total amount of competition tokens of the rival group; iv) on whether the group the participant belongs to won the contest; v) on the individual payoff in the round. Note, therefore, that the first round was informatively different from the rest of rounds, because subjects did not have the additional information on the results of the previous round.
Earnings in the group contest amounted to the sum of the payoffs of 5 randomly chosen rounds (as, for instance, in [17, 26]). Overall, the experiment lasted two hours and participants earned 16 euros on average (including the show-up fee of 5 Euro and the payment for the experimental games to elicit participants’ characteristics).
3 Findings
Figure 1 indicates the share of participants who decided to increase or decrease their contribution depending on their behavior with respect to the group in the previous round. It shows that participants increase their contribution more frequently after having contributed less than the group average in the previous round, and that they decrease their contribution more frequently after having contributed more than the group average in the previous round. This suggests that there is conditional
contribution in the group contest, the phenomenon being more emphatic upon having contributed less than the group average in the previous round.
Fig 1. Share of participants decreasing / not changing / increasing their contribution depending on if their contribution was less / more than the group average in the previous round.
In Table 2 we show how participants reacted to when they contributed less / equal / more than the group average in the previous round (that we denote as roundt-1), conditional on the result of the group contest. Note that subjects knew their own contribution and the group’s total contribution, so they could infer if they contributed more or less than the group average. We conjecture that in a group contest the result of the competition may affect the reactions (see Table 1). That is, if a group won or lost the contest in the previous round, then it may influence individual contribution (see the lineswinner / loser). Since participants knew their own and the rival group’s total contribution, they also knew if winning / losing was due to either gathering more competition tokens than the rival group (we call that deserved winner / chance loser) or having made less contribution than the rival group (chance winner / deserved loser).
Table 2 depicts all these cases, where we provide the percentage of subjects that choose to increase or decrease their contribution in roundt given their behavior with respect to their group int-1.
Those who contributed the average amount, tend to decrease their contribution. The most frequent choice of participants who contributed less (more) than the group average in the previous round is to increase (decrease) their contributions, in line with the idea of conditional cooperation, though the relative frequency generally is below 50%. This finding holds for participants in loser and winner groups as well, the effect being somewhat stronger when contribution was less than the group average int-1. Belonging to a winner or loser group by chance or deservedly also affects how participants react to having contributed more or less than the group average in roundt-1. As expected, the share of those who increased their contribution was highest among those who
contributed less than the group average in the previous round and who were in a group
Decrease contribution No change int Increase contribution # observations Contribution<Average in t-1
overall 23.95% 29.51% 46.54% 593
winner / loser 20.14% / 27.54% 36.46% / 22.95% 43.40% / 49.51% 288 / 305 deserved winner / loser 21.66% / 23.30% 36.31% / 22.73% 42.04% / 53.98% 157 / 176 chance winner / loser 18.32% / 33.33% 36.64% / 23.26% 45.04% / 43.41% 131 / 129 Contribution=Average in t-1
overall 93.65% 3.17% 3.17% 63
winner / loser 96.67% / 90.91% 0% / 6.06% 3.33% / 3.03% 30 /33
deserved winner / loser 100% / 100% 0% / 0% 0% / 0% 20 / 22
chance winner / loser 90% / 72.73% 0% / 18.18% 10% / 9.09% 10 / 11 Contribution>Average in t-1
overall 44.61% 20.26% 35.13% 464
winner / loser 42.26% / 47.11% 25.52% / 14.67% 32.22% / 38.22% 239 / 225 deserved winner / loser 42.45% / 34.96% 29.5% / 8.13% 28.06% / 56.91% 139 / 123 chance winner / loser 42% / 61.76% 20% / 22.55% 38% / 15.69% 100 / 102
Table 2. Participants’ reaction to if their contribution was less / more than the group average in the previous round
that lost deservedly. In fact, in this case the relative frequency of those who increased contribution rises above 50%. However, even in those cases when somebody contributed less than the group average in the previous round (we expect that they would increase their contribution, see Table 1), even if she was in a group that won (which has a negative effect on contribution, according to Table 1) deservedly (again having a negative effect on contribution, see Table 1), increasing the contribution has the highest relative frequency, but in this case well below 50%.
If somebody contributed more than the average, then we expect that she would decrease her contribution according to conditional cooperation. As already commented, overall and also when considering being in a winner and loser group the relatively most frequent reaction is in line with this conjecture. We expected to see the strongest effect when a group wins deservedly (see Table 1), however, contrary to our conjecture, the relative frequency in that case is not the highest. We observe the highest share decreasing their contribution in case of those who were in groups that lost by chance.
The only case contradicting the idea of conditional cooperation occurs for those who contributed more than the group average in roundt-1 and were in a group that lost after accumulating less competition tokens than the rival group (deserved loser). In more than 50% of this case contributions increased, even if participants contributed already more than the group average in the previous round.
Chance losers tend to move toward the group average, independently if they contributed more or less than the group average, the effect being stronger in the latter case. Chance winners’ reaction is in line with conditional cooperation, as the most frequent reaction is to move towards the group average.
As a robustness check, we study how conclusions change if we consider contributing more / less than the average if it is at least +/- 20% than the average. Table 6 in S1 Appendix reveals that qualitatively we have the same findings.
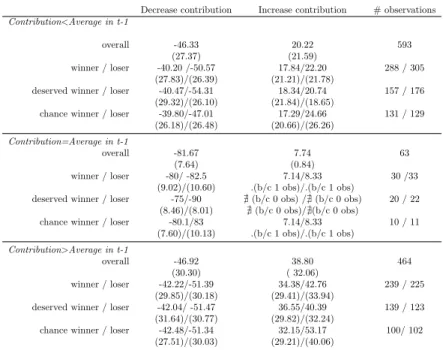
The idea of conditional contribution is directional in the sense that conditional contributors move toward the average contribution. For instance, both [4] and [8] define conditional contributors based on if an individual’s contribution increases (at least in a weakly monotonic way) in the other individuals’ contribution or using correlation measures between own and others’ contribution. However, it is also natural to ask how is the size of the moves toward the average. Hence, after seeing the direction of the changes, we turn now to the magnitudes. Table 3 provides information on the average size of the change in contribution joint with the standard deviation in each of the cases.
When considering the case of having contributed less than the group average in round
Decrease contribution Increase contribution # observations Contribution<Average in t-1
overall -46.33 20.22 593
(27.37) (21.59)
winner / loser -40.20 /-50.57 17.84/22.20 288 / 305
(27.83)/(26.39) (21.21)/(21.78)
deserved winner / loser -40.47/-54.31 18.34/20.74 157 / 176 (29.32)/(26.10) (21.84)/(18.65)
chance winner / loser -39.80/-47.01 17.29/24.66 131 / 129
(26.18)/(26.48) (20.66)/(26.26) Contribution=Average in t-1
overall -81.67 7.74 63
(7.64) (0.84)
winner / loser -80/ -82.5 7.14/8.33 30 /33
(9.02)/(10.60) .(b/c 1 obs)/.(b/c 1 obs)
deserved winner / loser -75/-90 @(b/c 0 obs) /@(b/c 0 obs) 20 / 22 (8.46)/(8.01) @(b/c 0 obs)/@(b/c 0 obs)
chance winner / loser -80.1/83 7.14/8.33 10 / 11
(7.60)/(10.13) .(b/c 1 obs)/.(b/c 1 obs) Contribution>Average in t-1
overall -46.92 38.80 464
(30.30) ( 32.06)
winner / loser -42.22/-51.39 34.38/42.76 239 / 225
(29.85)/(30.18) (29.41)/(33.94)
deserved winner / loser -42.04/ -51.47 36.55/40.39 139 / 123 (31.64)/(30.77) (29.82)/(32.24)
chance winner / loser -42.48/-51.34 32.15/53.17 100/ 102
(27.51)/(30.03) (29.21)/(40.06)
Table 3. Mean size of participants’ reaction to if their contribution was less / more than the group average in the previous round (Standard deviation in parentheses).
t-1, we see that size of change (in absolute value) is markedly higher for those who decreased their contribution. This is true overall and also if we condition on winning or losing and on doing so deservedly or by chance. Hence, while upon falling short of the group average in roundt-1 the share of those who increase their contribution in roundt is higher (and often by a wide margin) than the share of those who decrease, those in the latter group decrease much more their contribution on average than those who increase their contribution. This suggests that even if increasing contribution (the choice in line with the idea of conditional cooperation) is the most frequently observed reaction among those who contributed less than average in roundt-1, their impact on overall contribution may be neutralized by participants who decrease their contribution in the same condition due to the fact that in the latter group the size of the change is larger.
Turning to those who in round t-1 contributed more than the average, we observe that in this group those who decrease their contribution (in line with conditional cooperation), do so by a larger extent than those who increase their contribution. This happens in all cases, except for chance losers. Hence, for those contributing more than the average in the previous round, it is not just the share of those who decrease their contribution in the next round is higher, but also the size of their reaction is larger than the size of those who react in the opposite way.
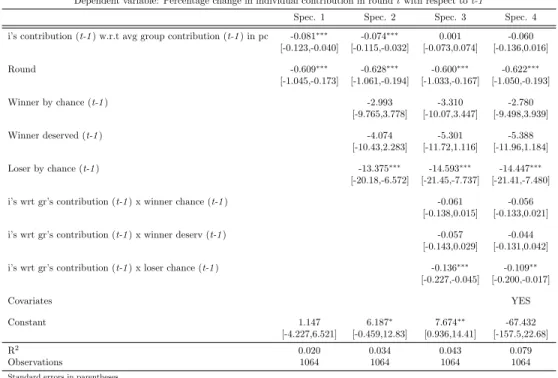
In order to see if conditional contribution plays a significant role in the participants’
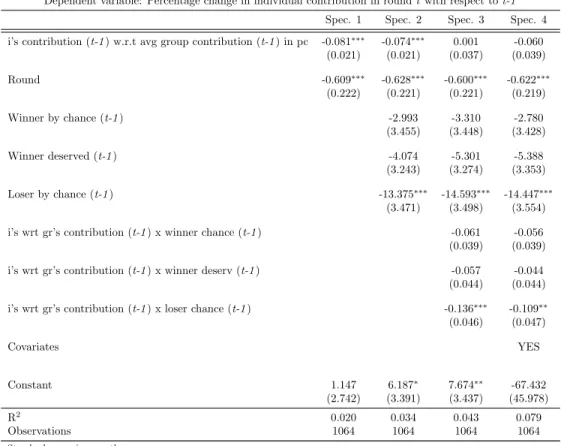
decisions, we carry out a random-effect linear panel regression (see Table 4), where we exploit the panel dimension of our dataset. Confidence intervals are provided in Table 7 (see S3 Appendix).
The dependent variable is the percentage change in individual contribution in round t with respect tot-1. Percentage change is computed as the percentage of variation with respect to the maximum possible variation. Since contribution is in the range of [0,1000], it implies, for instance, that after having contributed 800, changing to 400 is a -50% of variation and changing to 900 is a +50% of variation. We use percentage change
because there is a downward trend in contribution in our data, so a decrease of 100 tokens is not the same in relative terms at the beginning of the experiment as at the
Dependent variable: Percentage change in individual contribution in roundtwith respect tot-1 Spec. 1 Spec. 2 Spec. 3 Spec. 4 i’s contribution (t-1) w.r.t avg group contribution (t-1) in pc -0.081∗∗∗ -0.074∗∗∗ 0.001 -0.060
(0.021) (0.021) (0.037) (0.039)
Round -0.609∗∗∗ -0.628∗∗∗ -0.600∗∗∗ -0.622∗∗∗
(0.222) (0.221) (0.221) (0.219)
Winner by chance (t-1) -2.993 -3.310 -2.780
(3.455) (3.448) (3.428)
Winner deserved (t-1) -4.074 -5.301 -5.388
(3.243) (3.274) (3.353)
Loser by chance (t-1) -13.375∗∗∗ -14.593∗∗∗ -14.447∗∗∗
(3.471) (3.498) (3.554)
i’s wrt gr’s contribution (t-1) x winner chance (t-1) -0.061 -0.056
(0.039) (0.039)
i’s wrt gr’s contribution (t-1) x winner deserv (t-1) -0.057 -0.044
(0.044) (0.044) i’s wrt gr’s contribution (t-1) x loser chance (t-1) -0.136∗∗∗ -0.109∗∗
(0.046) (0.047)
Covariates YES
Constant 1.147 6.187∗ 7.674∗∗ -67.432
(2.742) (3.391) (3.437) (45.978)
R2 0.020 0.034 0.043 0.079
Observations 1064 1064 1064 1064
Standard errors in parentheses.
Random effects linear panel regression model.
Dependent variable normalized.
∗p <0.10,∗∗p <0.05,∗∗∗p <0.01
Table 4. Determinants of the percentage change in individual’s contribution int with respect tot-1. Random effects linear panel regression model.
end. In S2 Appendix we present evidence on the downward trend in contribution.
The explanatory variable of main interest is the individual contribution in roundt-1 relative to the average group contribution int-1 in percentage (measuring percentage as in the dependent variable), so here we are not only interested if an individual
contributed more or less than the group average int-1, but we also take into account the degree of deviation from the group average. In all specifications, we also control for round as the change in individual contribution may vary over time. In specification 2 we add the effect of losing or winning deservedly or by chance in the previous round, deserved loser being the baseline case. Note that subjects received information on whether their group had accumulated more competition tokens than the rival group and if they had won or lost, and therefore information on winning and losing and having done so deservedly or by chance was correlated. However, that information uniquely determined if the group had been a winner or a loser by chance or deservedly, and therefore the included dummy variables are orthogonal by construction. In specification 3 we also add interaction terms to see if the percentage change in individual
contribution fromt-1 to t is different based on winning or losing the contest after having accumulated more or less competition tokens than the rival group has a differential effect. In the last specification we also use controls related to
socio-demographics (female, age, academic degree, number of siblings, body mass index, digit ratio, breadwinner’s employment and participant’s work per week), IQ variables (being reflective or irreflective in the Cognitive Reflection test [43–45]) and the economic
preferences that we elicited in the questionnaire.
In specifications 1 and 2 the coefficient of the main explanatory variable is negative and significant, indicating that having contributed more (or less) than the group average in roundt-1 provokes a move in the opposite direction. We view it as strong evidence on conditional cooperation in contests. Round has always a negative and significant coefficient, showing a downward trend. In specification 2, we find that being in a group that loses by chance is the only group outcome that has a significant effect.
The estimated coefficient indicates that it reduces contribution change in 13 pp, relative to deserved loser groups, as conjectured (see Table 1). Contribution change after losing deservedly or winning (by chance or deservedly) is not statistically different, and higher than in the case of being in a group that loses by chance. In specification 3 we interact the group outcomes with the difference between own contribution and the average of the group in roundt-1. Note that contributing differently than the group average in round t-1, the explanatory variable of main interest is not significant any more, however the interaction between this variable and loser by chance is negative and is the only significant new variable. It indicates that the effect of differing from the group average is significantly different when the individual is in a group that loses by chance. These findings hold even if we add the remaining control variables (specification 4).
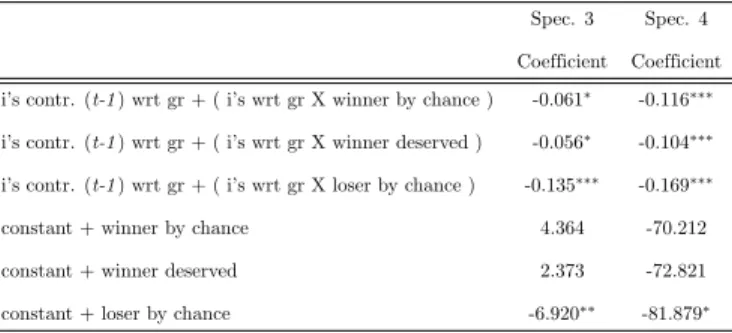
Spec. 3 Spec. 4 Coefficient Coefficient i’s contr. (t-1) wrt gr + ( i’s wrt gr X winner by chance ) -0.061∗ -0.116∗∗∗
i’s contr. (t-1) wrt gr + ( i’s wrt gr X winner deserved ) -0.056∗ -0.104∗∗∗
i’s contr. (t-1) wrt gr + ( i’s wrt gr X loser by chance ) -0.135∗∗∗ -0.169∗∗∗
constant + winner by chance 4.364 -70.212
constant + winner deserved 2.373 -72.821
constant + loser by chance -6.920∗∗ -81.879∗
∗p <0.10,∗∗p <0.05,∗∗∗p <0.01
Table 5. Testing when participants behave as predicted by conditional cooperation.
Specifications 3 and 4 allow us to understand how conditional cooperation depends
on the different elements of the environment. In order to check the occurrence of conditional cooperation, we test the combination of the relevant coefficients (see Table 5). We find that conditional contribution matters and participants significantly approximate their contribution to the group’s average if they belong to a winner group (either by chance or deservedly) or to a group that loses by chance. However, this effect vanishes (is not significant) in the baseline case, that is, when the group loses deservedly.
This is not surprising as we have seen that in that case participants tend to increase their contributions, independently of how their contributions relate to the average contribution in the previous round (see Table 2).
4 Conclusion
We report experimental evidence on conditional cooperation being present in group contests as overall the most frequent reaction to having contributed more (less) than the group average in the previous round is to decrease (increase) contribution. We also show that the outcome of the group contest also affects conditional cooperation. Conditional cooperation is not observed in the group contest after losing deservedly, however participants do approximate their behavior to the group’s average when being in a winner group or after losing by chance in the previous round. Hence, similarly to public goods game, we document the existence of conditional cooperation in group contest, except when being in a deserved loser group.
Supporting information
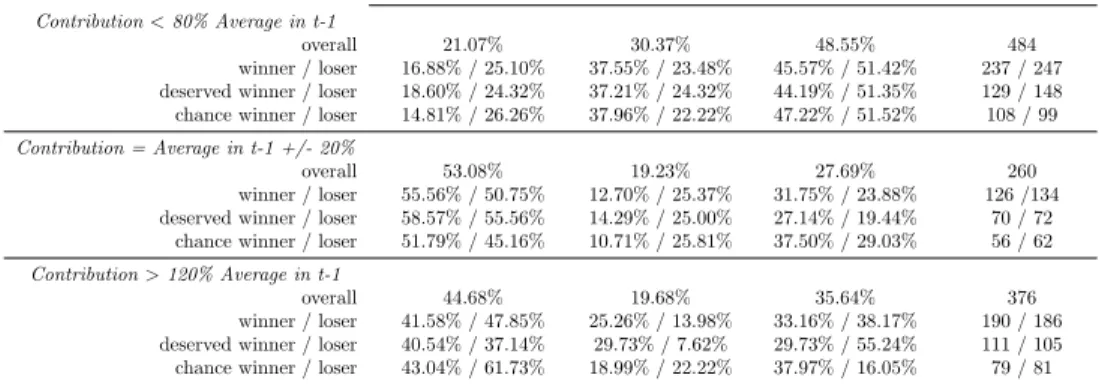
S1 Appendix. Supplementary material - Robustness check
Decrease contribution No change int Increase contribution # observations Contribution<80% Average in t-1
overall 21.07% 30.37% 48.55% 484
winner / loser 16.88% / 25.10% 37.55% / 23.48% 45.57% / 51.42% 237 / 247 deserved winner / loser 18.60% / 24.32% 37.21% / 24.32% 44.19% / 51.35% 129 / 148 chance winner / loser 14.81% / 26.26% 37.96% / 22.22% 47.22% / 51.52% 108 / 99 Contribution = Average in t-1 +/- 20%
overall 53.08% 19.23% 27.69% 260
winner / loser 55.56% / 50.75% 12.70% / 25.37% 31.75% / 23.88% 126 /134 deserved winner / loser 58.57% / 55.56% 14.29% / 25.00% 27.14% / 19.44% 70 / 72
chance winner / loser 51.79% / 45.16% 10.71% / 25.81% 37.50% / 29.03% 56 / 62 Contribution>120% Average in t-1
overall 44.68% 19.68% 35.64% 376
winner / loser 41.58% / 47.85% 25.26% / 13.98% 33.16% / 38.17% 190 / 186 deserved winner / loser 40.54% / 37.14% 29.73% / 7.62% 29.73% / 55.24% 111 / 105 chance winner / loser 43.04% / 61.73% 18.99% / 22.22% 37.97% / 16.05% 79 / 81
Table 6. Participants’ reaction to if their contribution was 20% less than the group average / group average +/- 20% / 20% more than the group average in the previous round
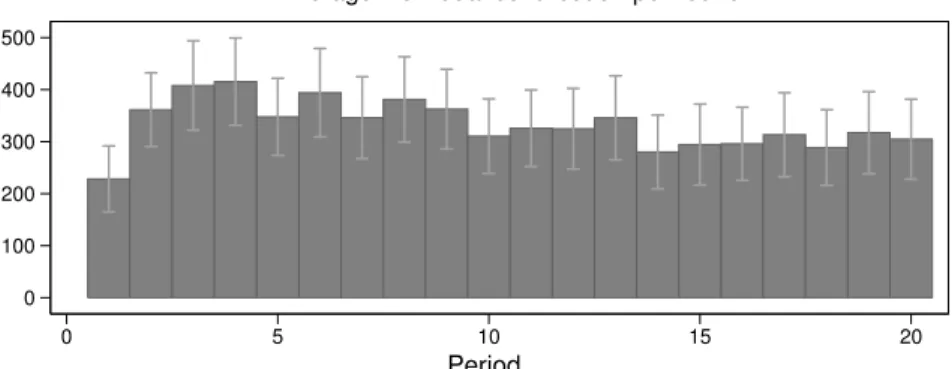
S2 Appendix. Supplementary material - Downward trend in contribution In Figure 2 we present the downward trend in contributions. Average contribution in round 1 is the only observation that does not fit into the general trend.
0 100 200 300 400 500
0 5 10 15 20
Period
Average individual contribution per round
Confidence intervals at 95%. N. obs. 56 in each round
Fig 2. Average individual contribution per round
In the first five rounds, the average contribution was equal to 353.3; for rounds 6 to 10 it was 371; for rounds 11 to 15 319.1, while in the last five rounds it equaled 303.8.
We see a downward trend. We look for the presence of a downward trend via a within-subject analysis by comparing decisions in the first and last five rounds. A statistically significant lower effort at 10 % in the last 5 rounds is found relative to the first 5 rounds (Wilcoxon signed-rank test, p-value= 0.085).
S3 Appendix. Table 7 is the analogue of Table 4, but we replace the standard errors with 95% confidence intervals.
Dependent variable: Percentage change in individual contribution in roundtwith respect tot-1
Spec. 1 Spec. 2 Spec. 3 Spec. 4
i’s contribution (t-1) w.r.t avg group contribution (t-1) in pc -0.081∗∗∗ -0.074∗∗∗ 0.001 -0.060 [-0.123,-0.040] [-0.115,-0.032] [-0.073,0.074] [-0.136,0.016]
Round -0.609∗∗∗ -0.628∗∗∗ -0.600∗∗∗ -0.622∗∗∗
[-1.045,-0.173] [-1.061,-0.194] [-1.033,-0.167] [-1.050,-0.193]
Winner by chance (t-1) -2.993 -3.310 -2.780
[-9.765,3.778] [-10.07,3.447] [-9.498,3.939]
Winner deserved (t-1) -4.074 -5.301 -5.388
[-10.43,2.283] [-11.72,1.116] [-11.96,1.184]
Loser by chance (t-1) -13.375∗∗∗ -14.593∗∗∗ -14.447∗∗∗
[-20.18,-6.572] [-21.45,-7.737] [-21.41,-7.480]
i’s wrt gr’s contribution (t-1) x winner chance (t-1) -0.061 -0.056
[-0.138,0.015] [-0.133,0.021]
i’s wrt gr’s contribution (t-1) x winner deserv (t-1) -0.057 -0.044
[-0.143,0.029] [-0.131,0.042]
i’s wrt gr’s contribution (t-1) x loser chance (t-1) -0.136∗∗∗ -0.109∗∗
[-0.227,-0.045] [-0.200,-0.017]
Covariates YES
Constant 1.147 6.187∗ 7.674∗∗ -67.432
[-4.227,6.521] [-0.459,12.83] [0.936,14.41] [-157.5,22.68]
R2 0.020 0.034 0.043 0.079
Observations 1064 1064 1064 1064
Standard errors in parentheses.
Random effects linear panel regression model.
Dependent variable normalized.
∗p <0.10,∗∗p <0.05,∗∗∗p <0.01
Table 7. Determinants of the percentage change in individual’s contribution int with respect tot-1. Random effects linear panel regression model.
S4 Appendix. Supplementary material - Instructions
The language of the instruction was Spanish as we ran the experiment in Spain.
Here we present the English version of the instructions. The instructions clarified the different tasks related to the Group Contest (Phase 1), Social Value Orientation (Phase 2), Public Goods game (Phase 3), Bomb Risk elicitation Task (Phase 4) and
Competitiveness (Phase 5), as well as the Questionnaire.
Welcome to the experiment
Welcome and thanks for participating in this experiment! Please, read carefully these instructions. The instructions are the same for all participants with whom you are going to interact during the experiment.
This is an experiment to study how individuals make decisions. We are interested in what individuals do on average.
Do not think that we expect any particular behavior from you. However, keep in mind that your behavior affects the amount of money that you may earn.
Next, you will see a series of instructions explaining how the experiment works and how you can use the computer during the experiment.
Please, do not either speak to or disturb the other participants during the
experiment. If you need help, raise your hand and wait quietly. You will be attended as soon as possible. From now on, no type of communication is allowed with other participants. Please, switch off your mobile phone. If you do not comply with the rules, you will be dismissed and you will not receive any compensation for your participation.
The structure of the experiment is the following:
PHASE 1
PHASE 2
PHASE 3
PHASE 4
PHASE 5
QUESTIONNAIRE
You will have to make decisions in all phases as we will explain during the experiment. All your decisions will be treated confidentially.
The final payoffs will be the sum of two payoffs. The first payoff is the one that you obtain in Phase 1 and the second payoff is the one that is picked randomly from the payoffs related to the rest of the phases.
We record the earnings during the experiment as tokens that will be converted into euros at an exchange rate that we specify in each phase. In all cases, more tokens imply more euros.
After finishing the 5 phases, you will be asked to fill in a questionnaire and then we will pay your earnings in euros in private.
Read carefully the following instructions in order to know what are the decisions that you are going to make and how you can earn money.
In this phase of the experiment you will be a member of a group composed of 4 persons in the room. These 4-person groups will be formed randomly by the computer.
You will not know the identities of the persons who are in your group, neither will they know your identity. Hence, identity of all members of the groups will remain
anonymous. From the 56 individuals in the room, 14 4-person groups will be formed.
This phase consists of 20 rounds.
Throughout this phase, your group will play against another group, so your group and the other group will form a pair of rival groups. You will be member of the same group during the 20 rounds and you will play against the same rival group in each of the 20 rounds. The game consists in that the rival groups compete for a prize, as we will explain it in detail now.
At the beginning of each round you will receive an individual endowment of 1000 tokens. You can use this individual endowment of 1000 tokens to buy ’competition tokens’ for the public account of your 4-person group. Each competition token costs 1 token of your individual endowment, hence you may buy at most 1000 competition tokens. The tokens of your individual endowment that you do not spend on buying competition tokens for the public account, will remain on your individual account.
Similarly, the other 3 members of your group will have an endowment of 1000 tokens that they can use to buy competition tokens for the public account of your 4-person group.
At the end of each round, when each individual in the room has chosen how many competition tokens to buy, a random process similar to a wheel of fortune determines which group (the group that you belong to or the rival group with whom your group competes) wins the prize. The prize is 4000 tokens. The probability of winning the prize depends on the amount of competition tokens that your group has and on the amount of competition tokens acquired by the rival group. More concretely, the following happens.
The ’wheel of fortune’ will be divided in two parts with different colors. One part of the wheel belongs to your group and the other part to the rival group. The size of the parts of the wheel represent exactly in a proportional way the amount of competition tokens acquired by your group and the rival group. For example, if your group and the rival group have acquired the same amount of tokens, then each group has 50% of the
’wheel of fortune’. If your group has acquired twice as many tokens as the rival group, then your group has two thirds of the wheel and the rival group has the remaining one third. Once the division of the wheel is determined by the competition tokens of the groups, the wheel starts to spin and stops randomly after a while. The wheel has an indicator in the position of 12 hours of a clock. The prize will be won by the group above whose color the indicator of the wheel is. Imagine that your group has acquired twice as many competition tokens than the other group and the color of your group is red, while the color of the rival group is blue. In this case, two thirds of the wheel will be red and one third blue. If after stopping the wheel the indicator is above a part of the wheel that is red, then your group wins the prize. However, if the indicator is above the blue part, then the prize goes to the rival group.
Therefore, the probability that your group wins the prize increases in the amount of competition tokens acquired by your group. In the same vein, the more tokens the rival group acquires, the higher is the probability that the rival group wins the prize. If one of the group does not acquire competition tokens, while the other group acquires tokens, then the group with the tokens wins with certainty. If none of the groups acquires tokens, the prize will be assigned randomly to one of the groups.
If your group wins the prize, then the 4000 tokens will be divided equally among the members of the group, independently of how many competition tokens each member of
the group bought. That is, if a group wins the prize, the members of the group will receive 1000 tokens. In this case, the total amount of tokens obtained in the round would be the tokens of your initial endowment not used to buy competition tokens and your share of the prize, 1000 tokens.
If your group does not win the contest, you will not receive anything from the prize.
In this case, your payoff in the round would be the initial endowment minus the tokens used to buy competition tokens.
Imagine that you use 350 tokens from your initial endowment of 1000 tokens to buy competition tokens. Suppose that your group wins the contest and obtains the prize. In this case, your payoff is (1000-350)+1000=1650 tokens in that round. Now assume that the other group wins the contest. Then your payoff in that round would be
1000-350=650 tokens. The numbers used in this example are fictitious.
The earnings will depend always on the amount of competition tokens that the members of the groups buy and on the result of spinning the wheel of fortune.
At the end of each round, after determining the winner of the contest, the earnings of the round will be computed.
Moreover, at the end of each round you will receive the following information:
your contribution to the common cause (that is, how many competition tokens you have bought);
the total contribution of your group (that is, the total number of competition tokens bought by the members of your group) ;
the total contribution of the rival group (that is, the total number of competition tokens bought by the members of the rival group);
if your group has won the contest or not;
your individual earning in the given round.
Your final earning in this phase of the experiment will be the sum of the earnings obtained in 5 randomly chosen rounds from the 20 rounds that you play in this phase.
The exchange rate in this phase of the experiment is the following:
1000 tokens = 1.2 Euros (that is, 1 token = 0.12 Euro cents).
For example, if you earn 5000 tokens then you will receive 6 Euros.
Phase 2
Read carefully the following instructions in order to know what are the decisions that you are going to make and how you can earn money.
In this phase of the experiment you will be paired with another person in the room, that is, you will be part of a two-person group. The two-person groups are formed randomly by the computer. You will not know the identity of the other person who will be in your group, neither will she / he know that you are the other member of the group. Hence, anonymity is maintained. The decisions that any individual of this room makes are anonymous as well.
This phase consists of 6 experimental rounds.
In each round you will see on the screen a sequence of 9 pairs of numbers. In each pair of numbers, one of the numbers is your payoff and the other number is the payoff of the other person of your group. Your task in this phase is to choose the pair of numbers that you prefer in each round.
Once everybody in the room has decided in each of the six rounds, we will proceed with the calculation of the payoffs of this phase of the experiment.
First, the computer chooses randomly one of the 6 rounds that we will use for the payoffs.
Once the payoff-relevant round is selected, the computer will pick randomly one of the persons in each group who will be the Elector.
There is a 50% chance that you will be the Elector and and a 50% chance that the other person in your group will be the Elector.
In this phase, the payoff of each person in the room will be the decision made by the Elector in the group in the round that has been selected for payoff.
The exchange rate in this phase of the experiment is the following:
1 token = 0.02 Euros (that is, 1 token = 2 Euro cents).
For example, if you earn 100 tokens, then you will receive 2 Euros.
Phase 3
Read carefully the following instructions in order to know what are the decisions that you are going to make and how you can earn money.
In this phase of the experiment you will be part of a 4-person group. The four-person groups are formed randomly by the computer. You will not know the identity of the other persons who will be in your group, neither will they know that you are a member of the group. Hence, anonymity is maintained. The decisions that any individual of this room makes when interacting with the other members of the her / his group are anonymous as well.
This phase consists of 1 experimental round.
At the beginning of the round everybody in the room will receive an endowment of 1000 tokens. Your task is to decide how much of your endowment to assign to the common account of the group. That is, you have to decide how many tokens of the 1000 that you have you want to contribute to an account that you share with the other members of your group. The other members of your group will make the same decision, that is how many tokens from the initial endowment they assign to the common account of your group.
Once everybody in the room has decided, we will proceed with the calculation of the payoffs of this phase of the experiment.
In this phase, the individual payoff of each member of the group depends on her / his decision, on the decisions of the other members of the group and on a multiplier. We will explain the payoff in detail:
Your earning = initial endowment - contribution to the common account + 0.4*
(common account of the group)
Pi= 1000−xi+ 0.4(x1+x2+x3+x4), where
Pi is the individual earning
1000 is the initial endowment
xi is your contribution to the common account
0.4 is the multiplier
x1+x2+x3+x4 is the sum of the contributions of each member of the group, that is the total of tokens accumulated in the common account of your group For example, if you contribute 250 tokens to the common account, while the total contribution is 800, then you earn (1000-250)+0.4*800=1070 tokens.
The exchange rate in this phase of the experiment is the following:
1 token = 0.002 Euros (that is, 1 token = 0.2 Euro cents).
For example, if you earn 500 tokens, then you will receive 1 Euro.
Phase 4
Read carefully the following instructions in order to know what are the decisions that you are going to make and how you can earn money.
In a store there are 100 boxes, numbered from 1 to 100. In one of the boxes there is a bomb. In the other 99 boxes there is money (each of them contains money). You do not know which box contains the bomb, but you know that it could be in any of the boxes with the same probability.
Your task in this phase is to choose how many boxes wou would take out from the store. The boxes are numbered and will be taken out in numerical order (starting with box 1). That is, if you want to take out 20 boxes, then the boxes numbered from 1 to 20 will be collected. If you want to take out 57 boxes, then the boxes from 1 to 57 will be collected.
Once everybody in the room has decided, we will proceed with the calculation of the payoffs of this phase of the experiment.
At the end of this phase, the computer will choose randomly a number between 1 and 100 to determine in which box the bomb is. If the bomb is in one of the boxes that you collected from the store, then you will earn nothing in this phase of the experiment.
However, if the bomb is not in the boxes that you took out of the store, then you may open the boxes and you will receive a token for each box.
Next, we will show some examples to illustrate how you can earn money in this phase:
Case A) Imagine that you decide to collect 7 boxes and the bomb is in the box 42.
Since you did not collect the box with the bomb, you earn a token for each of the 7 boxes that you collected, that is your earnings will be 7 x 1 token = 7 tokens.
Case B) Imagine that you decide to collect 35 boxes and the bomb is in the box 42.
Since you did not collect the box with the bomb, you earn a token for each of the 35 boxes that you collected, that is your earnings will be 35 x 1 token = 35 tokens.
Case C) Imagine that you decide to collect 52 boxes and the bomb is in the box 42.
Since you did collect the box with the bomb, you earn zero token in this phase.
Case D) Imagine that you decide to collect 68 boxes and the bomb is in the box 73.
Since you did not collect the box with the bomb, you earn a token for each of the 68 boxes that you collected, that is your earnings will be 68 x 1 token = 68 tokens.
Case E) Imagine that you decide to collect 10 boxes and the bomb is in the box 7.
Since you did collect the box with the bomb, you earn zero token in this phase.
The exchange rate in this phase of the experiment is the following:
1 token = 0.1 Euros (that is, 1 token = 10 Euro cents).
For example, if you earn 50 tokens, then you will receive 5 Euro.
Phase 5
Read carefully the following instructions in order to know what are the decisions that you are going to make and how you can earn money.
In this phase you will have to complete 4 tasks. None of these tasks will take more than 5 minutes. At the end of this phase, the computer will choose randomly one of the 4 tasks and you will receive your earnings based on your performance in that task. The computation of the earnings varies between tasks as we will inform you before starting each of the tasks.
Task 1
In Task 1, you will see on the screen a series of sliders that you have to work with during a minute. Each slider can be moved along the integer numbers going from 0 to 100. At the beginning of the task each slider is positioned at 0. Your task consists in moving as many sliders as you can in a minute to the number 50 with the help of the mouse. On the right hand side of each slider you will see the number at which the slider is positioned. You can use the mouse to readjust the position of the sliders as many times as you need.
If Task 1 is chosen for payment in this phase of the experiment, then you will receive 1 token for each slider positioned at the number 50. Your payoff will not decrease in the number of sliders not positioned at the number 50. That is, the payment depends on the number of sliders positioned at the number 50.
The exchange rate in this phase of the experiment is the following:
1 token = 0.15 Euros (that is, 1 token = 15 Euro cents).
For example, 20 tokens = 3 Euro.
Task 2
In this task you will have 1 minute to work with a set of sliders. This task, as the previous one, consists in positioning sliders at the number 50. However, in this task your earning depends on your performance in relation to the performance of the members of the group that you belong to. That is, your earning depends on the number of sliders positioned at the number 50 and the quantity of sliders that the other members of your group positioned at the number 50. Each group in the room will be formed by 4 individuals, so you will be in a group with 3 other persons in the room.
The person of the group that has the highest number of sliders positioned at the number 50 in a minute, will receive 4 tokens for each slider at the number 50, while the other members of the group will receive 0 token.
You will not be informed about your performance in this tournament until the end of this phase of the experiment. If there is a tie, the winner will be chosen randomly by the computer.
Remember that in this task the only one to win tokens and hence money is the one that positions the highest number of sliders correctly at the number 50.
The exchange rate in this phase of the experiment is the following:
1 token = 0.15 Euros (that is, 1 token = 15 Euro cents).
For example, 20 tokens = 3 Euro.
Task 3
In this task, you will have 1 minute to work with sliders. This task, as the previous ones, consists in positioning the sliders at the number 50. However, at the beginning of this task you will have to decide the way that you want to be paid, that is the way that we compute your earning.
If you choose piece-rate payment, then you will earn 1 token for each slider positioned at the number 50.
If you choose the tournament payment, then your performance in this task will be compared with the performance of the other members of your group in task 2. If the amount of sliders positioned at the number 50 is larger than that of the other members of your group, then you will receive 4 times more tokens per slider than in the piece-rate payment, that is 4 tokens for each slider positioned at the number 50. If in this task the number of sliders positioned at the number 50 is less than that of any of the members in
your group in task 2, then you will earn 0 token. We will not inform you about your performance in the tournament until the end of this phase. In case of a tie, the winner will be chosen randomly by the computer.
If you are the person in your group with the highest number of sliders positioned at the number 50, you will receive 4 tokens for each slider at the number 50, otherwise you will earn 0 token.
The exchange rate in this phase of the experiment is the following:
1 token = 0.15 Euros (that is, 1 token = 15 Euro cents).
For example, 20 tokens = 3 Euro.
Task 4
In this task you will not have to work with the sliders. Notwithstanding, you can obtain some additional earning for the amount of sliders positioned at the number 50 in task 1. You have to choose the way of payment that you would like to be applied to compute your earnings in task 1. You can choose the piece-rate payment or the tournament payment.
If this task, that is task 4, is chosen for payment in this phase of the experiment, then your earnings will be the following. If you chose the piece-rate payment, then you will earn 1 token for each slider positioned at the number 50 in task 1.
If you chose the tournament payment, then your earnings are determined in relation to the performance of the other members in your group in task 1. Each group in the room will be formed by 4 individuals, so you will be in a group with 3 other persons in the room. If the amount of sliders positioned at the number 50 in task 1 is larger than that of the other members of your group, then you will receive 4 times more tokens than in the piece-rate payment, that is, 4 tokens for each slider positioned at the number 50.
If the number of sliders positioned above the number 50 in task 1 is less than that of any of the members of your group in task 1, then you will receive 0 token. Hence, if you choose the tournament payment and you are the one in the group with the highest number of sliders positioned at the number 50, then you will earn 4 tokens for each slider at the number 50, otherwise you will earn 0 token.
In this task, you will see on the screen the amount of sliders that you positioned at the number 50 in task 1 and next you will have to select the way of payment.
The exchange rate in this phase of the experiment is the following:
1 token = 0.15 Euros (that is, 1 token = 15 Euro cents).
For example, 20 tokens = 3 Euro.
Additional questions
If you answer the next questions correctly, you can earn extra payment. These questions refer to your performance in the previous tasks, compared to those of the other participants.
In task 1, with the piece-rate payment, what do you think your performance was in relation to the other members in your group.
The best
The second best
The third best
The fourth
In task 2, with the tournament payment, what do you think your performance was in relation to the other members in your group.
The best
The second best
The third best
The fourth
For each correct answer, you will receive 7 tokens.
1 token = 0.15 Euros (that is, 1 token = 15 Euro cents).
Questionnaire
(The questionnaire contained questions about the sociodemographics, linguistic and cognitive abilities , and personality characteristics of the participants. The
questionnaire is available upon request.)
References
1. Ostrom E. Collective action and the evolution of social norms. Journal of Economic Perspectives. 2000;14(3):137–158.
2. Guttman JM. Matching behavior and collective action: Some experimental evidence. Journal of Economic Behavior & Organization. 1986;7(2):171–198.
3. Keser C, Van Winden F. Conditional cooperation and voluntary contributions to public goods. scandinavian Journal of Economics. 2000;102(1):23–39.
4. Fischbacher U, G¨achter S, Fehr E. Are people conditionally cooperative?
Evidence from a public goods experiment. Economics letters. 2001;71(3):397–404.
5. Croson R, Fatas E, Neugebauer T. Reciprocity, matching and conditional cooperation in two public goods games. Economics Letters. 2005;87(1):95–101.
6. Kocher MG, Cherry T, Kroll S, Netzer RJ, Sutter M. Conditional cooperation on three continents. Economics letters. 2008;101(3):175–178.
7. Fallucchi F, Luccasen RA, Turocy TL. Identifying discrete behavioural types: a re-analysis of public goods game contributions by hierarchical clustering. Journal of the Economic Science Association. 2019;5(2):238–254.
8. Th¨oni C, Volk S. Conditional cooperation: Review and refinement. Economics Letters. 2018;171:37–40.
9. Fern´andez Domingos E, Gruji´c J, Burguillo JC, Kirchsteiger G, Santos FC, Lenaerts T. Timing uncertainty in collective risk dilemmas encourages group reciprocation and polarization arXiv preprint arXiv:2003.07317.2020.
10. Konrad KA, et al. Strategy and dynamics in contests. OUP Catalogue. 2009;.
11. Flamand S, Troumpounis O, et al. Prize-sharing rules in collective rent seeking.
Companion to political economy of rent seeking, London: Edward Elgar. 2015; p.
92–112.
12. Gavrilets S. Collective action problem in heterogeneous groups. Philosophical Transactions of the Royal Society B: Biological Sciences.
2015;370(1683):20150016.
13. Sheremeta RM. Behavior in group contests: A review of experimental research.
Journal of Economic Surveys. 2018;32(3):683–704.
14. Abbink K, Brandts J, Herrmann B, Orzen, H. Intergroup conflict and intra-group punishment in an experimental contest game. American Economic Review.
2010;100(1):420–478.
15. Bhattacharya P. Inter-team contests with power differential. Journal of Economic Behavior & Organization. 2016;132:157–175.
16. Brookins P, Lightle JP, Ryvkin D. experimental study of sorting in group contests Labour Economics. 2015;135:16–25.
17. Chowdhury SM, Jeon JY, Ramalingam A. Identity and group conflict. European Economic Review. 2016;19:107–121.
18. Eisenkopf G. The impact of management incentives in intergroup contests European Economic Review.2014;67:42–61.