MŰHELYTANULMÁNYOK DISCUSSION PAPERS
INSTITUTE OF ECONOMICS, CENTRE FOR ECONOMIC AND REGIONAL STUDIES, HUNGARIAN ACADEMY OF SCIENCES - BUDAPEST, 2019
MT-DP – 2019/11
Coopetition in group contest
HUBERT J. KISS ALFONSO ROSA-GARCIA
VITA ZHUKOVA
Discussion papers MT-DP – 2019/11
Institute of Economics, Centre for Economic and Regional Studies, Hungarian Academy of Sciences
KTI/IE Discussion Papers are circulated to promote discussion and provoque comments.
Any references to discussion papers should clearly state that the paper is preliminary.
Materials published in this series may subject to further publication.
Coopetition in group contest
Authors:
Hubert J. Kiss senior research fellow
Centre for Economic and Regional Studies Hungarian Academy of Sciences
and Department of Economics, Eötvös Loránd University kiss.hubert.janos@krtk.mta.hu
Alfonso Rosa-Garcia
Department of Business, Universidad Católica San Antonio de Murcia arosa@ucam.edu
Vita Zhukova
Department of Business, Universidad Católica San Antonio de Murcia vzhukova@ucam.edu
April 2019
Coopetition in group contest
Hubert János Kiss - Alfonso Rosa-Garcia - Vita Zhukova
Abstract
There are situations in which competitors ally to pursue a common objective.
This simultaneous presence of cooperation and competition is called coopetition and we study it theoretically and experimentally in a group contest setup.
More concretely, we analyze a group contest with a new sharing rule, that we call inverse proportional. This rule embodies the idea that the more a member of a group contributes to win the contest, the less this member is able to capture the potential posterior prize, introducing thus a competitive element into group decision-making. We compare the effects of this rule with a standard, the egalitarian sharing rule. While in the egalitarian case theoretically the optimal individual contribution is positive, with the inverse proportional rule zero contribution represents the individual (and also the social) optimum. We find that participants in our experiment contribute more with the egalitarian than with the inverse proportional rule. We also document over-expenditure with the inverse proportional sharing rule, suggesting that group contest generates inefficient behavior even when individuals are extremely penalized for their contributions. We also explore the drivers of decision in the group contest, and find that contribution in a public goods game is positively associated with contribution in the group contest and that competitiveness explains part of the behavior with the inverse proportional rule but not with the egalitarian sharing. Neither social value orientation, risk attitudes, nor personal traits appear as significant predictors of behavior.
Keywords: competitiveness, egalitarian sharing rule, group contest, inverse proportional sharing rule, public goods game, risk attitudes, social value orientation
JEL classification: C72, C92, D70; D72, H41
Koopetíció csoportos versenyben
Kiss Hubert János - Alfonso Rosa-Garcia - Vita Zhukova
Összefoglaló
Vannak olyan helyzetek, amelyekben versenytársak összefognak egy közös cél érdekében.
Az együttműködés és a verseny egyidejű jelenlétét koopetíciónak hívják. Mi ezt a jelenséget tanulmányozzuk elméletileg és egy kísérlet segítségével csoportos versenykörnyezetben.
Pontosabban, csoportos versenyt elemzünk egy új felosztási szabály jelenlétében, amit fordítottan arányosnak nevezünk. Ez a szabály azt az ötletet testesíti meg, hogy minél többel járul hozzá egy csoporttag a verseny megnyeréséhez, annál kisebb szeletet képes megkaparintani a potenciálisan elnyerhető díjból. Összehasonlítjuk ezen szabály hatását a standard egyenlő felosztási szabállyal. Míg az egyenlő felosztás mellett elméletileg az egyéni optimum pozitív hozzájárulási szinttel jár együtt, a fordítottan arányos felosztás mellett a zéró hozzájárulás az egyéni (és egyben a társadalmi) optimum. Azt találjuk, hogy a kísérletben a résztvevők valóban magasabb hozzájárulásokat tesznek az egyenlő felosztás mellett. Azt is látjuk, hogy a fordítottan arányos felosztás mellett is megfigyelhető a túlköltekezés (over-expenditure) jelensége, azt sugallva, hogy a csoportos verseny még akkor sem vezet hatékony viselkedésre, ha az egyéneknek nagyon nem éri meg pozitív hozzájárulásokat tenni. A csoportos versenyben hozott döntések mozgatóira is kíváncsiak vagyunk és azt találjuk, hogy a közjószág-játékban tett hozzájárulások pozitívan korrelálnak a csoportos versenyben tett hozzájárulásokkal, továbbá a versengési hajlamnak is van magyarázó ereje, azonban csak a fordítottan arányos felosztás mellett. Sem a társas érték szerinti orientáció (social value orientation), sem a kockázati attitűdök, sem egyéb személyiségjegyek nem magyarázzák számottevő mértékben a döntéseket.
Tárgyszavak: csoportos verseny, egyenlő felosztás, fordítottan arányos felosztás, kockázati attitűdök, közjószág-játék, társas érték szerinti orientáció, versengési hajlam.
JEL kódok: C72, C92, D70; D72, H41
Coopetition in group contest
Hubert J´anos Kissa, Alfonso Rosa-Garciab, Vita Zhukovac
aMTA KRTK KTI and E¨otv¨os Lor´and University
1097 Budapest, T´oth K´alm´an u. 4. and 1117 Budapest, P´azm´any s´et´any 1/a, Hungary.
bDepartment of Business, Universidad Cat´olica San Antonio de Murcia Campus de Los Jer´onimos, s/n, Guadalupe 30107, Murcia, Spain.
cDepartment of Business, Universidad Cat´olica San Antonio de Murcia Campus de Los Jer´onimos, s/n, Guadalupe 30107, Murcia, Spain.
Abstract
There are situations in which competitors ally to pursue a common objective.
This simultaneous presence of cooperation and competition is called coope- tition and we study it theoretically and experimentally in a group contest setup. More concretely, we analyze a group contest with a new sharing rule, that we call inverse proportional. This rule embodies the idea that the more a member of a group contributes to win the contest, the less this member is able to capture the potential posterior prize, introducing thus a competi- tive element into group decision-making. We compare the effects of this rule with a standard, the egalitarian sharing rule. While in the egalitarian case theoretically the optimal individual contribution is positive, with the inverse proportional rule zero contribution represents the individual (and also the so- cial) optimum. We find that participants in our experiment contribute more with the egalitarian than with the inverse proportional rule. We also docu- ment over-expenditure with the inverse proportional sharing rule, suggesting that group contest generates inefficient behavior even when individuals are extremely penalized for their contributions. We also explore the drivers of decision in the group contest, and find that contribution in a public goods game is positively associated with contribution in the group contest and that competitiveness explains part of the behavior with the inverse proportional rule but not with the egalitarian sharing. Neither social value orientation, risk attitudes, nor personal traits appear as significant predictors of behavior.
Keywords: competitiveness, egalitarian sharing rule, group contest, inverse proportional sharing rule, public goods game, risk attitudes, social value orientation
JEL: code, C72, C92, D70, D72, H41 1. Introduction
Group contests are pervasive, including rent-seeking and lobbying, inno- vation tournaments and R&D races or sports competitions. A recent liter- ature investigates the nature of cooperation among the group members in these contests. However, in many of these situations, members of groups are not just cooperating in order to achieve the common goal, but they are indeed competitors with opposite interests, once the prize is obtained. Cooperation and competition are two of the most studied phenomena in Economics and in many occasions both are present simultaneously, a situation termed as coopetition. In this work, we study for the first time coopetition in the group contest setup.
Consider two examples of coopetition in group contest. In cycling races, in many cases two or more cyclist break away from the peloton. To maintain their distance to the following peloton the cyclists who escaped have to coop- erate, meaning that all of them have to be in front and pull (that is, to take the lead) that requires a lot of effort as the leader has to struggle more with air resistance than the followers who are sheltered from wind.1 On the other hand, these cyclists also compete because each of them wants to win the com- petition and arrive first at the finish line. To win, they need to economize on efforts so they are interested in less cooperation (that is, less pulling). The more cooperative a cyclist is, the more likely it is that the escape is successful and they arrive first to the finish line, but at the same time more cooperation decreases his chance of winning the race. As a second example, consider a set of firms, that cooperate in R&D to develop some technology, but then compete for customers. The high-definition optical disc format competition is a suitable illustration. As HDTV televisions became popular in the mid- 2000s, a need emerged for an inexpensive storage medium capable of holding large amounts of data for HD video. Nine leading electronic companies (e.g.
Sony, Panasonic, Samsung) founded Blu-ray Disc Association, an industry consortium with the aim of developing and licensing Blu-ray Disc technology and promoting business opportunities for this standard. A similar associa-
1Aerodynamic drag can be reduced up to 50% for cyclist that are not in front (see Blocken et al., 2018, and references therein).
tion arose led by Toshiba (that, for instance, included Sanyo) and which was also supported by Microsoft to promote a competing format called HD DVD.
Members of both associations cooperated in the development of the format (the prize being that the format becomes the accepted standard to be used all over the world), but then competed to sell players compatible with the given format to customers. Firms in such consortia dedicate part of their own resources to the development of the standard while they still have to com- pete for customers against their allies in the consortium. These firms face therefore a trade-off between using their resources to increase the probability of winning the format war or to increase the probability of capturing a larger share of the market. These situations where competitors cooperate to de- feat another group of competitors are also present for instance in the case of chambers of commerce and federations of entrepreneurs or enterprises, where firms that cooperate to pursue a common goal are possibly competing for the same customers. Schemes of protected designation of origin which promote and protect names of quality agricultural products of a given region are also examples of coopetition. For instance, producers of gorgonzola or prosciutto cooperate to make the special produce attractive to as many customers as possible, but then the individual producers compete to serve the increased market that has been generated through the cooperation.
All these situations have the common characteristic that a cooperative behavior is needed to achieve a goal as a group but at the same time it lowers the resources / capacity to compete. We explore behavior in these coopetitive environments using the well-studied group contest setup. In group contests several groups compete to obtain a prize. To put simply, the group whose members make the most effort has the greatest probability to win the prize.
In the extant literature on group contest, the prize is typically split up either with an egalitarian (everybody in the winning group receiving the same share of the prize) or with a proportional (members of the winner group receiving a share that is proportional to their contribution to the group effort) rule. In this paper, we introduce a new sharing rule that we terminverse proportional, expressing the idea that the less a member of the winning group contributed to the group effort to win the prize, the (proportionally) higher share she receives from the prize. Inverse proportionality captures the trade off faced in coopetitive setups: the more an agent spends on cooperation, the less resource she has to obtain a higher share from the prize (if her group wins it). Note that competition is present at two levels. At the group level, each member of the group is interested in defeating the other group, hence in a
high overall effort, while at the individual level, each individual is interested in capturing a higher share of the prize, hence in a low individual effort. In our previous examples, cyclists in the leading group are interested that there is always somebody who takes the lead and pulls to maintain the distance to the peloton, while the group of firms favouring a special format is interested to make it dominant in the market, but at the same time cyclists and firms want to defeat also the other members of their group by economizing resources spent on cooperation.2
The group contest literature has consistently found overexpenditure in these situations. In particular, it has been found that under the egalitarian rule individuals contribute much more than the positive contribution that the Nash equilibrium of the game predicts. Even though a declining pattern of contributions is observed when the game is repeated, even after several repe- titions over-expenditure persists. It suggests that the group contest structure generates this over-expenditure. To test if this is the case, we study how the inverse sharing rule affects behavior. The theoretical analysis of group contest with an inverse proportional sharing rule shows that individuals maximize their payoff making a zero contribution to the group performance. Moreover, zero contribution is also the social optimum. This is a strong prediction that we test in the laboratory, analyzing both if this different sharing rule has an effect on contribution as well as if over-expenditure remains even in the extreme case where zero contribution is always optimal from an individual point of view. In two sessions, both with 14 four-member groups, we in- vestigate behavior in group contest with egalitarian and inverse proportional sharing rule. Moreover, after the group contest we have the participants play additional games to measure their social attitude, risk preferences, coopera- tiveness and competitiveness, as well as an extensive questionnaire capturing personal traits. Our aim with these games and tasks is to better understand what drives choices in the group contest, and well as what drives differences in behaviors between cooperative and coopetitive environments.
We find a sizable and significant difference in efforts, contributions being much lower under the inverse proportional rule, as expected. We also report over-expenditure with the inverse sharing rule, although zero contribution is
2Bouncken et al. (2015) claim that ”While coopetition may combine the best of both worlds of cooperation and competition, there is still an inherent paradox, given the possible tension between value creation and capture.” Our sharing rules represent different degrees of this inherent tension.
always individually optimal. When relating behavior in contest with other situations, we find that contributions in a public good game are positively associated with contribution in the contest, independently of the sharing rule.
Competitiveness, measured ´a la Niederle and Vesterlund (2007) explains part of the behavior in the coopetitive environment, but not in the cooperative one. Finally, we do not find any effect of neither social value orientation, risk aversion nor personality traits which seem to have no role in explaining behavior in these environments.
1.1. Literature review
In this section, first we briefly speak about the coopetition literature in management, then we review the main findings of the group contest litera- ture that is related to our theoretical predictions and the role of members’
heterogeneity in contribution in the framework of group contests.3 1.1.1. Coopetition in management
There is a vast literature in management on coopetition, so we briefly review the main findings that are related to our paper.4 In the management literature, coopetition has been described and analyzed in many industries and services, such as petrochemicals (e.g. Tsai, 2002), retailing (e.g. Kotzab and Teller, 2003; Martinelli and Sparks, 2003), maritime logistics (e.g. Song and Lee, 2012), engineering and technology (e.g. Carayannis and Alexander, 2001; Carf`ı and Schilir`o, 2012; Chin et al., 2008; Gnyawali and Park, 2009;
Gueguen, 2009; Quintana-Garcia and Benavides-Velasco, 2004; Shih et al., 2006; Salvetat and G´eraudel, 2012), transportation (e.g. Gwynne, 2009; Lin et al., 2017), finance and insurance (e.g. Czakon et al., 2009; Okura, 2007), tourism (e.g. von Friedrichs Gr¨angsj¨o, 2003; Wang and Krakover, 2008), health care (e.g. Peng and Bourne, 2009).
Bouncken et al. (2015) lists the following motives to pursue coopetition:
to gain market power (e.g. Gnyawali and Park, 2011; Ritala et al., 2009;
Rusko, 2011), to foster innovation (Brolos, 2009; Ritala and Hurmelinna- Laukkanen, 2009), to promote supply chains (e.g. Bakshi and Kleindorfer, 2009; Wilhelm and Kohlbacher, 2011) and as a strategy in global competition (e.g. Luo, 2007; Gnyawali and Park, 2011). Therefore, these motives can be
3Henceforth, we use effort and contribution in an interchangeable manner.
4Bengtsson and Kock (2014); Bouncken et al. (2015); Dorn et al. (2016); Walley (2007) are good surveys about this literature.
seen as the goals of the group. The benefit of coopetition may be win- win situations in which the parties involved end up with lower costs. Dorn et al. (2016) find that coopetition is more likely to arise in industries that are at a very early or mature stage of the market lifecycle. The major risk of coopetition according to this literature is opportunistic behavior Levy et al. (2003); Baumard et al. (2009); Bouncken and Kraus (2013); Pellegrin- Boucher et al. (2013); Cassiman et al. (2009).
Related to the benefits and risks of coopetition, a recurring topic in the management literature on coopetition is the inherent tension between coop- eration and competiton. The first one requires a friendly mindset, while the latter provokes a hostile attitude, two strongly opposing logics (e.g. Bello et al., 2010; Bunge, 1989; Das and Teng, 2000). Many studies emphasize the importance of balancing competition and cooperation (e.g. Bengtsson and Kock, 2000; Cassiman et al., 2009; Das and Teng, 2000; Osarenkhoe, 2010), but little is known on how an optimal balance can be achieved. Park et al.
(2014) find that moderately high competition and high cooperation repre- sents an optimal coopetition balance. Our findings clearly suggest that our setup with the inverse proportional sharing rule generates too much compe- tition that leads to a lower cooperation level than the egalitarian rule.
The management literature distinguishes different levels of coopetition.
Thus, coopetition may take place on the individual level (e.g. Enberg, 2012), within the firm (for instance Tsai, 2002; Luo et al., 2006) or on a team level (e.g. Baruch and Lin, 2012; Ghobadi and D’Ambra, 2012), between firms (for example Bouncken and Kraus, 2013; Quintana-Garcia and Benavides- Velasco, 2004) or on a network level (e.g. Peng and Bourne, 2009; Mantena and Saha, 2012). Note that our motivating examples and the idea behind our study is a combination of the different levels. It is not simply that groups compete and cooperate at the same time, but there is also a within- group competition going on. Combining intrafirm coopetition with interfirm competition would yield such a scenario, but we are not aware of any analysis that investigates such a setup.
Related to the management literature on coopetition, using classic exper- imental games Devetag (2009) studies how coordination and trust may affect coopetitive processes, while Rossi and Warglien (2009) investigate how fair- ness and reciprocity determine coopetition in a firm. Lacomba et al. (2011) study experimentally coopetition on the individual level, using the repeated prisoner’s dilemma game. Thus, there is some experimental work on coope- tition, but they do not study on a group level and use different games.
1.1.2. Over-expenditure of effort
A general finding in the group contest literature both in the field (e.g.
Erev et al., 1993) and in the laboratory (e.g. Nalbantian and Schotter, 1997; Van Dijk et al., 2001) is that with proportional or egalitarian sharing rule contests between groups lead to high individual effort and little free- riding. More recent experimental studies (Abbink et al., 2010; Ahn et al., 2011; Cason et al., 2012, 2017; Leibbrandt and S¨a¨aksvuori, 2012; Ke et al., 2013, 2015; Eisenkopf, 2014; Sheremeta, 2011; Brookins et al., 2015; Bhat- tacharya, 2016; Chowdhury et al., 2016) also consistently find that average effort level (though often showing a declining pattern) is significantly higher than the equilibirum prediction. Sheremeta (2013) reports based on 30 stud- ies that the median over-expenditure is 72%. Several explanations for the over-expenditure of effort have been proposed. Sheremeta (2010); Price and Sheremeta (2011, 2015); Cason et al. (2018) show that the pure joy of win- ning may explain part of the over-expenditure. Bounded rationality (Falluc- chi et al., 2013; Chowdhury et al., 2014; Lim et al., 2014) and relative payoff maximization (Mago et al., 2016) also have some explanatory power when we try to understand over-expenditure. Sheremeta (2018a) shows that indi- vidual characteristics (impulsiveness and cognitive abilities) may also affect expenditure on effort.
A different set of explanations involve social preferences. More concretely, in social dilemma and collective action games, participants often contribute more to the public account than predicted by standard game theory based on the idea of homo economicus, (see, for instance Chaudhuri, 2011). Theories based on social preferences like altruism (e.g. Andreoni, 1990), fairness (e.g.
Rabin, 1993) or inequality aversion (e.g. Fehr and Schmidt, 1999; Bolton and Ockenfels, 2000) offer potential explanation for such behavior and it is natural to think that such social preferences may be at work towards other members of the group.5 Relatedly, social identity theory (Tajfel and Turner, 1979) that proposes that a strong group identity may blur the differences between individual and group interests is another potential explanation. Chowdhury et al. (2016) provides experimental evidence that social identity is in fact
5A related explanation (called parochial altruism) goes further and besides altruism toward in-group members claims the existence of hostility toward members of the rival group. However, such hostility toward out-group subjects is not very common (Halevy et al., 2008; Yamagishi and Mifune, 2016; Abbink et al., 2012).
important to understand the effort level that players choose in group contest.
Our contribution to this issue is to see if over-expenditure holds with the inverse proportional sharing rule.
1.1.3. Heterogeneity in behavior
While the theoretical predictions are based on symmetry, in real life in- dividuals differ in a myriad of ways that may affect their behavior. In most experimental studies on group contest some degree of heterogeneous behav- ior can be observed. For instance in Abbink et al. (2010), on average, the most contributing group member expends three times more effort than the least contributing member.6 We do not only observe heterogeneity on the individual level, but also on the group level. In Abbink et al. (2010), for in- stance, the most competitive group made six times more effort than the least competitive group. Note that this difference is substantially higher than the individual difference, so individual heterogeneity is probably not enough to explain these group-level differences. Parochial altruism and social identity theory are natural candidates for explaining at least partially the differences.
Besides the principal aim to see if behavior is different under the egali- tarian and the inverse proportional rule, another objective of this study is to investigate which individual characteristics and to which extent associate with differences in individual behavior. Sheremeta (2018a) pursues the same goal studying individual contests. He elicits loss and risk aversion, cognitive abilities and impulsiveness. He shows that cognitive abilities affect overbid- ding, but impulsiveness has an even larger predictive power.
2. Model
We present briefly the structure of group contest, relying heavily on the survey by Sheremeta (2018b).7 There are two groups that compete to win a contest and receive a prize υ. There are NA / NB players in group A / B. Players in both groups choose simultaneously and independently a level of effort xiA and xjB that is irreversible and the effort entails heterogeneous
6Theoretically, the existence of asymmetric equilibria may explain why we observe different levels of effort, (see, for instance Baik, 1993, 1994).
7Konrad et al. (2009); Flamand et al. (2015); Gavrilets (2015) also provide a nice introduction to the theory of group contest.
costs ciA(xiA) and cjB(xjB), for all i = 1, ..., NA and j = 1, ..., NB. In our experiment groups are composed by four individuals (NA = NB = 4).
The performance of group A / B, denoted as XA / XB is a function of all individual efforts within the given group. For instance, for group A
XA=fA(x1A, ...x1NA) (1) The most widely used function in the literature assumes perfect substitution
fA(x1A, ...x1NA) =
NA
X
i=1
xiA. (2)
This function describes nicely real-life situations in which the performance of the group hinges on the joint effort of all individuals of the group.8 We also use this perfect-substitute function in both treatments. As of costs of effort, for simplicity we assume homogeneous linear costs, that is ciA(x) = cjB(x) = x for all i= 1, ..., NA and j = 1, ..., NB.
The probability of winning the contest depends on the relative perfor- mance of the groups. A contest success function (CSF) determines the prob- ability that group A wins the prize:
pA(XA, XB) = (XA)r
(XA)r+ (XB)r (3)
The parameter r≥0 represents the sensitivity of the probability of winning to the ratio of group performances. One of the most used CSF is when r = 1. In this case (often called the lottery case) higher performance implies linearly higher winning probabilities. We use also the lottery CSF in both of our treatments.9
Up to this point we follow the literature and use a known performance functions and CSF parameter. Our main modification is in the way the prize is split. In the literature, a general way to capture the division of the prize is the following. In the case group A wins the prize, player i receives a share of the prize which is defined by the following sharing rule (e.g. Nitzan, 1991)
siA(x1A, ...xNAA) = αA
NA + (1−αA) xiA PNA
i=1xiA. (4)
8When group performance depends on the best / worst performer within the group, then other functions are more suitable.
9An alternative and often used possibility is the auction case (r=∞), when the group with the highest performance wins the contest with certainty.
In words, share αA of the prize is split equally among all members of the winning group, and the rest (1−αA) is divided according to relative effort.
Complete egalitarian division occurs if αA = 1, while if αA = 0, then the prize is split completely in proportion to relative effort. In our egalitarian treatment we use the complete egalitarian division, corresponding toαA= 1.
For the other treatment, we propose a new sharing rule that states that the share of the prize that a member receives is inversely proportional to relative effort. More concretely, the less effort a member makes, the more she receives proportionally from the prize. We define the inverse proportional share in the following way:
siA(x1A, ...xNAA) =
1 xiA
P 1
xiA
if xiA >0, siA(x1A, ...xNAA) = card(x1
iA=0) if xi = 0 and P 1
xiA >0, (5)
where card(xiA = 0) denotes the cardinality of players in group A who contributed zero. In words, when player i in group A contributes a positive amount then she receives the inverse proportional share. However, forxiA = 0 the expression is not well-defined, but by the logic of the sharing rule, in that case player i receives all the prize if the other members of the group contributed a positive amount, and shares the prize equally with those who also contributed zero. If nobody contributes (P 1
xiA = 0) and the group wins the contest (in the very unlikely case when nobody contributes in the rival group either and the prize is allocated randomly to one of the groups), then the prize is split equally.
To illustrate the effect of sharing rules consider the following example.
Suppose a group with subjects A,B,C and D who made the following efforts 1,2,4 and 4, respectively. In the egalitarian treatment, upon winning the contest all of the members would receive 14 of the prize. However, the inverse proportional rule gives four / two times as much share from the prize to subject A / B, than to subjects C and D who receive the same share. The formula above yields the following shares: 12, 14, 18 and 18 respectively to subjects A, B, C and D.
Given perfect substitution in the performance function, homogeneous linear costs, a lottery contest success function (r = 1), equal group sizes
(NA = NB = N) and the egalitarian sharing rule, the expected payoff of a risk-neutral player i in group A can be written as:
πiA(x1A, ...xN A, XB) =
PN i=1xiA
(PN
i=1xiA+PN j=1xjB)
1
Nυ−xiA (6) The first term of the expected payoff represents the expected benefit of contributing effort xiA. Higher effort of player i in group A increases the probability of group A winning the contest, but yields the same share of the prize (N1) for all members of group A (if this group wins the contest). Cost is captured by the second term. Hence, there is an inherent tension, because player i has an incentive to cooperate with other members of his group, but given the cost of cooperation, there is also an incentive to free ride.
In the unique symmetric Nash equilibrium with the egalitarian sharing rule,
x∗1A=..=x∗iA =..=x∗N A = υ
4N2. (7)
Appendix A.1 contains the details of the proof following the line of reasoning by Katz et al. (1990).
If we use the inverse proportional sharing rule, then the expected payoff of a risk-neutral player i in group A can be written as:
πiA(x1A, ...xN A, XB) =
PN i=1xiA
(PN
i=1xiA+PN j=1xjB)
1 x1A
P 1
x1A
υ−xiA (8) On the other hand, the unique Nash equilibrium under the inverse pro- portional sharing rule implies:
x∗1A=..=x∗iA =..=x∗N A= 0. (9) In Appendix A.2 we show that given this rule, zero effort is the dominant strategy for each individual, so in the unique Nash equilibrium members of the group contribute zero. Note that under this rule, the Nash equilibrium in dominant strategies coincides with the socially efficient outcome: since there is a fixed prize in the contest, it is socially efficient not to contribute anything. While this efficient outcome is common in group contests, inverse proportional sharing rule is the only one in which individual and social optima coincide.
The previous predictions are based on the following assumptions: i) play- ers have identical valuations about the payoffs and winning the contest; ii) players maximize their individual utility without regard to the team’s inter- est; and iii) players are risk-neutral. Hence, deviations from the predictions may be due (at least partly) to the fact that these assumptions do not hold.
3. Hypotheses
Over-expenditure of effort and heterogeneity of behavior can be affected by the structure of the game. Therefore, group size, the group performance function or the contest success function can influence how subjects behave in group contest. In this study we focus on the role of the sharing rule and on individual heterogeneity.
Prior to running the experiment, we registered it at the Open Science Foundation (https://osf.io/93aus/). Next, we state the hypotheses as we registered them and provide support for formulating those hypotheses based on the literature. Our hypotheses can be grouped in two sets. Hypothesis 1 refers to the treatment effect and conjectures lower contributions in the inverse proportional treatment than in the egalitarian treatment. The second set of hypotheses refer to how different individual characteristics (measured in phases 2-5 of the experiment) may affect individual contribution in the group contest.
Hypothesis 1 (egalitarian vs. inverse proportional prize shar- ing): We expect that contributions will be significantly lower in the treat- ment with the inverse proportional prize sharing than in the treatment with the egalitarian rule.
Most experiments use the egalitarian rule (for instance Nalbantian and Schotter, 1997; Abbink et al., 2010, 2012; Ahn et al., 2011; Sheremeta, 2011;
Cason et al., 2012, 2017). Note that even this rule provides incentives for free-riding, because a participant would receive the same share of the prize upon making zero contribution than other members of the group who exerts a positive level of effort. An evidence of such possible free-riding is pro- vided by the comparison of the egalitarian and the proportional sharing rule.
Amaldoss et al. (2000); Gunnthorsdottir and Rapoport (2006) and Kugler et al. (2010) compare the effect of egalitarian and proportional sharing rule on behavior in group contest. The general finding is that the proportional sharing rule leads to higher individual efforts than the egalitarian rule. Since
the inverse proportional sharing rule provides more incentives to free-ride than the egalitarian rule, we expect that under the former rule individual efforts will be significantly lower than under the latter one as stated in our Hypothesis 1.
Note that hypothesis 1 is silent about over-expenditure because theory does not inform on if participants will contribute more than predicted by the theory. We had no strong conviction based on the literature if over- expenditure would be found in case of the inverse proportional sharing rule, so we did not formulate it as a hypothesis.
Hypothesis 2 (level of contribution and social value orientation):
We expect to see correlation between the classification according to social value orientation and contribution in the group contest.
Social value orientation classifies participants into one of the following categories (e.g. Murphy et al., 2011): altruist, prosocial, individualistic or competitive. The nomenclature already suggests that the classification is based on how much a participant cares about others. Often the first two categories are lumped into one called prosocial, while the others two are called proself.
There are many studies showing that the classification correlates with behavior in the expected manner. Balliet et al. (2009) and Bogaert et al.
(2008) are two meta-studies that show that social value orientation corre- lates with cooperation in social dilemmas, altruist and prosocial individuals behaving in a more cooperative manner than individuals classified as in- dividualists or competitors. Importantly, there are several studies indicat- ing that proself individuals are less cooperative in the public goods game (e.g. Parks, 1994; Offerman et al., 1996; De Cremer and Van Vugt, 1999;
De Cremer and Van Lange, 2001; De Cremer and Van Dijk, 2002; Smeesters et al., 2003). Field studies also reveal that proself individuals behave differ- ently from prosocial individuals. For instance McClintock and Allison (1989) show that prosocial individuals exhibit more helping behavior than proself ones. The same is found in case of proenvironmental initiatives (Joireman et al., 2001) or choice between public transportation vs. commuting by car (Van Vugt et al., 1995, 1996). Therefore, based on the literature, it is natural to think that altruist and prosocial participants tend to contribute more to the performance of the group than individualistic or competitive subjects.
Hypothesis 3 (level of contribution and risk aversion): We expect that the more risk averse an individual is, the less she contributes in the
group contest, ceteris paribus.
There are studies showing that risk attitudes correlate with contribution in public goods game (Sabater-Grande and Georgantzis, 2002; Lange et al., 2007; Charness and Villeval, 2009; Gangadharan and Nemes, 2009), more risk averse individuals contributing less. Several studies have shown that risk has many facets and the different aspects affect in different ways contributions in public goods experiments. A basic distinction is often made between strate- gic uncertainty (sometimes also called social risk) and risk related to random events that are independent of human decisions and is termed as natural risk or environmental uncertainty.10 Interestingly, Kocher et al. (2015) show that while beliefs about others’ cooperation (that is, strategic uncertainty) affects contribution to the linear public good in the expected positive way, risk aversion measured ´a la Holt and Laury (2002) that captures natural risk does not explain cooperation. However, there are papers (Wit and Wilke, 1998; Au, 2004) studying mainly step-level public goods games that show that both types of risk affect contribution levels. However, in these papers the environment of the decision is varied and the average level of coopera- tion is investigated. We consider the effect of the environment (notably, the sharing rule), but we focus also on the association between individual-level risk attitudes and contribution.11
Contribution to the group performance is risky because winning the prize depends on how much the other members contribute and the total contribu- tion of the other group. These are factors beyond the control of the subjects and represent a source of uncertainty. Not contributing to the group perfor- mance lowers the probability of winning the prize but increases the amount of earnings because the money not contributed is a certain earning for the participants. Since due to the contest nature contribution is even more risky than in a simple public goods game, we hypothesize that anything else being equal more risk aversion associates with less contribution.
10There is some evidence that individuals’ perception of these two types of risk is cor- related (e.g. Bohnet et al., 2008).
11Wit and Wilke (1998) show that both type of risks and their interaction influence contribution in the public goods game. Moreover, Au (2004) finds that environmental uncertainty also affects contribution: in environments with less uncertainty, contributions were higher. Suleiman et al. (2001) and McBride (2010) show that outcomes in step-level public goods games are sensitive to the threshold and other parameters of the experiment.
Hypothesis 4 (level of contribution and cooperativeness): Con- tribution in the coopetition task and in the public goods game are expected to correlate positively.
In the group contests that we study there is a tension between individual and group interests. Contributing more to the group performance increases the probability of winning, but lowers the individual earning,ceteris paribus.
This conflict is more pronounced in the case of the inverse proportional treat- ment than in the egalitarian case. Contribution to the public account in the public goods game is regarded as a proxy for cooperativeness (e.g. Chaud- huri, 2011). Peysakhovich et al. (2014) show convincingly that on the indi- vidual level decisions in different cooperation games are strongly correlated, moreover they find evidence for temporal stability, suggesting that there is a domain-general inclination towards cooperation. Hence, it is natural to think that those participants who are more cooperative in the public goods game, will be more cooperative in the group contests as well, independently of the sharing rule.
Hypothesis 5 (level of contribution and competitiveness): There is competition on two levels. Groups compete against each other, but on the individual level there is a competition between the members of the same group. If the group competition motive dominates, then the individuals who are more competitive are expected to contribute more. If the competition on the individual level is stronger than the group competition, then we expect the opposite to happen. Hence, we expect to see an effect of competitiveness, but we do not have strong expectations on the direction.
The formulation of hypothesis 5 suggests that in terms of competitiveness we carry out a rather exploratory investigation.
4. Experiment
We had two treatments corresponding to the different sharing rules. We ran a session per treatment. In each session, the experiment consisted of five phases plus the questionnaire. In both treatments, phase 1 corresponded to the group contest, while later phases represented experimental games to gather information about the participants’ characteristics. More concretely, in phase 2 we measured social attitudes using the social value orientation, in phase 3 we used the public goods game to measure cooperativeness. Phase 4
served to elicit risk preferences and in phase 5 we measured competitiveness
´
a la Niederle and Vesterlund (2007).
We made clear to participants that their final payoff will be the sum of two payoffs plus the show-up fee. We explained that they will be paid for their performance in phase 1 (the group contest) and from the other 4 phases the computer would pick randomly one and that phase will be paid. We also informed the participants that during the phases they will earn tokens that at the end will be converted into Euros and we stated that the exchange rate may change between phases, but in any case more tokens imply more Euros.12
We also let subjects know that after the 5 phases there will be a ques- tionnaire and after finishing the questionnaire they would be paid in private.
4.1. Group contest
In this phase, first groups of four subjects were formed randomly and anonymously. There were 14 groups of 4 individuals in each session. This phase consisted of 20 rounds. Groups were fixed for the 20 rounds and each group played against another group, called rival group, such that the pair of rival groups was also fixed across all experimental rounds (as, for instance in (Abbink et al., 2010)).
At the beginning of each round, each subject received 1000 tokens that she could use to buy competition tokens for her group, one competition token costing one token. The tokens not used for buying competition tokens re- mained on the account of the subject. Subjects knew that the other members of the group started also with the same endowment and could buy competi- tion tokens as well.
After each round, the amount of the competition tokens a group had ac- cumulated determined the chance of winning the contest. More concretely, imagine groups A and B. Suppose that members of group A / B have bought 1000 / 2000 competition tokens. Then, group B had twice as high proba- bility of winning the contest (2/3) than group A (1/3). In other words, the probability of winning the contest was proportional to the total competition tokens of a given group divided by the competition tokens of both groups.
A wheel of fortune determined which group won the contest in the following
12We changed the exchange rates between tasks in a way that in expected terms the payoffs in the different phases be equal.
way. Following the previous example, two thirds of the wheel would belong to group B and the rest to group A, and after spinning the wheel the winner is the group over whose territory the pointer of the wheel stopped. We made clear that the probability of winning increased in the number of competition tokens.
The group that won the contest received a prize of 4000 tokens. We had two treatments that differed in the way the prize was split within the winning group. In the egalitarian treatment, each member of the winning group received the same amount of the prize, that is 1000 tokens. In this treatment the payoff of any member of the winning group is the sum of the tokens that the participant did not use to buy competition tokens and the 1000 tokens won as a prize. The payoff of a subject in the loser group is just the amount of tokens not used to buy competition tokens. For instance, if a participant uses 350 tokens from her initial endowment of 1000 tokens to buy competition tokens and her group wins the contest, then her final payoff is (1000-350)+1000=1650 tokens. If the other group wins, then her payoff is just 1000-350=650. In the inverse proportional treatment, the less competition tokens a member of the winning group bought, the higher is her share from the prize. In the instructions we explained the division of the prize in this treatment using the following example. Assume a group that consists of subjects A,B,C and D who have bought 100, 200, 400 and 400 competition tokens, respectively. Suppose that this group wins the contest.
Subjects C and D bought the same amount of competition tokens, so their payoff from the prize will be the same. Subject A and B bought just 14 and
1
2 of the amount bought by subjects C and D, hence their payoff from the prize will be four times and twice as much as the payoff of subjects C and D. That is, A / B / C / D would receive 2000 / 1000 / 500 / 500 tokens from the prize. In turn, it implies that in this round the payoff of A is (1000-100)+2000=2900, the payoff of B is (1000-200)+1000=1800, while C and D would receive (1000-400)+500=1100 tokens, both. As in the other treatment, if the other group wins, then the group receives no prize and the final payoff equals the initial endowment minus the tokens used to buy competition tokens, that is A / B / C / D receives 900 / 800 / 600 / 600 tokens.
In both treatments at the end of each round, each participant obtained the following information
• the number of competition tokens that she bought;
• the total number of competition tokens that the group accumulated;
• the total number of competition tokens that the rival group accumu- lated;
• whether the group the participant belongs to is the winner group;
• individual’s payoff in the round, expressed in tokens.
In both treatments, earnings in this phase consisted of the sum of the payoffs of 5 randomly chosen rounds as, for instance, in Chowdhury et al.
(2014, 2016). Subjects knew that their earnings would be converted into euros at the end of the experiment at the following exchange rate: 1000 tokens = 1.2 euros.
At the end of the phase, each participant was provided the information on the five rounds randomly chosen to be paid to the participant and on individual’s payoff per phase in tokens and in euros.
4.2. Other phases
The rest of the phases was the same in both treatments. In phase 2 we measured social preferences using the social value orientation. There are various ways to measure social value orientation, we followed Murphy et al.
(2011). Participants were randomly paired and each of them had to make 6 decisions. In each decision, subjects saw 9 payoff allocations, each allocation containing a payoff for the decision-maker and a payoff for her co-player.
The decision-maker had to choose in all 6 decisions her preferred joint payoff distribution. Choices can be scored to come up with a single score. Social value orientation conceptualizes four idealized orientations:
• altruists maximize the allocation for the other party;
• prosocial individuals tend to maximize their own payoffs, but care also about the other player’s payoff;
• subjects with individualistic tendencies are not concerned about the other player, they just maximize their own payoffs;
• competitive individuals attempt to maximize their own payoffs, but at the same time also minimize the other player’s payoff.
The score achieved after choosing the 6 allocation allows to classify partici- pants in one of the above categories. Participants knew that if at the end of the experiment this phase would be chosen for payment, then the computer would pick one of the six decisions and would randomly choose one of the participants in each pair (called the elector) and the allocation chosen by the elector in the given decision would be paid. The exchange rate used for payment was 1 token = 0.02 Euros.
Phase 3 consisted of a one-shot play of the public goods game. We aimed to measure cooperativeness with this game. We presented the most widely used format of the public goods game, with four players, each of them en- dowed with 1000 tokens. Participants had to decide how much of the en- dowment to assign to a public account, knowing that everybody in the group would receive 40% of the total amount assigned to the public account (that is, marginal per capita return = 40%). The final earning of a subject consisted of the amount not assigned to the public account and the amount received from the public account. The exchange rate used for payment was 1 token
= 0.02 Euros.
Phase 4 served to elicit risk attitudes using the bomb risk elicitation task (Crosetto and Filippin, 2013).13 Participants are presented the following situation. There is a store with 100 boxes, one of them containing a bomb.
The bomb can be in any of the boxes with the same probability. Subjects have to decide how many boxes they want to take out of the store. For each box taken out that does not contain the bomb, they receive money (1 token), but if the bomb happens to be in one of the boxes that have been taken out, then their payoff in this task is zero. We explained that if for example they decide to take out 7 boxes and the bomb is in box 42, then they would earn 7 tokens. However, if the decide to remove 56 boxes from the store and the bomb is in box 51, then their earnings is zero. We informed participants that if at the end of the experiment this task is the payoff-relevant task, the the exchange rate would be 1 token = 0.1 Euros.
In phase 5, we measured participants’ competitiveness using the Niederle- Vesterlund experimental procedure (Niederle and Vesterlund, 2007). The only modification compared to the original study is that we used the slider
13Crosetto and Filippin (2016) compare four risk elicitation methods, among them the bomb risk elicitation task. They show the pros and cons of each method and argue convincingly that the bomb risk elicitation task is appropriate to distinguish between subjects based on their risk attitudes.
task (Gill et al., 2011; Gill and Prowse, 2018) instead of adding up numbers as experimental task. Following Niederle and Vesterlund (2007), this phase consisted of 4 subphases. In subphase 1, subjects performed the slider task (positioning as many sliders on the number 50 as they could in a minute) knowing that they would be paid on a piece-rate basis, earning 1 token for each correctly positioned slider. We also explained that if at the end of the experiment this task would be chosen for payment, then the exchange rate would be 1 token = 0.15 Euros. In subphase 2, before playing again the slider task, groups of 4 members were formed randomly and we informed participants that they would be paid as in a tournament. More concretely, we told them that only the member of the group with the highest number of correctly placed sliders receives a payoff, but she receives 4 tokens for each correctly positioned slider.14 We used the same exchange rate as before. We also informed subjects that they would not know the result of the tournament until the end of the phase. In subphase 3, we explained that they would perform again the slider task and that they could choose the way to be compensated: piece-rate payment as in subphase 1 or tournament payment as in subphase 2. Hence, we have a binary classification: participants are either competitive (if they choose the tournament) or not competitive (if they choose the piece-rate scheme). As before, we explained that we would not tell them the result of the tournament until the end of the phase. We applied the same exchange rate here as in the previous subphases. In subphase 4, participants were not required to perform the task again, but could earn money by choosing an incentive scheme (piece rate vs. tournament) to be applied to their performance in subphase 1. We reminded participants about the number of correctly positioned sliders in subphase 1. We used the same exchange rate as in the previous subphases. This subphase allows us to see what participants believed about their relative performance. Participants knew that if phase 5 would be paid at the end of the experiment, then one of the subphases would be chosen randomly and earnings in that subphase would be paid.
At the end of the experiment, subjects had to fill in a questionnaire.
We elicited socio-demographic information (age, gender, educational attain- ment, field of study, knowledge of languages, number of siblings, education
14We also explained that in case of a tie, the computer randomly would select one of the members with the highest number of sliders correctly positioned.
and employment of the breadwinner in the family, number of persons in the household, factors related to family income), biological features (height, weight, dexterity: left- vs right-handed, and the digit ratio).15 We also mea- sured cognitive abilities with a 5-item version of the Cognitive Reflection Test (Frederick, 2005; Toplak et al., 2014). We used a 10-item version of the Big Five test (Rammstedt and John, 2007) to elicit personality traits and the Rosenberg test (Rosenberg, 1965) to measure self-esteem . We also asked participants if they were happy in general.
4.3. Procedures
There were two sessions corresponding to the two treatments in July, 2018 in the laboratory of LINEEX (Valencia, Spain). In both sessions, there were 56 individuals. In the egalitarian / inversely proportional treatment 39.3%
and 66.1% of the subjects were females.
Sessions lasted about two hours and participants earned on average 18 Euros. There were subjects studying Economics or Business, but 36% studied social sciences, 22% engineering and architecture, 16% health sciences, and 5% arts and humanities.
5. Results
5.1. Descriptive statistics
Figure 1 shows the average effort per period in the two treatments. Visual inspection strongly suggests that there is a treatment effect because in the egalitarian treatment average effort is considerably higher in each period (except period 1) than in the inverse proportional treatment.
The average effort in the egalitarian / inverse proportional treatment is 332.3 / 124.8, efforts being more than 2.5 times larger in the egalitarian treatment than in the inverse proportional one, on average. The same aver- ages over the first / second / third and last 5 rounds are 353.3 / 183.8 (92%
more effort in the egalitarian treatment) for the first, 371 / 129.5 (186% more
15We gathered information on participants’ digit ratio since we believed that there might be some relationship between digit ratio and decisions in the group contest. There is a growing literature indicating that digit ratio associates with several individual character- istics, such as competitiveness, social preferences, and risk aversion among other domains of economic interest (Bra˜nas-Garza et al., 2013, 2018; Garbarino et al., 2011; Millet and Dewitte, 2006; Pearson and Schipper, 2012)
100 200 300 400
0 5 10 15 20 0 5 10 15 20
Egalitarian treatment Inverse proportional treatment
Average individual effort per period
Period
Figure 1: Average effort per period
effort in the egalitarian treatment) for the second, 319.1 / 100.2 (218% more effort in the egalitarian treatment) for the third and 303.8 / 92.3 (229% more effort in the egalitarian treatment) for the last 5 rounds.
The two-sample Wilcoxon ranksum test confirms what we see, as for all periods except period 1 there is a significant difference in the effort made between the two treatments (p<0.001 in all cases). If we do not distinguish between periods and pool all the efforts together, we observe a significant difference using the same test (p<0.001). In both treatments we observe a marked downward trend. However, even in the last 5 periods in the egalitar- ian treatment efforts are higher than in the first 5 periods in the inverse pro- portional treatment, the difference being significant (two-sample Wilcoxon ranksum test, p<0.001).
We also carry out within-subject tests to compare decisions in the first and last five rounds to see if there is indeed a downward trend. In fact, there is statistically significantly lower effort in the last 5 rounds relative to the first 5 rounds in both treatments (Wilcoxon signed-rank test, p-value= 0.085 in the egalitarian treatment and p-value<0.001 in the inverse proportional treatment).
Remember that the theoretical symmetric prediction for the egalitarian treatment is 4Nυ2, that for υ = 4000 and N = 4 implies a predicted individ-
ual effort of 62.5. Given average efforts of 332.2, we have an 431.5% over- expenditure in the egalitarian treatment, on average. Similarly, the average effort of 124.8 tokens in the inverse proportional treatment is much higher than the predicted zero contribution. Hence, although contributions in the inverse proportional treatment are significantly lower, than in the egalitar- ian treatment, we observe over-expenditure even in the inverse proportional treatment. Moreover, observing a decrease in the effort across rounds in each experimental treatment, we look for differences between predicted and actual effort exerted by participants in the last 5 rounds, which is 303.9 and 94.9 in egalitarian and inverse proportional treatment respectively. t-test shows statistically significant differences in average effort with respect to predicted effort of 62.5 in egalitarian and 0 in inverse proportional treatment (p<0.001 in both treatments), suggesting the presence of the over-expenditure in both treatments even at the end of the group contest phase. Figure 2 provides further support to the treatment effect, indicating the histograms of efforts in the two treatments. Efforts in the inverse proportional treatment are clearly more skewed to the left than in the egalitarian treatment, resulting in over- all less effort. The Kolmogorov-Smirnov test rejects clearly (p<0.001) the equality of the effort distributions in the two treatments.
0 10 20 30 40
0 100 200 300 400 500 600 700 800 900 1000 0 100 200 300 400 500 600 700 800 900 1000 Egalitarian treatment Inverse proportional treatment
Percent
Effort
Figure 2: Histogram of efforts in the treatments
The above descriptive statistics and tests strongly suggest that there is
a difference in the behavior of participants between treatments. Subjects in the egalitarian treatment on average made considerably more effort than participants in the inverse proportional treatment.16
In Table 1 we represent the choices of the subject in the other tasks. In the social value orientation, 59% of the participants were classified as proso- cial, that is very similar to other studies (e.g. Murphy et al., 2011).17 In the bomb risk elicitation task the mean / median / standard deviation of the boxes is 45.9 / 47 / 15.2 which is in line with results found in other experiments (e.g. Crosetto and Filippin, 2013, 2016). Moreover, we do not see any gender differences when we consider treatments together or sepa- rately (Wilcoxon ranksum test, p>0.17 always), similarly to other studies that use this risk elicitation method, (see Crosetto and Filippin, 2013, 2016).
Contribution in the public goods game is generally in the range of 40-60%
in the literature, (see, for instance Chaudhuri, 2011). In our experiment, contribution levels are considerably lower. However, note that in our case participants played the public goods game after the 20-period group contest game in which they experienced a declining pattern of effort that might have affected their contribution in the public goods game. A main finding of the competition experiment by Niederle and Vesterlund (2007) is that men are more likely to enter tournaments than women, a pattern that we observe in our data as well.18 Overall, we believe that the behavior that we observe in these games and tasks is in line with what has been found in the literature.
Table 1 also reveals that while in the case of social value orientation and risk tolerance we do not observe a marked difference between treatments, cooperativeness (captured by contribution in the public goods game) and competitiveness vary considerably between treatments.
In Table 2 we depict the pairwise correlations between the individual
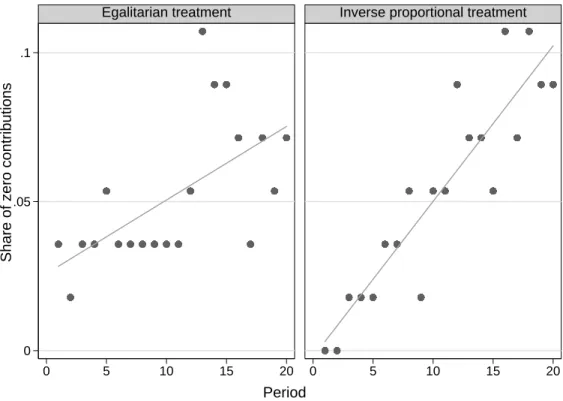
16As a further evidence, consider the share of zero contributions in the different treat- ments. This share is 5.18% in the egalitarian and 5.27% in the inverse proportional treat- ment, the difference is not significant (according to the two-sample Wilcoxon ranksum test and the test of proportions). However, the share of zeros increases more quickly over time in the inverse proportional treatment (see Appendix C.1).
17Anderl et al. (2015) show that social value orientation fluctuates with the menstrual cycle, so the gender breakdown may be not very informative since we do not know anything about the participants’ menstrual cycle.
18Despite the considerable difference in competitiveness between males and females, neither the Wilcoxon ranksum test, nor the test of proportions do reveal a significant difference.
Social Value Orientation (% of prosocial)
Risk tolerance (# of boxes)
Contribution in PGG (% of endowment)
Competitiveness (% of competitive) Overall 58.9 (52.5 / 66) 45.9 (46.7 / 45) 27.6 (20.9 / 35) 48.2 (54.2 / 41.5) Egalitarian 58.9 (45.5 / 67.6) 46.9 (45.9 / 47.5) 35.2 (24.6 / 42) 44.6 (50 / 41.2) Inverse proportional 58.9 (56.8 / 63.2) 44.9 (47.2 / 40.5) 20 (18.7 / 22.4) 51.8 (56.8 / 42.1)
Table 1: Performance in the other tasks. In brackets the first number corresponds to males and the second to females.
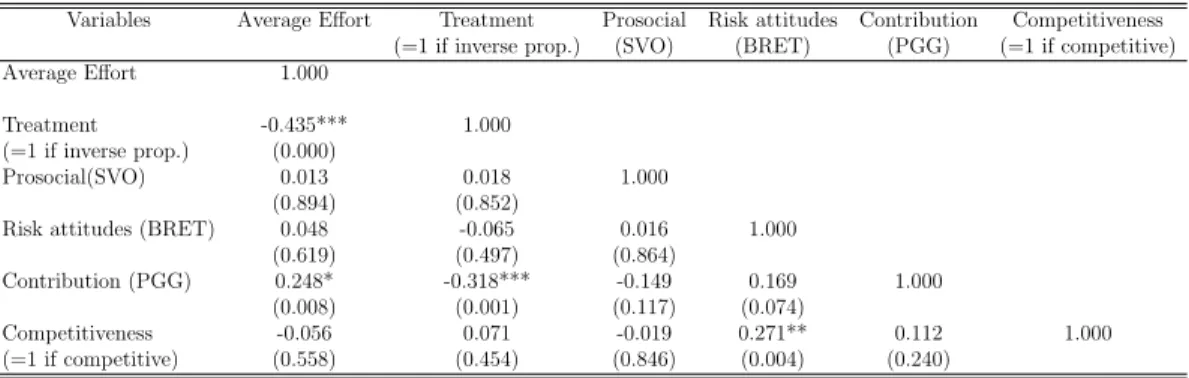
choices in the group contest, treatment and choices in the social value orien- tation (SVO), bomb risk elicitation task (BRET), public goods game (PGG) and the competitiveness task. For social value orientation we classify partici- pants either as prosocial or as individualistic, by employing a dummy that is 1 if the participant is prosocial. In the bomb risk elicitation task we measure risk tolerance, so larger values here denote less risk aversion. In the public goods game the contribution to the common project is our measure of co- operativeness, higher values representing more cooperative individuals. To measure competitive behavior, we have a dummy that takes on the value of 1 if the subjects chooses to compete in subphase 3 of the competition task. In order not to inflate the number of observations, we only consider the average effort over the 20 rounds.19
Variables Average Effort Treatment Prosocial Risk attitudes Contribution Competitiveness (=1 if inverse prop.) (SVO) (BRET) (PGG) (=1 if competitive)
Average Effort 1.000
Treatment -0.562*** 1.000
(=1 if inverse prop.) (0.000)
Prosocial (SVO) -0.065 0.018 1.000
(0.493) (0.852)
Risk attitudes (BRET) 0.096* -0.065 0.016 1.000
(0.315) (0.497) (0.864)
Contribution (PGG) 0.404*** -0.318*** -0.149 0.169* 1.000
(0.000) (0.001) (0.117) (0.074)
Competitiveness -0.077 0.071 -0.019 0.271** 0.112 1.000
(=1 if competitive) (0.418) (0.454) (0.846) (0.004) (0.240)
Observations 112 112 112 112 112
P-values in parentheses. *p <0.10, **p <0.05, ***p <0.01.
Table 2: Pairwise correlations between behavior in the group contest, treatment and the subsequent games and tasks.
Table 2 also indicates that there is a treatment effect as being in the
19If we carry out the same exercise over the first / last five periods in the group contest, we obtain qualitatively the same pattern, see section Appendix C.2.