the “legible” City
“Just as this printed page, if it is legible, can be visually grasped as a related pattern of recognisable symbols, so a legible city would be one whose districts or landmarks or pathways are easily identifiable and are easily grouped into an overall pattern…”
(K. Lynch)
abSTracT1
A city like this – where stepping on the Széchenyi Chain Bridge one immediately arrives at the abutment leading to New York City of the Brooklyn Bridge, and what is more, in evening floodlight – obviously does not exist in reality. Yet the message of the advertisement is easy to understand. Even without one word of a hint, a few emblematic buildings immediately take us to the large cities of the world. Seeing the advertisement – without even noticing it – our consciousness immediately
“calls forth” the images in our minds about the countries, metropoles of the world, or in other words, our cognitive map.
The inSPecTion of cogniTiVe maPS
As everyday the practice of rebuilding spatial reality in our consciousness – or making cognitive maps, as we have called the process earlier – may be, the phenomenon is as problematic to analyse. The problem arises from the fact that while we use cognitive maps on an everyday basis, yet these can only be researched in an artificial, experi- mental seing. Thus, we continue to lack a commonly accepted method by which cognitive maps could be “elicited”. This state of affairs obviously does not mean that there would not be resourceful and highly effective methods to investigate the issue.
An American researcher, J.S. Adams for instance asked his experimental subjects to perform the laborious task of writing down as many street names from their neighbour- hood as they could remember in a given amount of time. P. Gould on the other hand started with the traditional survey question of “Where would you like to stay the most if you could choose freely?” K. Cox required the participants in his experiment to fulfil the not very entertaining task of ordering all the states of the United States of America according to a scoring system. D. Ley had them draw some kind of a criminological map of Philadelphia, on which participants were asked to mark the less safe, “ill reputed” locations of the city.
According to American architect K. Lynch – a student of the famous painter of Hungarian origin György Kepes – emblematic constructions that became the symbols of the towns where they are located play an important role in shaping our image of the towns, our cognitive maps. Lynch considers that five elements can be distinguished within the structure of cities, merely from the perspective of visibility.
Looking at a city, the first thing that comes to our sight is the network of its paths.
These paths, along which we move every day, bind the different spots of the city into an organic system. Thus, the visual structure of Budapest, for example, is sig- nificantly defined by its ring roads, the embankments alongside the Danube and the boulevards leading out of the city centre. The second important visual ele- ments, the edges are also accompanied by paths. A characteristically outlined edge for instance in the case of Budapest is the line of the Danube or the border of the rising Castle hill. Striking nodes appear at the intersection of paths, like Moszkva tér (Moscow Square) or Móricz Zsigmond körtér (Zsigmond Móricz Circus) in Buda.
Further important elements are the well circumscribable areas, the districts, like for example the Rózsadomb or the Gazdagrét district. Finally, the fifth visual element in the view of Lynch consists of the landmarks, the symbolic objects closely con- nected to the given city, which are immediately associated with the city in people’s minds (e.g. Matthias Church or the Parliament). According to K. Lynch, we can thus construct the city on our cognitive maps using five visual elements: the paths, the edges, the nodes, the districts and the landmarks.
Figure 1: Visual elements in the Városliget (City Park of Budapest) (Cséfalvay Z., 1990) Translation of the words on the image:
Törésvonal = Fault Line/Edge; Iránypont = Reference Point/Landmark; Út = Road/Path, Csomópont = Point of Junction/Node; Terület = Area/District]
VISUAl ElEMEnTS In THE VáROSlIgET (CITy PARk Of BUDAPEST)
Using the systematisation of Lynch in the Városliget (City Park), a well-known area of the Hungarian capital, well-defined visual elements can be distinguished. The City Park obviously means different things to everyone, therefore its visual ele- ments are also perceived and appreciated differently by each and every individual.
(See Figure 1.)
Based on his system of visual elements, Lynch asked the residents of three major cities – Boston, Los Angeles and New Jersey – to draw their respective cities from memory the way they see them. The drawing was supposed to show the degree to which the visual elements appeared on their cognitive maps. Yet he did not only base his research on these map drawings, called “mental maps” by P. Gould, but also completed it with interviews. Thus, eventually three possibilities for compari- son were available for Lynch. Firstly, he could match the actual structures of the cities with the drawings, the “mental maps” created about these, secondly, he could compare the “mental maps” of the three cities to one another, and finally, he could explore the differences between the map drawings and oral communication.
Lynch’s results are extremely instructive from the perspective of city architecture and planning. The “mental maps” almost regularly included the spatial elements that everyone, without exception, remembered, while the unknown parts of the city, its “white spots”, were also the same for almost everybody. Thus, the different parts of the city were very dissimilar in how they could be visually grasped, or using Lynch’s terminology, differed very much in their degree of “legibility”.
The “menTal maPS” of boSTon and bUdaPeST
According to Lynch’s research, the most clearly arranged, “legible” one of the three examined cities was Boston, which had followed the European traditions of city architecture. In spite of that, it was remarkable that even in the case of the in-depth interviews, which provided more grounded and in-depth information, there were quite a few “white spots”, unknown areas – consistent with the drawings made from memory – even in this “legible” American city.
Yet Lynch was not only interested in the cognitive maps, but also in the methods leading to them, the process of cognitive mapping. Therefore he took the effort to observe how the participants in his experiment set about to draw the sketch maps, and what were the steps that led to their respective cognitive maps. The result of his investigation was a typology of five types, from which everyone can easily identify their own styles of cognitive mapping.
The most frequent style trend is the route method. The cognitive map of the city and the map drawing serving as a “mental map” is constructed in this case with the help of a known route – most frequently the route between home and workplace –
and its forks that are important for us. The other frequent procedure is the frame filling method, when a shape defined by a characteristic boundary is filled with the most important elements of the city. The third method is built on the road network, i.e. the objects of the built environment attached to the channels of communication of the city. The fourth strategy, the mosaic, or tile method is relatively rare. In this case only but a few details of the city are placed on the cognitive map, with an ext- remely accurate elaboration, but, at the same time, mostly with white spots stret- ching among the tiles. Finally, according to the fifth solution, the cognitive map is organised around a centre – usually the dwelling place or the downtown part of the city –, thus the rest of the objects of the city only make sense in this connection.
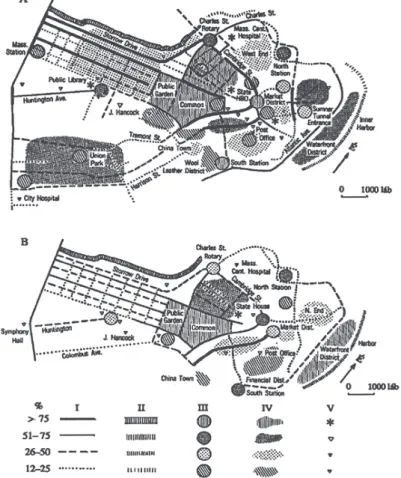
Figure 2: The “mental maps” of Boston, based on in-depth interviews (A) and drawn from memory (B) (Lynch, K., 1960)
The spatial objects (i = paths; ii = edges; iii = nodes; iV = districts; V = landmarks) are mentioned by the given % of the subjects
[Translation of the words on the image: 0 … 1000 láb = 0 … 1000 feet; É = N(orth)]
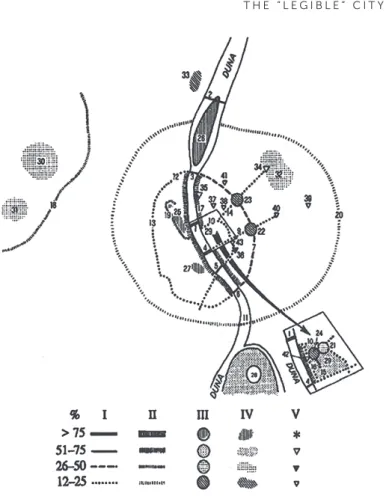
Figure 3: The “mental map” of Budapest, based on the sketch maps of the students (Cséfalvay Z. - Fischer, W, 1990)
The spatial objects (I-V) are mentioned by the given percentage of the respondents.
I. Paths: 1 = Széchenyi Chain Bridge; 2 = Árpád Bridge; 3 = Margaret Bridge; 4 = Elisabeth Bridge;
5 = Liberty Bridge; 6 = Petőfi Bridge; 7 = Grand Boulevard (Ring Road); 8 = Northern Rail Bridge;
9 = Rákóczi Street; 10 = Small Boulevard (Ring Road); 11 = Southern Rail Bridge; 12 = Margaret Ring Road; 13 = Alkotás-Bocskay-Irinyi Avenue; 14 = Andrássy Avenue; 15 = Váci Street;
16 = Danube Promenade.
II. Edges: 17 = Danube bank; 18 = the edge of the Buda hills; 19 = the edge of the Buda Castle hill;
20 = City confines.
III. nodes: 21 = Deák Square, 22 = Blaha Lujza Square, 23 = Oktogon; 24 = Vörösmarty Square.
IV. Districts: 25 = Buda Castle; 26 = Margaret Island; 27 = Gellért Hill; 28 = Csepel Island;
29 = Downtown; 30 = János Hill; 31 = Svábhegy; 32 = Városliget (City Park); 33 = Óbuda centre.
V. landmarks: 34 = Millennium Monument; 35 = Parliament; 36 = National Museum;
37 = St. Stephen’s Basilica; 38 = Opera; 39 = People’s Stadium; 40 = Keleti Railway Station;
41 = Nyugati Railway Station; 42 = Vigadó; 43 = The Building of the Faculty of Science of the Eötvös Loránd University
[Translation of the words on the image: Duna = Danube]
Based on the method of K. Lynch, a similar survey was conducted in the 1980s among the students of the Eötvös Loránd University of Budapest. According to the results of the survey, the “mental map” of the Hungarian Capital is characterised by downtown centricity. For the subjects of the experiment Budapest meant the area delimited by the Grand Boulevard of Pest, the Margaret Ring Road and the Alkotás Avenue in Buda. Anything falling outside this boundary “was not even the Capital”.
It is also striking that most of the urban landscape elements on the “mental map”
were somehow related to the channels of traffic communication. In the view of K.
Lynch the city landscape can best be grasped with the help of well-delimited areas and zones. Yet it seems that this statement is mostly only true for the American cities, where the territorial segregation of the different social groups is extremely sharp, while in the case of European cities the roles of areas and zones is less important on cognitive maps. In Budapest, for instance, the defining elements of the “mental map” are the major channels of communication and the bridges across the Danube River. The so characteristic downtown centeredness of the Capital’s
“mental map”, which hardly takes note of middle class building estates, the privileged green area of the Buda side, or the industrial districts of the outskirts, can be traced back to a variety of far-reaching reasons. Firstly, Downton Pest, primarily built during the period after the Austro-Hungarian Compromise, is an extremely charac- teristic architectural ensemble, making it even today the most uniform and best arranged part of the city. Secondly, most of the functions that make the life of a capital city go round (different services, management etc.), are predominantly concentrated here. Thirdly, all the establishments that are important in the every- day lives of students are located in the Downtown area of Pest.
The other important conclusion arose from the comparison of the “mental maps”
of the cities – particularly Boston and Los Angeles. The survey participants could generally draw very detailed, well-proportioned maps of more than 200 years old Boston, a city that partially followed European architectonic traditions. On the other hand, only very general, obscure “mental maps” were produced about Los Angeles, a rather monotonously built city that could be qualified with a little exaggeration as an agglomeration of about forty villages. The question arises therefore, of how urban designers could come up with clear-cut, “legible” cities. Where is the point when regular city structure changes over into monotony, and vice versa, when does irregular crowdedness become visually incomprehensible? What can civic design do in this respect at all? Although since Lynch’s research city designers have tried out countless experiments meant to turn large cities “legible” – e.g. by rediscovering old street furniture or by painting the blocks of flats in vivid colours instead of concrete grey or using pitched roofs instead of flat roofs –, but failed to come up with a true answer so far.
The purpose of the architect Lynch with these “mental maps” was to create a comprehensible, receptible, “legible” city. Yet, it lies within the nature of cognitive mapping that the same city – no matter whether it is easily comprehensible or not – is “read” differently by everyone. For that very reason, only a decade after
Lynch’s survey, geographer P. Orleans asked people again to draw “mental maps”
in Los Angeles. According to Lynch Los Angeles, primarily because of its peculiar city structure, was a hardly “legible” city, one difficult to read. However, P. Orleans made a twist in the optics: the nature of the “reading”, i.e. of the “mental map”
depended, he said, on the place from where the city of Los Angeles was observed, more precisely on the angle of the observing social group.
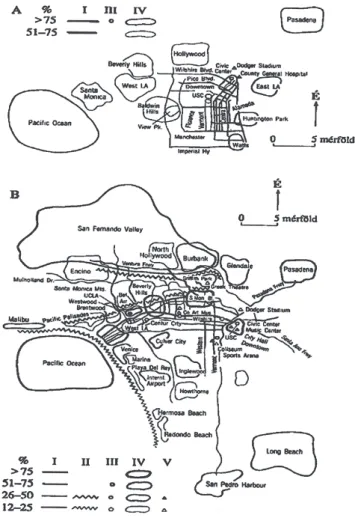
Figure 4: The “mental map” of Los Angeles seen from Avalon (A) and Westwood (B) (Orleans, P., 1973)
The spatial objects (i = path; ii = edge; iii = node; iV = district; V = landmark) are mentioned by the given percentage of the respondents.
[Translation of the words on the image: 0 … 5 mérföld = 0 … 5 miles; É = N(orth)]
differenT PerSPecTiVeS on The “menTal maP”
P. Orleans had “mental maps” drawn on four areas of Los Angeles, differing sharply from one another in terms of social character. In Boyle Heights, the immigrant Mexicans living there hardly knew their town at all. Los Angeles is nothing but a tiny spot on “mental map” drawn by them, the metropolis from their perspective is not more than a few streets of the slum. Watching from the predominantly black inhabited district of Avalon, Los Angeles seems to be a much more complex city.
Yet, apart from the elaborate downtown and their own dwelling location, the other parts of the city are unknown to them. The middle class inhabitants of Northridge drew a completely different map of Los Angeles, which also included the areas bet- ween their dwelling places and the downtown area. Finally, the most detailed, best structured image of the city was drawn by the participants in the experiment from Westwood, mostly belonging to the upper class. (See Figure 4)
The reasons of the differences between the “mental maps” this time are literally to be found in the differing viewpoints. The subjects participating in the experiment, belonging to different social groups, have in fact drawn the parts of Los Angeles that were indeed known to them. This knowledge naturally came from their direct, everyday experience. The immigrant Mexicans living in the poor district of Boyle Heights understandably did not draw the shoreline of the Pacific Ocean, because they did not go to surf there, and similarly omitted the downtown of the city, as they never reached their during their shopping routes, not even by accident. In other words: these segments lack the financial means and the social ability needed to enter the mentioned areas. It was exactly this social difference that the “mental map” reflected. Thus, everyone draws only the parts that truly belong to them on the “mental map”. People only mark the areas that they use in reality, those sym- bols of the town that they can indeed identify with. “Mental maps” visually grasp what of the city falls to the share of each individual. A city, in principle, obviously belongs to everyone, but the whole city – as it became clear from the assessment of P. Orleans – only belongs to a very few. When Lynch had such “mental maps”
drawn, he in fact demanded the participants of his experiment an account of the entire city. However, the city is much more a mosaic of social worlds at a distance of a light-year from each other – as R. E. Park had already discovered as early as the 1920s –, rather than a kaleidoscope of visual elements. Similarly, “mental maps”
only indirectly and clumsily relate to our relationship to the city. To what degree are we attached to our place of living, do we love our city or not, and if so, why?
With the research of “mental maps”, by overemphasising the visual character of spatial environment, the most important feature of cognitive mapping, the subjec- tive, evaluative relationship to space, remains in obscurity. This kind of relationship is hard to investigate by city drawings, sketches tossed from memory. Cognitive maps can not only exist as mere maps, but also in the form of opinions, misbeliefs and stereotypes.
The maP of england STanding on iTS head
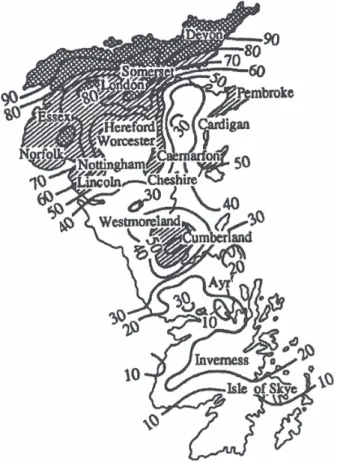
The scientific investigation of the subjective relationship to spatial environment obviously began with the simplest possible solution. If we are curious to learn about how people value their environment, we have to ask them. Let’s say, we should ask them the question “Where would you like to stay the most if you could choose freely?” And if we have enough time and enough helpful subjects ready to answer, then we can ask them to list all the possible places that can be taken into consideration, according to their value. P. Gould and R. White asked English uni- versity students to ponder from that perspective each administrative unit of Great Britain, and give them a value from 1 to 100. The result gave a subjective image of the insular kingdom, which was by all means differing from reality, therefore – in order to showcase that – the map summing up the results of the research was drawn upside down.
Figure 5: The “mental map” of England based on the preference assessment of the dwelling place (scores based on the percentage of the inquired subjects)
(Gould, P. - White, R., 1968)
As it is shown by this strange map, such assessments – which had already been carried out since in almost every important country in the world – do not bring too many novelties on the level of direct results. On the upside down map of England, the regions with the highest score are along the Southern shores of the island, the traditional holiday areas with the most agreeable climate. Second on the list of pre- ference is London, the pulsing metropolis. The third place is occupied by the lake region of Middle England, which by its beauty – as if the earlier mentioned typology of B. MacKaye was followed – create the successful harmony of rural life and life close to nature. Dwelling place preference lists resulting from the inquiries done in the United States also repeated the long known spatial value judgments: California is the realm of “high tech” and of eternal sunshine, Texas still represents the Wild West, New York continues to be the home of Wall Street and Manhattan. Positive value judgments were connected almost always to the current dwelling place and the areas with a traditionally high dwelling prestige in the given country. At the same time, the regions qualified as less attractive usually also corresponded to the areas publicly perceived as “Godforsaken places”.
In addition, between these well-known extremes – as a result of the nature of the scoring method – a wide, homogeneous zone was stretching, as it was simply impossible to create a well-differentiated ranking list of all the nearly one hundred administrative units in Great Britain based on the question “Where would you like to stay the most?”.
A fashionable tool of the research on the opinions, value judgments regarding our geographic environment, dwelling place or city is linked to the name of Ch. Osgood.
His method is based on two thoughts. On the one hand, it is relying on the recog- nition that the surrounding world can be more or less well mapped with language, the world of words, by which we in fact reproduce the image of the outer world formed inside us. Another starting point is the empirical fact that written words are more than just their letters in a specific order, because they perpetually elicit new thoughts, associations, and emotions from the readers.
Osgood, accepting Goethe’s wisdom – “Every word that we utter rouses its cont- rary” –, turned the previous thoughts into tests using the following method. Let us place in front of the participants in the experiment a list with opposite notions, qualifying the dwelling environment (e.g. cosy – bleak, clean – dirty, quiet – noisy), and ask them to choose which of the pair of opposing notions describes best¸ in their opinion, the given spatial environment. Let us also attach a scale to the list – for instance a seven degree scale –, because the world is not black or white, and our value judgments can have a great variety of shades, too. And when we have done this, the new measurement method, the so-called semantic differential scale – to use a term borrowed from linguistics – is ready to be used. (For truly accurate investigations the arbitrary selection of opposing pairs of notions is obviously not enough. Osgood himself worked with 130 pairs of notions in his first approach, a number that he narrowed down later to a standard list of 41 pairs of notions, based on his assessments.)
BUDAPEST AnD győR AlOng THE SEMAnTIC DIffEREnTIAl SCAlE
In what the opinions of an inhabitant of a metropolis and that of a town in the countryside are different about their dwelling places? What is the difference between being a resident of the “Capital” or living in “the countryside”, when we conduct a more in-depth examination of the meanings of these two notions? The question was attempted to be answered by two different researches – carried out on different occasions –, based on the tests of Osgood and others. In 1989 a young, mobile, future-oriented and relatively homogeneous group, the students of the Geography Department of the Eötvös Loránd University answered the questions about the atmosphere, social milieu, conditions of the environment of Budapest.
Two years later, the citizens of Győr answered similar questions. (Although far-reaching conclusions cannot be drawn today from the results of the two assessments – especially because such surveys are a very young branch of domestic geography research, therefore the mentioned surveys were also built on relatively small, less representative samples – yet, in spite of that some of their findings were signifi- cant.) According to the semantic differential scale, the atmosphere, mood, the dist- inctive, pulsing world of the Capital was unambiguously seen as positive, and the rating is no accident, as the leisure time offer, the opportunities for entertainment and socialising in the capital city with millions of inhabitants is quite adequate for student lifestyle. However, the social milieu was almost unanimously qualified as inert. It may be true, that one cannot really expect more exciting opinions about a social medium that had seemed motionless for decades – like Hungary had been in the middle of the 1980s. The greatest part of the negative opinions, – not surprisingly at all – were connected to the environmental conditions.
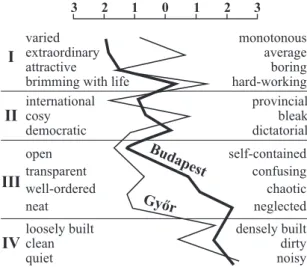
Figure 6: The images of Budapest and Győr along semantic profiles (Z. Cséfalvay, W. Fischer W, 1990 and Gy. Szakál, 1993) i = atmosphere; ii = social milieu; iii = town structure; iV = environment
Interesting parallels and differences can be found when this image is compared to the view of the citizens of Győr about their own town. The inhabitants of the town in the countryside – naturally enough, one might say – consider their locality a little more average, monotonous than the students of Budapest, the two-million metro- polis. It may also seem natural that Győr, with its less than 130 thousand inhabitants looks more organised and better maintained than the Capital. At the same time it is surprising that, because of the proximity of the Western border, the citizens of Győr see their town more international that the inhabitants of Budapest see their city visited by millions of tourists.
In spite of the diversity of research solutions, the world of cognitive maps and the value judgments connected to our dwelling places are still a relatively unknown area. Yet there is no shortage of methods full of imagination, or which are tireso- me for the participants in the experiments. Just like the statement that “everyone constructs their cognitive maps using their own, specific, unique procedures” holds true, it is similarly true for the assessment of cognitive maps, that everyone inves- tigates them in their own way.
referenceS
Adams, J. S. (1969): Directional bias intra-urban migration. In. Economic Geography.302-323, 305.
Cséfalvay Zoltán (1990): Térképek a fejünkben. Akadémiai, Budapest
Cséfalvay, Z.—Fischer, W. (1990): Cigányzene és lakáshiány — sztereotípiák és a valóság el- lentéte a Budapest képben. — Földrajzi Értesítő. 1-4.207-220.
Gould, P. - White, R., (1968) The mental maps of British school leavers. Regional Studies 2. 161-82.
Lynch, K. (1960): The Image of the City. Massachusetts institute of Technology Cambridge, London
Lynch, K. (1979): A város szemléletének struktúrája. In Vidor F. (szerk.) Urbanisztika. Gondo- lat, Budapest
Szakál, Gy. (1993): Ember és környezet viszonya a győri polgárok tudatában. Műhely, 1.43-49. o.
noTeS
1. The article was published in Hungarian: Cséfalvay Zoltán 1994: A modern társadalomföld- rajz kézikönyve. Budapest IKVA 287-298.