THE SUSTAINABILITY CONCERNS DETERMINING THE DEVELOPMENT COURSE OF URBAN TRANSPORT
Péter Dániel Borbás PHD student
Enyedi György Doctoral School of Regional Studies, Faculty of Economics and Social Sciences, Szent István University
E-mail: borbasp@bkv.hu Abstract
In connection with the preparations for strategic decisions regarding the development of local living spaces, the factors affecting quality of life and liveability are becoming more and more emphasized, in addition to their immediate expression, examination of their long-term effects is becoming more and more inevitable, as well (see the social intensification of the issue of climate change). Consequently, life and functioning of cities are fundamentally determined by transport, i.e. by the available means of travelling. The article examines the current international trends related to tram operation and maintenance, and, respectively, it presents an example of possible practical realization of urban policy objectives through a specific European network development project.
Keywords: public transport, sustainable development, urban policy, transport development JEL classification: L91, Q53
LCC: H305-311
The environmental impact of the different modes of transport
The Budapest Climate Strategy adopted in April 2018 includes the greenhouse gas emission inventory of the Hungarian capital city. According to the document, in 2015 the annual level of CO₂ₑ emission was approximately 9 million tonnes in Budapest (i.e. 5.3 tonnes CO₂ₑ/capita), of which the share of transport amounted to 20%, with nearly 1.8 million tonnes. At the same time, the impact of the means of community transportation represented only 12.8% of the total emission of transport (around 230,000 tonnes while the CO₂ₑ emission attributable to private and commercial road transport was nearly seven times as much.
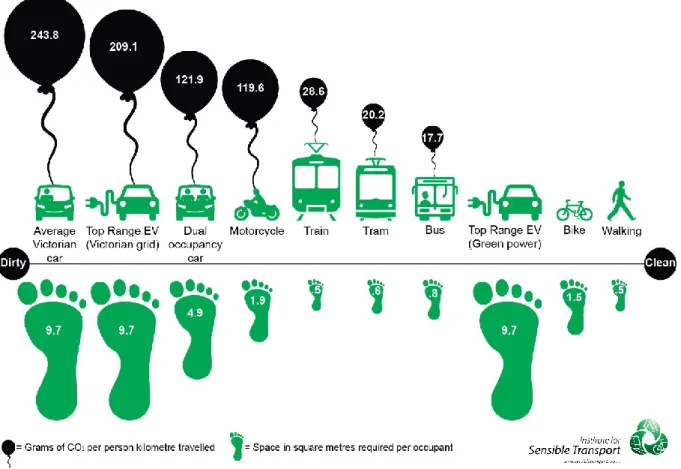
A recently concluded project of the Australian Institute for Sensible Transport (www.sensibletransport.org.au) studied the modes of transport functioning in the city of Melbourne from two aspects: CO2 emission (gram) for passenger-km and space intensity (m2/passenger). The data are shown in Figure 1. The study encouraged the local government to set the goal of decreasing the 2005 level of pollutant emissions by 26-28% by 2030, which evidently requires the support and development of less harmful modes of transport. The CO2 emission is illustrated by black balloons. It is an unexpected result that the specific rate of environmental pollution per one passenger kilometre of electric cars powered from the city power grid is only slightly lower than that of an average passenger car of traditional drive, taking into consideration the CO2 generated in the course of the production of electric power.
A less surprising fact is that the specific figures of means of community transport are more favourable in terms of pollutant emission compared to the modes of traditional motorized individual passenger transport.
Figure 1: The pollutant emission and space intensity of the different modes of transport Source: Institute for Sensible Transport
It may also be mentioned that the liveability of cities is greatly influenced by the efficient use of the available spaces and community surfaces (considering in particular the ever-increasing concentration of population. Based on the example presented it is proven that the passenger car is the mode of transport with the highest space demand. This is true regardless of the drive of the vehicle, therefore the space demand of modern passenger cars powered using alternative energy sources is identical to that of the diesel-powered cars.
Out of the environmental effects, noise pollution is becoming more and more crucial nowadays, which has become the second most severe problem in Europe after air pollution (Bajnai, 2018).
In Budapest, the primary source of noise pollution is road transport. Noise pollution is significant (up to 12-17 dB more than the acceptable level) along the main roads (mainly in the starting sections of the motorways, as well is in the city centre backbone road network);
moreover, the population is exposed to a high level of night noise pollution to an extent close to the daytime figures (the difference is often only 4-7 dB) (Budapest Mobility Plan, 2019).
Therefore, in short, it can be declared that from the point of view of sustainable development and liveability, strengthening and consideration of public transport, bicycle and pedestrian modes of transport shall be given priority in the urban development strategies.
Transport policy objectives in the European Union
In accordance with the above principle, the European Union had already formulated specific transport polices which the Member States are advised to take into consideration – among others – related to the determination of the development directions of urban transport. The “White
Paper” adopted in 2011 sets the European Union transport policy objectives until 2050, under the title “Roadmap to a Single European Transport Area – Towards a competitive and resource efficient transport system”. On the basis of this, the primary objective of the EU is the establishment of integrated transport networks, however, other objectives and measures – among others for urban transport – were set as well. The paper establishes that “Urban transport is responsible for about a quarter of CO2 emissions from transport, and 69% of road accidents occur in cities.” “If a higher share of travels is realised by public transport and the minimum service obligations prevail it will allow an increase in density and frequency of service, thereby it may generate a virtuous circle for public transport modes.” Strategic measures were determined in order to achieve the objectives. The following are some of the more important ones:
Efforts towards a more competitive and sustainable transport system, as a part of which environmentally friendly energy use through new fuels and propulsion systems, the improvement of the energy and resource efficiency,
enhancement of transport security (protection of passengers),
improvement of the transport security situation,
improvement of quality, accessibility and reliability of transport services is a key issue (the main characteristics of service quality: attractive frequencies, comfort, easy access, reliability of services, and intermodal integration),
preparation of urban mobility plans, as well as the development of a European urban mobility indicators based on common targets.
The current trends of tram transport
The objectives aimed at urban transport may be realized the most efficiently as a result of development of public transport, taking into consideration the environmental impacts as well.
Due to the growing pressure of intra-city travelling needs and the occurring congestions, the rail-bound transport networks are given a more and more pronounced role, which ensure faster trips for travellers through the use of partially or entirely separated transport corridors. From among urban railways, the role and current development directions of tram transport are presented in the study of the international consulting firm Eurogroup Consulting (Trams at the heart of the 21st century metropolis, www.eurogroupconsulting.com). The study establishes dominant trends based on the analysis of the tram operation of 32 cities. The most important findings of the document are presented below, amended by the characteristics of the Budapest tram transport.
The effect of the tram: it re-invigorates public transport
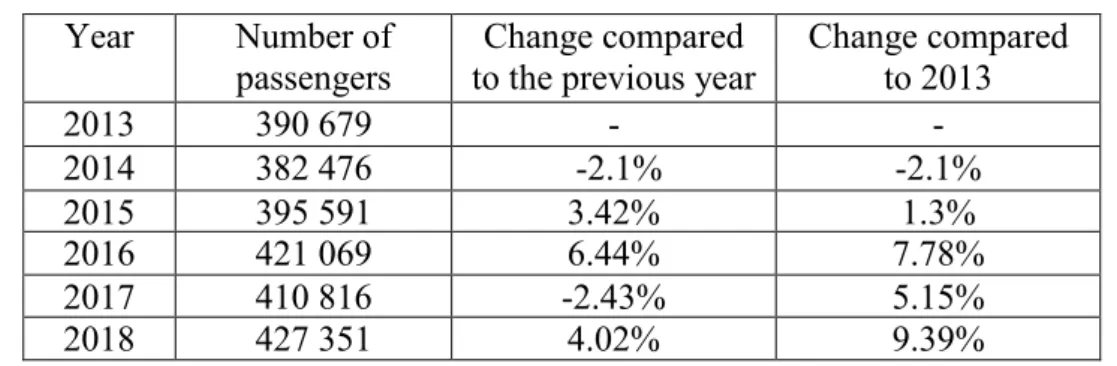
Table 1: Development of the number of tram passengers in Budapest (thousand persons) Year Number of
passengers Change compared
to the previous year Change compared to 2013
2013 390 679 - -
2014 382 476 -2.1% -2.1%
2015 395 591 3.42% 1.3%
2016 421 069 6.44% 7.78%
2017 410 816 -2.43% 5.15%
2018 427 351 4.02% 9.39%
Source: Based on BKV statistical database
The appearance or revival of trams typically induces the number of trips in the field of public transport. Owing to advantages such as comfort, flexible transport capacity, availability and accessibility, trams attract new users and convince those who used to use public transport rarely.
According to Table 1, the number of persons using tram transport increased by nearly 10% over 6 years in Budapest.
The service output constitutes the key of the appeal of trams
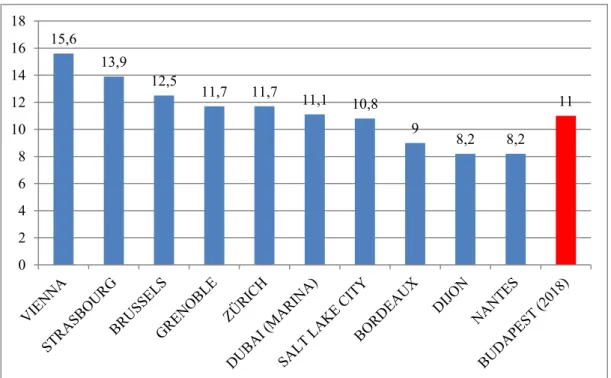
In case of tram networks with long traditions, the kilometre output per the number of population is higher than the average (for example Vienna, Brussels, Zurich). With its figure of 11, Budapest belongs to this category as well (The active train-km performed in 2018 was close to 19.3 million kilometres, and according to the data of the Hungarian Central Statistical Office, the population of the capital city was 1 749 734 persons). In cities well-equipped with metro lines – such as Barcelona or Lyon – the tram output per number of residents is typically lower.
In certain cities – such as Strasbourg or Grenoble – trams are used to serve both the structural main lines and also the surrounding settlements. In medium-sized cities (population of less than 500 thousand), the kilometre output per number of residents is lower, owing to the periodically decreased service level (for example during night and weekend periods).
Figure 2: Annual tram output per number of residents (train-km/person) Source: Eurogroup Consulting, amended by BKV data
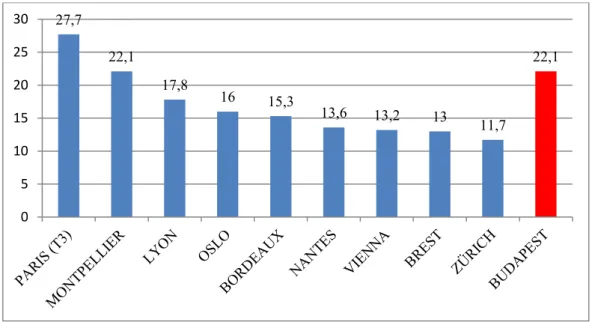
The number of passengers (the exploitation) is differs from area to area
In general, it may be declared that large cities with exceptional population may achieve higher passenger traffic ratios. For instance, the French tram networks follow the structural main routes developed along with the structure of the city, and the exploitation of these tram lines is therefore higher than average. The T3 line (sections A and B jointly) in Paris may also be highlighted, which runs along the Périphérique beltway of the city, and it achieves a daily passenger number of more than 280,000.
15,6
13,9
12,5 11,7 11,7 11,1 10,8
9 8,2 8,2
11
0 2 4 6 8 10 12 14 16 18
The use of the Budapest tram network may be considered as significant as well (the ratio value of 22.2 results from more than 427 million passengers and nearly 19.3 million train-kilometre output in 2018).
Figure 3: Number of tram trips in the ratio of the annual output (person/train-km) Source: Eurogroup Consulting, amended by BKV data
The operating costs are largely covered by fare revenues
If they manage to achieve a substantial level of passenger number (above 50,000 trips per day per line), then a larger ratio of the operating costs will be covered by the commercial revenues.
According to the research, on ad hoc basis they were even able to achieve fare revenues exceeding the operating costs. For example, in case of Dublin, the system is characterised by high ticket prices (2.10 Euros/ticket), and simultaneously the exploitation reaches 75,000 trips per day. Operating costs lower than the fare revenue allow for the difference to be spent on investments aimed at the modernization and development of the network.
Figure 4: Ratio of the operating costs of tram operations covered by the fare revenues Source: Eurogroup Consulting, amended by BKV data
27,7
22,1
17,8 16 15,3
13,6 13,2 13 11,7
22,1
0 5 10 15 20 25 30
118% 114% 111% 107% 105%
89% 83% 78%
70% 69%
55%
0%
20%
40%
60%
80%
100%
120%
140%
In case of Budapest the fare revenues and the social policy subsidies allocated to the tram branch of the integrated public transport system cover only approximately 55% of the expenses and costs. The ratio – of course – reflects the transport policy objectives of the decision makers as well, and in does not necessarily imply the efficiency of the operation.
The operation is like a “viscous cycle”
In case of transport systems with a history and great tradition, challenges – such as increasing capacities and the necessity of developments – will have to be faced in the course of time in order to maintain the appeal of the service. A tried and tested solution for this is that the cities concerned update and modernize their rolling stock and the related infrastructure elements through regular investments, and thereby they operate a continuously efficient tram network at an appropriate level of standard. This process describes a cycle the result of which is a reliable and regular service appealing and attractive to the passengers.
Figure 5: The cycle of the operation of the transport service Source: Eurogroup Consulting
The most important factors of the success of tram networks
Certain characteristics contribute to the level of standard of the service system and the efficient operation of the transport network, with the consideration of which characteristics it can be ensured that the acceptance and attractiveness of the tram transport prevails among the surface transport options within the city. Some of these crucial factors are the following:
The line service of the most frequented urban areas in terms of travel needs is primary, since this contributes to maintaining the high passenger number, moreover, to generating passenger traffic surplus as well.
Regular and reliable service,
and thereby winning over as
many passengers as
possible
Incresasing passenger number and increassing fare
revenues
The optimization of operating costs, making use
of the infrastructure and the vehicle fleet efficiently Improvement of
the cost recovery ratio
through the commericial revenues Release of
investment funds in order to
modernize and develop the tram network
In order to achieve the optimal circulation speed, it is necessary to favour trams to motor vehicle traffic on the traffic route concerned.
Network planning shall include the possibility of raising the capacity of the lines (extension of the length of the tracks, provision of power supply capacities).
It is advisable to involve the tram operator company, starting from the planning phase of the tram network. In connection with the maintenance of the tram operation, it is the most efficient if an integrated and maintenance system is established for both the vehicles and the infrastructure elements (thereby – for example – fast reaction time may be ensured).
The system of the service shall be capable of temporal flexibility, variability of the frequency of lines (for example: per time of day depending on the travelling need, or different service extent per season, meanwhile the supply remains attractive continuously).
Cooperation of appropriate level shall be ensured with the connecting bus network, other modes or railway, P+R parking and the pedestrian traffic, thereby facilitating multimodality.
It is necessary to build a single and connecting tram network (in order to enhance daily flexibility and economic efficiency).
Regular investments shall be realized in the fields of infrastructure and the rolling fleet (in order to maintain the attractive service).
An approach aiming at completeness shall be followed, which includes the urban planning, the transport and the sustainable development aspects as well.
A good example: Nice tram project
Let us see a specific, practical example for the realization of the objectives and principles formulated above (source: Tramways & Urban Transit magazine). In 2009, the leaders of Nice and its environs outlined a 20-year transport plan, which may provide a consistent response to the mobility needs of the region. The plan was fundamentally built on the establishment of new tram lines, which – in supplementing the already existing line – would serve the entire urban area. The focal point of the plan was the establishment of a new, east-west line, which could improve the traffic situation of the overcrowded public roads; furthermore, through the multimodal transport opportunities, it could allow for the complete renewal of the passenger transport service. They assumed that the tram development will affect the situation of the region as well, since due to its passenger attracting effect, less passenger vehicles would enter the city and significantly less busses would burden the roads, thereby reducing air pollution and the noise, and dividing the use of community spaces more efficiently.
Consistently with the ideas, building on the success of the 9.2 km long tram line marked T1 – which had already been launched previously – the 11.3 km long tram line marked T2 was planned, with 20 new stops in total. Two branch sections were planned at the west end of line T2: one connects an office centre (CADAM), and the other the two terminals of the city airport to the network. The works commenced in October 2013, the construction was carried in phases, and the last section was handed over as scheduled, at the end of 2019. A crucial feature of the line marked T2 is the 3.2 km long underground section (in the city centre the tracks are led underground and reach the city harbour, which constitutes the terminal), which contains four stops. The solution of carrying out construction underground in the city centre prevents the community space from being burdened any further in the centre of Nice, and it protects the 19th
century architectural heritage. Another advantage is that with the help of the underground section, the travelling speed of the transport service is expected to be optimized in the critical city centre.
Figure 6: The existing and planned elements of the tram network of Nice Source: www.frenchrivieratraveller.com
Another development concept is the construction of the 7 km long tram line marked T3, between the Saint Isidor terminal and the airport (including a 3.3 km long section where the line would travel on a same section as line T2).
Related to the tram network expansion, 2500 trees will be planted and 60% of the route is made up of grass-covered tracks. The trams planned for tram lines T2 and T3 can operate without overhead wires, their batteries are charged in 20 seconds while standing at the stops. The batteries are also charging between the stops by regaining the braking energy, therefore nearly 30% of the energy is reused, thereby reducing the costs and the environmental impact.
This practical example also proves the advantages that may be brought about if the development directions and concepts related to (public) transport are managed to be included in the urban development concept, since in this way the results to be achieved may facilitate the achievement of the sustainability and liveability objectives. (The T2 and T3 line construction project of Nice won the annual Global Light Rail award in London 2018.).
Conclusions
“The civilization and the urbanization are inseparably intertwined and mean the same thing.”
(Cerdá, 2013). In the coming period, cities will have to respond to the challenges of sustainable development in order to survive civilization (Bajnai, 2018).
Nowadays, the principle according to which local transport shall be developed in a well-though- out manner (or expediently in conformity with the regional networks) in order to achieve the
sustainability and liveability objectives is becoming more and more trivial from the urban policy point of view.
With regard to the development of transport systems, the environmental impact – thus, for example, the level of harmful emissions, the space intensity and the noise pollution – is an important point of assessment for city managers, considering that the different modes of transport have different characteristics with respect to the above. The results of international surveys imply that strengthening the role of community transport is the most important mobility objective from the point of view of sustainable development of cities.
As the concentration of population increases, and due to congestions becoming more and more frequent, finding solutions for travelling within cities usually becomes increasingly difficult, consequently, one of the possible break-out directions can be the operation, development and/or extension of rail-bound transport systems.
References
1. Bajnai L.: A fenntartható urbanizáció kihívásai, In: Tózsa István (szerk.) Közszervezései és közigazgatástani műhely – Fórum 2016: Tanulmánykötet, Budapest, Magyarország: E-Government Alapítvány a Közigazgatás Modernizációjáért, (2018) pp. 67-81., 15 p.
2. Budapest Climate Strategy, In: Budapest Főváros Városépítési Tervező Kft. and ECRS Magyarország Kft., commissioned by the Budapest-Capital Municipality, March 2018, pp. 48-51.
3. Budapesti Mobilitási Terv (Stratégiai) Környezeti Vizsgálat (Budapest Mobility Plan (Strategic) Environmental Assessment), In: ÖKO Zrt. and Fleischer Kutatási Periféria Kft., April 2019, pp. 86-89.
4. Cerdá I. 2013. Az urbanizáció általános elmélete. Scolar Kiadó, Budapest. 238 p.
ISBN: 978963-244-496-3.
5. Káposzta, J. – Nagy, H. (2015): Status report about the progress of the Visegrad countries in relation to Europe 2020 targets, European Spatial Research and Policy, Vol. 22, No. 1., pp. 81-99, DOI: 10.1515/esrp-2015-0018
6. Szűcs A.-Káposzta J. (2018): A Gyöngyösi járás településeinek komplex fejlettségi rangsora és dinamikája. TERÜLETI STATISZTIKA 58:(5) pp. 489-504. ISSN 0018- 7828
7. Trams at the heart of the 21st century metropolis, In: Eurogroup Consulting (www.eurogroupconsulting.com/en/news/publications), 2nd July 2019, pp. 20-25, p.
43. Tramways & Urban Transit magazine, September 2019, No. 981, pp. 342-344.
8. Transport, Greenhouse Gas Emission and Air Quality, In: Institute for Sensible Transport (www.sensibletransport.org.au), April 2018, pp. 2-4.
9. WHITE PAPER Roadmap to a Single European Transport Area – Towards a competitive and resource efficient transport system, European Commission, COM(2011) 144, Brussels, 2011.3.28., pp. 9-19.