A COMPARATIVE ANALYSIS OF THE WHEAT VALUE CHAINS IN HUNGARY &
TURKEY Nazli Ceylan
PhD student
Enyedi György Doctoral School of Regional Sciences, Faculty of Economics and Social Sciences, Szent István University
E-mail: nceylan82@yahoo.com Abstract
Besides being a crucial component of human nutrition, wheat has been one of the strategic commodities in the world economy since ancient times. Self-sufficiency in staple food production considered being an advantage for a country, thus many countries try to improve crop production technologies as well as whole supply chains to achieve sustainability. The wheat sector became more competitive with globalization and increased number of bilateral free trade agreements. Therefore, it is crucial to create an efficient wheat supply chain to achieve strong competitive power in international markets. Regarding wheat production, Hungary and Turkey ensure food security although they have different market structure and conditions.
This study aims to investigate and provide a snapshot of how wheat sectors in Hungary and Turkey, focusing on basic stages of the wheat value chain such as production, processing, logistics and sales. The study mainly depends on statistical data with analysing them on the country level. The subject field is looking to investigate the main trends of the wheat market in Hungary and Turkey, also takes a glance of existing policies and how the government’s role in the wheat market differs.
Keywords: Value chain, wheat sector, economic development, cereals JEL classification: O57, Q11, R11
LCC: HD1401-2210 Introduction
Hungary has significant cereal production by means of its favourable climate and fertile lands.
Hungarian agricultural production plays an important role in the European Union and regarding cereal production, the country ranks 8th among the EU-28 (Strategie Grains, 2018). With 7.3 million hectares productive land and 5.3 million hectares utilised agricultural area (Dancshazy et al., 2015), Hungary is self-sufficient in terms of many agricultural commodities, especially staple crops like maize and wheat. These crops also have a significant share in the exportation of agriculture products that makes the governance of their supply chains more important.
In Turkey case, the wheat sector has different characteristics. Yearly over 20 million tonnes production meets domestic consumption and the country itself considered as self-sufficient.
However, a significant amount of wheat needs to be imported yearly to ensure sustained wheat flour export. The market also differs from Hungarian wheat market on the government’s role in the market, subject of policies and regulations. The paper examines similarities and differences across multiple aspects of their agricultural sectors and policies.
Material and Methods
This study provides a comparative analysis of the Hungarian and Turkish wheat sectors. As background for the comparisons that follow, the study provides an overview of statistical comparisons of these two countries. Emphasis is on the key indicators relating to the value chain stages; wheat production, yield trend, consumption pattern and domestic/foreign trade.
The analysis mainly based on statistical data and official price time series available from the Hungarian Central Statistical Office, FAOSTAT, International Grains Council, Statistical Institute of Turkey and Research Institute of Agricultural Economics of Hungary. The general frame of analysis is constituted of the five recent years, as long-term trends begin from 2004.
Key Statistics About Wheat in Hungary & Turkey
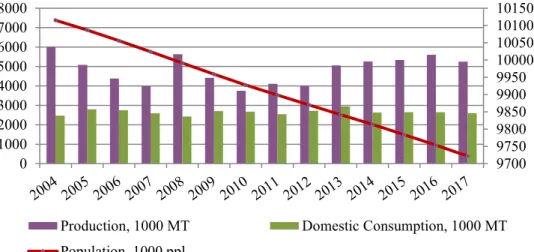
Cereal production plays a central role in Hungary. The most substantial type of cereal in Hungary is wheat, which accounted for 73% of total cereal production in 2017 (this proportion was 71% in 2016). Common wheat forms a large part of total wheat production in the country, yet feed wheat is also produced in considerable amounts. The share of wheat within all cereals forms 37%, which makes its rank second after maize. As the population growth rate is negative in the country, domestic consumption volume stays stable (Figure 1). Besides stable consumption, increasing production results higher wheat export.
Figure 1: Domestic Consumption, Production and Population Growth – Hungary Source: Author, based on FAOSTAT, KSH data
The average area harvested over the past decade is approximately 1 million hectares. The production shows a downward trend between 2004-2008 reflecting the relatively smaller harvested area and lower yield. The yield increase in 2008 results a record production, however in the later years wheat production shows an up-and-down trend due to yield fluctuations.
Figure 1 uses FAOSTAT and Central Statistical Office data to present total wheat production and consumption in Hungary from 2004 to 2017, compared with population growth. As can be seen from the figure, the population growth is on a constant decline. It decreased by 4% since 2004, from 10.115.081 to 9.721.559. In the same figure, consumption shows a more stable trend, especially in the last four years domestic wheat consumption in Hungary became settled at 2.6 million tonnes per year.
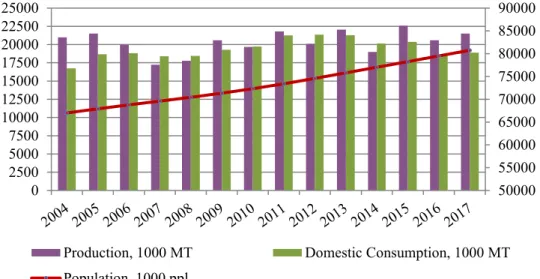
In the same period, harvested area of wheat in Turkey decreased from 9.3 million hectares to 7.8 million hectares as producers planted less due to high input prices and low profit. Despite
9700 9750 9800 9850 9900 9950 10000 10050 10100 10150
0 1000 2000 3000 4000 5000 6000 7000 8000
Production, 1000 MT Domestic Consumption, 1000 MT Population, 1000 ppl
the downward trend in harvested area, increase in yield kept the production volume stable. In the same period wheat production volume varied between 19-21 million tonnes with the exception of the 2007-2008 food crisis period (17-18 million tonnes). Considering the population growth trend (Figure 2) and decreasing harvested area, yield increase plays a crucial role in ensuring food security in the future.
Figure 2: Domestic Consumption, Production and Population Growth – Turkey Source: Author, based on FAO-AMIS
As seen in Figure 2, the consumption of wheat has generally gone parallel with production over the last 3 years. The period from 2011 to 2013 shows the greatest increase in wheat consumption; rising to an all-time high of 21.3 million tonnes in 2013. All wheat consumption in Turkey falls into the category of food, feed, seed and industrial use. Total domestic utilisation of wheat was 18.9 million tonnes in 2017; food consumption was 15.1 million tonnes, use of seed 1.7 million tonnes, the use of feed 1 million tonnes (see Table 1), while consumption per capita is 182 kg (TMMOB, 2018). Generally, the country is self-sufficient in terms of wheat production. None the less, for some years due to adverse climatic conditions or quality problems, production could not meet demand and considerable volume was imported.
Production
Hungary is a landlocked country, a European Union member state with no coastline. According to the European Commission’s Common Agricultural Policy (CAP) report for Hungary, agriculture is characterised by small farms: nearly 85% of the 500,000 farms have less than 5 hectares of land (European Commission, 2016). The agricultural area size and the production endowments of planning and statistical regions are very different, so their output, too. In comparison with its agricultural area, Southern Transdanubia has a considerably higher share in the national output of cereals and industrial crops, Central Hungary, Northern Hungary and Southern Great Plain in the output of horticultural products, grapes, wine and fruits, and Southern Great Plain and Central Transdanubia in the output of live animals and animal products.
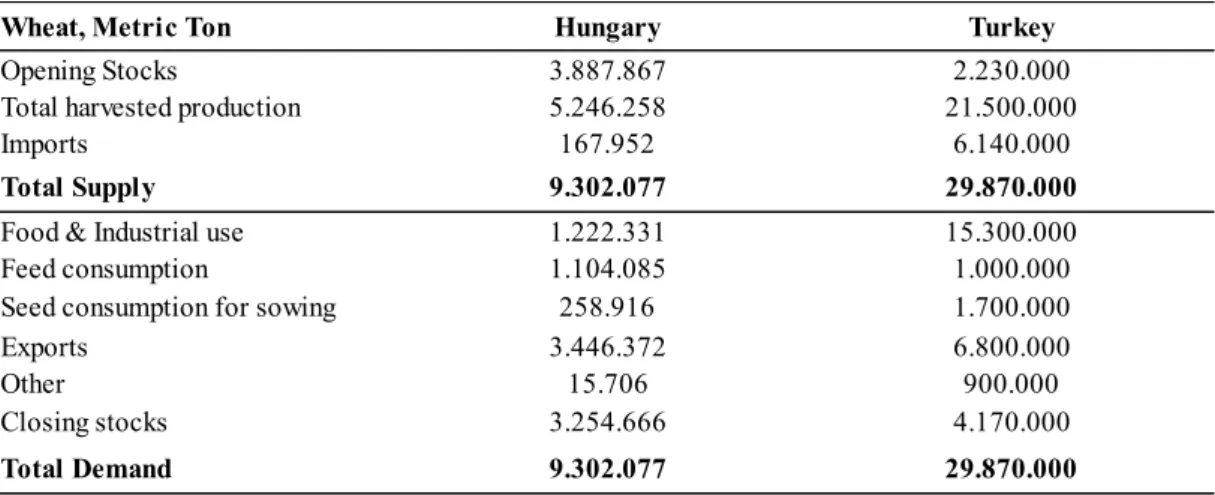
In the 2017/18 period, wheat production in Hungary is 5.2 million tonnes with 8% decrease in comparison with previous year. In same period, domestic consumption and export were 2.6 and 3.4 million tonnes respectively (Table 1). The supply and demand situation shows that Hungary is a self-sufficient country and a net exporter in terms of wheat. According to Hungarian Central
50000 55000 60000 65000 70000 75000 80000 85000 90000
0 2500 5000 7500 10000 12500 15000 17500 20000 22500 25000
Production, 1000 MT Domestic Consumption, 1000 MT Population, 1000 ppl
Statistical Office data, wheat export forms more than half of the total demand. In particular, wheat exports increased in last three seasons due to ample supply. Feed consumption decreased comparing with previous years while overall industrial use rose to 1.2 million tonnes. In 2017, wheat seed use in Hungary was 258.916 tonnes. Though Hungarian wheat seed consumption fluctuated substantially in recent years, it tended to decrease through 1967 - 2017 period ending at 258.916 tonnes in 2017. Considering regional distribution of outputs, Southern Great Plain region is leader in cereal production with 21 percent share in total country production. Both the Southern Transdanubia and the Northern Great Plain regions follow Southern Great Plain with shares of 19 percent and 18 percent respectively (KSH, 2017). The Southern Great Plain is the major wheat producing region in Hungary with 1,1 million tonnes of wheat production.
Although it has a relatively lower average yield than second major producing region the Southern Transdanubia, a higher harvesting area allows region to produce more. The Central Hungary region seems to have both the lowest yield and lowest production volume in the country. The Southern Transdanubia has the highest, with 6,140 tonnes per hectare while the Central Hungary has %18 lower, 5,010 tonnes per hectare.
Table 1: Wheat Supply & Demand
Source: KSH, FAOSTAT, 2017
Wheat production volume was 21.5 million tonnes in Turkey. With 2.2 million tonnes opening stocks and over 6 million tonnes import total supply reached to 30 million tonnes (Table 1).
The export volume was 6.8 million tonnes, reflecting also the wheat equivalent of processed commodities such as wheat flour, pasta etc. It can be seen on Table 1, that industrial use takes the major share of wheat utilisation in Turkey while feed use was approximately on the same level with Hungary. Wheat can be grown in all regions of Turkey yet produced widely in Central Anatolia. In 2017, the Central Anatolia Region ranks first with a share of 32% in the production of common wheat. This is followed by the Marmara Region with 18% and Southeast Anatolia Region with 15%. The regions with the least production are Eastern Anatolia and Aegean Regions.
In Hungary, soil and climate are suitable for seed production and multiplication, not only for national needs but also for export. Wheat production volume in Hungary has been variable;
however yield level seems on the rising trend since 2012 and reached its highest level over the past three years. The average yield of wheat continues to grow with the impact of different cultivation technologies (extensive/intensive) and environmental factors. A %6.5 lower production of wheat was harvested in 2017 from a %7.9 smaller area than a year earlier; the average yield was 5.4 tonnes/ha, the highest in Hungary since 1988. Yield average seems below the EU-28 average, yet it is still quite above the world average (Figure 3).
Wheat, Metric Ton Hungary Turkey
Opening Stocks 3.887.867 2.230.000
Total harvested production 5.246.258 21.500.000
Imports 167.952 6.140.000
Total Supply 9.302.077 29.870.000
Food & Industrial use 1.222.331 15.300.000
Feed consumption 1.104.085 1.000.000
Seed consumption for sowing 258.916 1.700.000
Exports 3.446.372 6.800.000
Other 15.706 900.000
Closing stocks 3.254.666 4.170.000
Total Demand 9.302.077 29.870.000
Figure 3: Wheat Yield Comparison Source: International Grains Council
According to a study on the determinants of wheat yield (Vigani et al., 2015), Hungarian farmers consider climate change and seasonal weather conditions as the main factors affecting productivity. A recent study (Fogarasi et al., 2016) about climate effects on Hungarian winter wheat emphasise a slight yield decrease for wheat is estimated for the next three decades as a result of changes in climatic conditions. Adverse effects of climate change may arise in every stage of the chain; however, production stage has vital importance as it is the starting activity of value creating. Hungary faces important imbalances between droughts and floods therefore, it is important to focus on more efficient water management to mitigate the possible risks.
In Turkey, although average wheat yield has a rising trend since 2007, it is still 20% below the world level (3.47 in 2017). High-quality seed use is one of the important factors affecting the productivity of wheat. The seed sector in Turkey extended rapidly after the new seed law came into force in 2006. The production capacity of public and private sector has improved with the assistance of government policies supporting certified seed usage and domestic seed production. Turkish farmers have been using fewer saved seeds for the following years’
planting season for all crops, but still saved seeds represent the majority of seed sources for wheat and barley production. Ministry of Agriculture has implemented a subsidy program to farmers for domestically produced certified seed usage since 2005 (in 2016 subsidy for wheat 8.5 TL/decare). The amount of certified seed produced in the country was 210 thousand tons in 2007 and increased to 508 thousand tons in 2017.
Post Production Flour milling
According to the Research Institute of Agricultural Economics (AKI), there are 45 flour mills in Hungary, with a total capacity of 251.6 tonnes/hour, based on 2017 figures. In 2015, the sector produced 1 million ton of flour. Average capacity utilisation is 60%. All the wheat, rye and durum flour produced in Hungary are made using domestic wheat. One out of four of the firms are estimated to carry out more than 80 percent of the flour production in the country.
1 2 3 4 5 6 7
Hungary Turkey European Union (28) World Average
Yield tons/ha
Figure 4: Wheat Flour Trade - Hungary Source: Author, based on FAOSTAT data
The flour export quantities of Hungary gradually showed an increasing trend between 2004- 2016 period (Figure 4). The exported amount of flour in 2016 was 198 thousand tonnes. The highest flour import amount of Hungary over the last decade has been accomplished in 2011 with 79 thousand tonnes. The imported flour amount in 2012 decreased to 75 thousand tonnes and this amount decreased down to 44 thousand tonnes in 2016. Among the EU Member States, Romania (56%), Slovakia (25%) and Croatia are the main markets, but some thousands of tonnes were imported from Poland, Austria, Italy and Slovenia. Eight partner countries outside the EU bought 1.6 percent of the flour, most of them (2.250 tonnes), but a few hundred tonnes went to Bosnia and Herzegovina and Ukraine.
As seen in Figure 5, despite slight fluctuations in the early 2000s, wheat flour export had an upward trend since 2004 which made Turkey one of the world's leading flour exporters.
According to the International Trade Centre (ITC) data, Turkey took first place in wheat flour export in 2018. For this reason, besides domestic consumption, the most important wheat demand in the sector comes from flour mills. In addition, the poultry sector, which is the subject of the feed industry and export, has also significant demand for wheat.
There are roughly 700 flour mills in Turkey with a total yearly capacity of 27.5 million tons.
More than half of these mills are concentrated in the Central Anatolia, Marmara and Blacksea regions. As mentioned above, the Central Anatolia and Marmara are top regions in wheat production and flour milling is also improved accordingly. In the Blacksea region, the flour milling sector has been improved due to wheat imports from the Russian Federation, thanks to its geographic proximity, freight advantage and high quality. Total flour production capacity in Turkey is estimated to be 32.5 million tonnes while the actual production is about 14.5 million tonnes. Current production capacity is three times more than yearly domestic consumption. The world average of capacity utilisation is 65% though this ratio is 45% for Turkey (Cerkezkoy Ticaret ve Sanayi Odasi, 2017).
0 25 000 50 000 75 000 100 000 125 000 150 000 175 000 200 000 225 000 250 000
Import Export Export Trend
Figure 5: Wheat Flour Trade - Turkey Source: Author, based on FAOSTAT data
One of the main reasons for rapid development of wheat flour sector is the country’s close proximity to major wheat flour importers. Turkey exports wheat flour to countries across a wide geographical range, including the Middle East, North Africa, and the Far East. Another reason for Turkey’s leading role in wheat flour exports is the Inward Processing Regime regulation, which is related to Turkey’s export incentive system. The aim of the Inward Processing Regime is to enable Turkish exporters to increase competitiveness and supply goods at world market prices for production of their export commodities (USDA, 2018).
Feed production
According to the Hungarian Central Statistical Office data, average yearly feed wheat consumption in Hungary is 1.15 million tonnes (5 years average). There are 254 compound feed plants with total capacity 1717.1 tonnes/hour (AKI, 2017). The volume of industrial mix feed produced for farm animals sold 260 thousand tonnes on the external market by 34 percent, and the value of 147 million euros is up by 51 percent in 2014 as a result of the 13 percent increase in the average price at the border. 66 percent of export value came from exports to EU- 28 countries, Romania is the main destination, but significant volumes went to Slovakia, Belgium, Czech Republic, Poland and the Netherlands. Figure 6 illustrates the different uses of feed wheat. As seen from the figure, the poultry sector had the biggest demand for wheat while wheat for cattle production was the lowest.
Compound feed production in Turkey increased by 8% to 24 million tonnes compared with the previous year. In the same period, broiler feed production also reached 5.3 million tonnes (+12%) while feed for laying hen was 3.6 million tonnes (+7%). With other feed varieties, overall poultry feed production raised to 9.8 million tonnes (+10%). Fish feed production was 446 thousand tonnes in this period.
0 500 000 1 000 000 1 500 000 2 000 000 2 500 000 3 000 000 3 500 000 4 000 000
Import Export Export Trend
Figure 6: The Feed Use of Wheat in Different Livestock Diets Source: AKI, 2017
Rapid urbanisation and intensive farming in Turkey caused a significant increase in the feed use of commercial feed for animal production. In the 2004-2016 period, compound feed production in Turkey increased from 6.9 million tonnes to 20.4 million tonnes. Feed sector is %44 dependent to import and this rate is expected to reach 51% in 2025 (Turkish Grain Board, 2017). According to government and industry sources, there were 515 feed factories active in Turkey with more than 30 million tonnes of yearly production capacities in total. The feed sector has grown on average 10 percent annually since 2010, despite a slowdown in 2016.
Presently the Turkish feed industry is among the world’s top twelve producers and in the top five in Europe. According to feed sector representatives, the sector is projected to grow in the coming years and has goals to reach 30 million tonnes by 2023 (USDA, 2018).
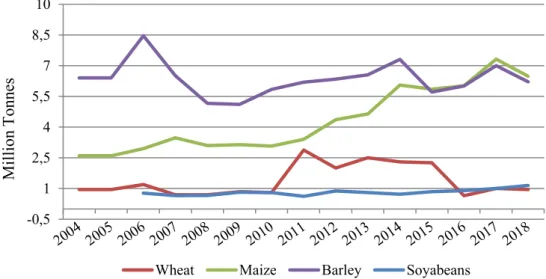
Figure 7: Domestic Feed Use of Major Grains in Turkey Source: International Grains Council, 2017
Feed use of wheat was relatively low compared with other grains such as maize and barley.
Figure 7 shows a long term trend of domestic feed grain use. As seen from the figure, share of feed wheat fell to 1.2 million tonnes while feed use of maize in an incremental rise in the same period. Feed use of soybean shows a relatively steady trend. It is also worth to mention that
Pig Poultry Broiler Laying Hen Duck/Geese Turkey Cattle
2017 2016 2015
-0,5 1 2,5 4 5,5 7 8,5 10
Wheat Maize Barley Soyabeans
MillionTonnesTonnes
feed use of soybean was slightly more than wheat since 2016 and soybean imports in Turkey doubled since 2010.
Transport and Storage
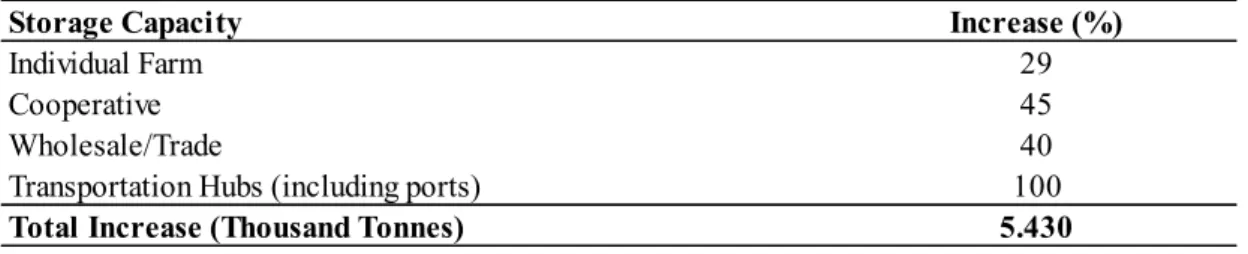
Storage system and transport play an important role in every stage of the value chain. Especially in the harvest season and in the following months, there can be strong pressure on these two elements of the value chain. In these periods, the heaviest pressure falls on storage facilities managed by individual farms and by farming cooperatives, as these are usually the first to handle the bulk of harvested production. If the storage capacity cannot meet the capacity needed, farmers have to sell their product as soon as possible and this may affect market prices to the detriment of producers. In some situations, agribusiness cooperatives may also operate as processors and have significant storage capacity. This storage capacity can ease some of the pressure felt by individual farmers and farming cooperatives in case of exceptional harvest volumes.
As a net wheat exporter country, with an annual production of around 5 million tonnes annual exports of 2-3 million tonnes, Hungary increased cereal storage capacity after the EU accession in 2004. Already within the pre-accession agricultural support program SAPARD, about 1.4 billion forints (5.5 million euros) were allocated for investments into storage facilities. In 2005, the cereal storage capacity was 14.7 million tonnes and most of its storage facilities relied on outdated technology. With the support of the EU SAPARD program and of the national Regional Development Program (RDP) storage capacity increased by 5.4 (+37%) million tonnes (Table 2) and reached to 20.1 million tonnes between in 2015. Public funding broadly co-financed by the European Agricultural Fund for Rural Development (EAFRD), through RDPs has been mostly oriented for small/medium scale projects and focused on production stage. Besides public policies and support as well as the privatisation of the former state-owned agribusiness system have played a critical role in determining the improvement of the cereal storage facilities in Hungary. Especially record harvest in 2005/2006 season caused the largest intervention purchases and huge cereal stocks promoted investments in storage facilities.
Investments in additional storage capacity, especially at the farm level, allowed the country to store all of its cereal production without any sales pressure. Most of the investments in additional capacity were made at the wholesale/trade level in Hungary and the current Hungarian RDP (2014-2020) allocates again around 20 billion Forints (65 million euros) for investments in small scale storage facilities (max 5 000 tonnes) and dryers.
Table 2: Cereal Storage Capacity in Hungary by Level of Supply Chain (2005-2015)
Source: European Commission, 2017
Hungary’s geographical position has a big influence on logistics, especially for the country’s export. With the average 5.3 million tonnes of annual wheat production (2013-2017 average) and huge storage capacity increase after EU accession, the country has a surplus of storage capacity. However, these granaries are not evenly distributed among the different regions. The storage facilities are mainly concentrated in the Northern and Eastern regions.
Storage Capacity Increase (%)
Individual Farm 29
Cooperative 45
Wholesale/Trade 40
Transportation Hubs (including ports) 100
Total Increase (Thousand Tonnes) 5.430
The country’s logistical infrastructure shows improvement, but inefficiencies are still present:
the loading/unloading capacity at rail-served facilities should be increased, bottlenecks from insufficient fairway conditions on the Danube River, affecting barge transportation of crops, and should be addressed as well. The significant increase in the Hungarian surplus of storage capacity allows concluding that the country is well equipped to sustain its current production and export performance also in the long term. Cereal exports from Hungary through the Danube River and the Constanta port of Romania have steadily increased in recent years (European Commission, 2017).
Table 3: Cereal Storage Capacity by Sector - Turkey
Source: Turkish Grain Board Cereals Report, 2017
Turkey has different grain storage conditions comparing with Hungary. The total storage capacity of the Turkish Grain Board (TGB) is 4.5 million tons with 546.700 tons of this capacity located in ports. The TGB provides services for the agricultural industry, with facility teams and temporary receiving centres throughout the country that can increase their operations during peak procurement periods. The TGB also leads licensed warehousing operations in Turkey since the Licensed Warehousing Law of Agricultural Products was enacted in 2005. The warehouse receipt system has a wide range of advantages for the sector, such as introducing agricultural products into the market in line with quality standards and warehousing products under suitable conditions (Cetiner & Koksel, 2015).
Sales
According to Hungarian Statistical office data, domestic utilisation of wheat is relatively stable (five years average is 2.6 million tonnes) and it fluctuates between 47 and 52 percent of overall production volume. Wheat consumption for industrial processing seems to be increased slightly between 2013-2017 (see Table 2) from 1.17 million tonnes to 1.22 million tonnes, while feed consumption remained almost the same. Average wheat volume for seed use in the same period was 260 thousand tonnes.
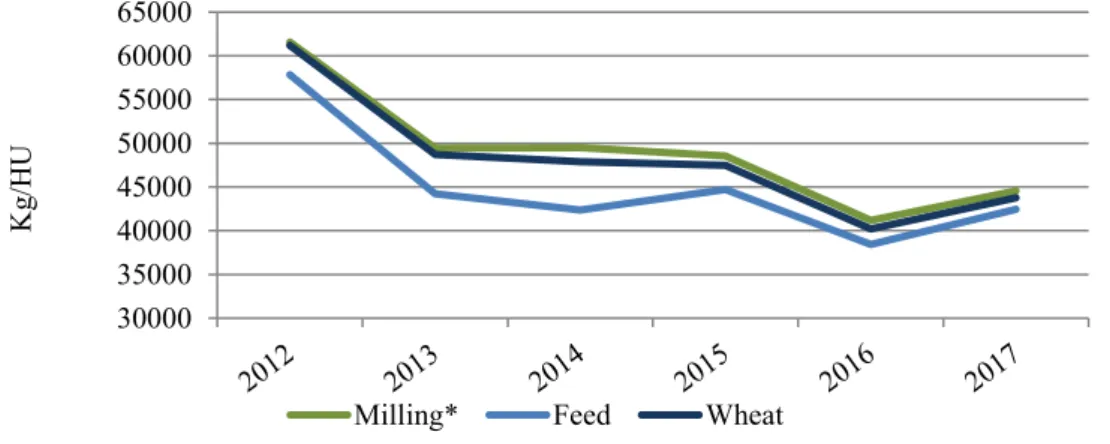
Figure 8: Producer Price (Farm Gate) for Wheat in Hungary Source: Market Price Information System1
1 Milling, feed, durum, extra altogether. The price is weighted average price, without VAT and transport costs.
Storage Capacity Million Tonnes
Turkish Grain Board 4,3
Private Sector 20,2
Total 24,5
30000 35000 40000 45000 50000 55000 60000 65000
Milling* Feed Wheat
Kg/HU
Figure 8 illustrates farm gate producer price trends since 2012. As it’s clear in the figure, both milling and feed wheat varieties have a downward trend in parallel to world wheat price trend.
Average wheat farm gate producer price decreased almost 28 percent between 2012 and 2017, reflecting ample domestic wheat supply. In 2014, a decline in feed wheat price was higher than the milling wheat price as both types slightly increased in 2017.
Table 4 : Wheat Price Comparison Across the Value Chain
Source: Market Price Information System2
Processed products in the wheat sector also followed the same trend since 2012 with 21 percent fall in the processor’s sale price of bread flour. Feed wheat processor’s sale price has moderate decline comparing with milling wheat. In the same period, a decrease is 8 percent for processor’s sale price of poultry feed and 19 percent for sale price of pig feed (Table 4).
Table 5: Wheat Price Comparison - Turkey
Source: Turkish Grain Board, 2017
Table 5 presents the price change of AKS3 (Anatolian Hard Red Wheat) wheat in Turkey and also Russian wheat in the last five years. Russian wheat has a comparative advantage against other origins due to its freight advantage and quality. It can be seen that in recent years, AKS price shows an increasing trend while Russian wheat price decreases. This trend mostly arose from the high production cost of wheat in Turkey. Accordingly, in this period the domestic market was protected by state interventions and high tariffs.
2 The price is weighted average price, without VAT and transport costs.
3 AKS average wheat price is calculated from daily prices from Konya, Polatli, Edirne and Eskişehir Commodity Exchanges. World prices are calculated from daily prices received from Reuters.
Year
Farm Gate Price (Milling)
Processor`s Sale Price
Farm Gate Price
Processor`s Sale Price
Processor`s Sale Price (Bread Flour) (Feed) (Poultry Feed) (Pig Feed)
2012 61.569 83.670 57.836 96.044 85.270
2013 49.437 81.110 44.217 103.541 87.447
2014 49.498 74.690 42.362 92.991 77.352
2015 48.537 73.370 44.724 92.531 76.153
2016 41.189 69.070 38.435 91.808 72.494
2017 44.533 66.250 42.453 88.200 69.244
Year
AKS Wheat (TMO Purchasing
Price)
AKS Wheat (Commodity Exchange Price)
Russian Wheat (FOB $/t)
$/TRY Exchange
Rate
Russian Wheat (FOB TRY/t)
Import Tariff Rate (%)
2013 665 763,3 307 1,906 585,1 130
2014 720 870,8 269 2,191 589,4 130
2015 862 875,6 207 2,724 563,9 130
2016 910 959,5 180 3,025 544,5 130
2017 940 1027,0 184 3,652 672,0 45
Wheat Export
Hungary has a positive trade balance regarding wheat. Although major exportation product in the cereal trade of Hungary is maize, wheat export of Hungary shows an increasing trend in last 3 years (+76%) due to high level opening stocks and abundant production volume. According to Hungarian Central Statistical Office data; the wheat exportation quantities of the country fluctuated between 1.9 and 3.4 million tonnes over the last 5 seasons. The highest export volume was accomplished in 2017 season with 3.4 million tonnes.
Turkey’s wheat export has grown three folds in last decade and mainly relied on processed products such as wheat flour and pasta. Wheat flour sector expanded with strong demand from neighbouring countries, available capacity and inward processing regime. The other advantage for wheat flour exporters is that the by-products of flour making are very valuable in the domestic market as inputs for animal feed producers. Wheat bran was 740TL/ton ($196 per ton) in domestic market as of February 2017, though it was only $170 in the international market.
The high demand for by-products of flour production contributes to Turkish flour exporters’
global competitiveness. (USDA, 2018).
Figure 9: Major Wheat Export Destinations Source: Author, based on FAOSTAT data
Figure 9 presents a comparison of major export destinations of Hungarian and Turkish wheat in 2016. The left graphs show that main exporters of Hungary were European Union member states; Italy, Romania, Bosnia and Herzegovina and Austria (Romania's imports are believed not only to serve domestic use but also re-exporting purposes) while Turkey’s export market mostly consists of its neighbouring countries. As seen from the figure, Iraq takes the first place with almost half of the export share while Syria follows it with %13 share.
Comparison of Market Regulations
Government interventions play a significant role to ensure food security and sustainability of the wheat market in Turkey. The price of wheat decreases during the harvest period due to lack of storage opportunities of producers and also their financial needs. Wheat amount procured by the Turkish Grain Board was 2.3 million tonnes in 2018. Over the last twenty-five years, the TGB procurement ratio in total production is the highest in 2013 with %25.8 and this ratio was between %9-10 in last three years.
Turkey Hungary
As an EU member country, the wheat market in Hungary is subject to the Common Agricultural Policy. Agricultural and Rural Development Agency (ARDA) is the only Paying Agency for the Common Agricultural Policy (CAP) in Hungary, and is responsible for the implementation and execution of all kinds of agricultural and rural development support activities regardless of their financial resource or the type of the measure such as interventions and direct payments.
The fixed-price intervention purchases can be used only in case of wheat; the rate is maximised at European level at 3 million tonnes. The quantity of wheat that may be offered for intervention is 80 tonnes, the amount of security to be lodged is 20 €/t. Tender purchases are available only if the European Commission opens the relevant tender. In the case of this method the producers who offered grain make an offer on the purchase price and the Commission purchases the cheapest deals of the period. This method is available for corn, barley, wheat and sorghum as well. Intervention cereals can be sold to the Member States if the quantity of stored cereals is below 5000 tonnes.
Another measure to regulate the domestic market is tariffs implied by the government on grains.
Within the scope of a set of measures to fight rising food inflation in Turkey, the Turkish government reduced the import tariff on wheat, barley and corn from 130 percent to 45, 35, and 25 percent respectively in 2017. In Hungary’s case, The EU limits the entry of lower-priced grains from non-EU countries through a system of import duties and quotas. EU Commission import duties on cereals are calculated as the difference between 155% of the intervention price (€101.31/t) and the world market price, but never higher than the bound rates (€95/t for soft wheat). It is worth to mention that wheat Hungary’s wheat trade mostly relies on neighbouring member states.
One of the major differences between Turkish and Hungarian wheat market is that a number of Turkish agricultural exports benefit from Turkey’s IPR (inward processing regime) policy.
Under the IPR, grain processors may import wheat duty-free when they register grain exports, such as wheat flour, pasta and biscuits exports. This system provides an opportunity for exporters to increase value-added commodity production while importing inputs tariff-free (USDA, 2018).
Results and Discussion
Turkey and Hungary share similar conditions in regard to self-sufficiency and food security, however, the market structure is totally different at various stages of wheat value chains. In the production stage of the value chain; both countries’ show small scale farmer profile. In terms of yield, countries achieved improvements in the last decade. In 2017 average wheat yield in Hungary was slightly under EU-28 average (5.84 tonnes/ha), the country outperformed average yield in Turkey (2.76 tonnes/ha). On the other hand, wheat yield in Hungary was two times higher than wheat yield in Turkey. They also differ in terms of storage capacity. With yearly over 5 million tonnes of wheat production, Hungary owns over 20 million cereal storage facilities which allow the country to store all of its cereal production without any sales pressure.
In this term, Turkey faces occasional challenges especially, in bumper harvest seasons. Besides its 24,5 million tonnes of cereal storage capacity, silo-bag technology was introduced by the Turkish Grain Board in 2014 as a short term alternative to ease harvest pressure. In addition to this, investing in building new silos takes part in the country’s agenda.
One of the remarkable differences between these two countries is Hungary being a net wheat exporter while Turkey performs significant yearly import operations for the wheat flour sector’s use. Trade relations are geographic proximity-based in both as the majority of Hungary’s trade is with EU member states while Turkey imports mainly from Russia and exports to Middle
Eastern countries. Finally, the role of the state is also shown different characteristics. As a European Union member, Hungary reflects the Union regulations on low-level market interventions while the Turkish Grain Board supports producers and processors with buying/selling operations to ensure sustainable wheat production in the country.
References
1. Agricultural Market Information System: Retrieved January 30, 2019, from http://statistics.amis-outlook.org/data/index.html#COMPARE
2. Cetiner B., Koksel H. (2015): Grain Science and Industry in Turkey: Past, Present, and Future, AACC International - Future of Grain Science Series, March - April 2015, Vol.60, No. 2
3. Cerkezkoy Ticaret ve Sanayi Odasi (2017): Unlu Mamuller Raporu, June 2017.
4. Dancshazy Z., Kolozs L., Csoka G., Koltay A. (2015): Surveillance of quarantine and certain other non- native pests imposing risks to forestry in Hungary, Regional FAO workshop.
5. European Commission (2017): Study on Storage Capacities and Logistical Infrastructure for EU Agricultural Commodities, Trade Report.
6. European Commission (2016): The CAP in Your Country, Hungary Fact Sheet.
7. Fogarasi J., Kemeny G., Molnar A., Kemenyne Z., Zubor-Nemes A., Kiss A. (2016):
Modelling Climate Effects on Hungarian Winter Wheat and Maize Yields, Studies in Agricultural Economics 118 (2016) 85-90.
8. Food and Agriculture Organization of the United Nations Database: Retrieved January 30, 2019, from http://www.fao.org/faostat/en/#data/OA
9. Hungarian Central Statistical Office (KSH). Retrieved January 30, 2019, from http://www.ksh.hu/docs/eng/xstadat/xstadat_long/h_omf001b.html
10. International Grains Council (IGC) (2018): Grain Market Report, GMR 494.
11. International Trade Centre (2019): Retrieved January 30, 2019, from http://www.intracen.org/itc/market-info-tools/statistics-export-product-country/
12. Research Institute of Agricultural Economics (AKI): Retrieved February 7, 2019, from https://www.aki.gov.hu/publikaciok/publikacio/a:218/Cereals+Market+Information 13. Research Institute of Agricultural Economics (2017): Structural Changes in
Agriculture since EU Accession in Slovakia, The Czech Republic and Hungary, 51- 57.
14. Research Institute of Agricultural Economics (2017): The Use of Feed Materials and Feed Additives in Different Livestock Diets in Hungary (2015-2017).
15. Strategie Grains, (2018): EU Grain report No.312, Tallage SAS, 13/12/18, 4-5 16. TMMOB Ziraat Muhendisleri Odasi (2018): Bugday Raporu 2018 , Retrieved
February 4, 2019, from
http://www.zmo.org.tr/genel/bizden_detay.php?kod=30125&tipi=17&sube=0 17. Turkish Grain Board (2018): Toprak Mahsulleri Ofisi 2017 Yili Hububat Raporu.
18. United States Department of Agriculture (USDA) (2018): Turkey Grain and Feed Annual Report, Report Number: TR8010.
19. United States Department of Agriculture (2018): EU-28 Grain and Feed Annual Report.
20. Vigani M., Cerezo E. R., Barbero M. G. (2015): The determinants of wheat yields:
The role of sustainable innovation, policies and risks in France and Hungary, JRC Science and Policy Reports, EUR 27246 EN; https://dx.doi.org/10.2791/470542