Journal of Luminescence 219 (2020) 116917
Available online 25 November 2019
0022-2313/© 2019 The Authors. Published by Elsevier B.V. This is an open access article under the CC BY license (http://creativecommons.org/licenses/by/4.0/).
On the effects of milling and thermal regeneration on the luminescence properties of Eu 2 þ and Dy 3 þ doped strontium aluminate phosphors
Viktor Havasi
a, D avid T � � atrai
b, G � abor Szab o �
b,c, Erika Varga
d, Andr � as Erd } ohelyi
d, Gy € orgy Sipos
e, Zolt an K � � onya
a,f, Akos Kukovecz �
a,*aUniversity of Szeged, Interdisciplinary Excellence Centre, Department of Applied and Environmental Chemistry, H-6720, Rerrich B�ela T�er 1, Szeged, Hungary
bDepartment of Optics and Quantum Electronics, University of Szeged, H-6720, Szeged, D�om Sq. 9, Hungary
cMTA-SZTE Research Group on Photoacoustic Spectroscopy, H-6720, Szeged, D�om Sq. 9, Hungary
dDepartment of Physical Chemistry and Materials Science, University of Szeged, 6720, Szeged, Aradi V. Sq. 1, Hungary
eDepartment of Physical Geography and Geoinformatics, University of Szeged, H-6722, Szeged, Egyetem St. 2-6, Hungary
fMTA-SZTE Reaction Kinetics and Surface Chemistry Research Group, H-6720, Szeged, Rerrich Sq. 1, Hungary
A R T I C L E I N F O Keywords:
Strontium aluminate Phosphor Regeneration Luminescence Size reduction Ball milling
A B S T R A C T
This paper reports a comparison of luminescence, particle size and crystallinity reduction of SrAl2O4: Eu2þ, Dy3þ (SA2) and Sr4Al14O25: Eu2þ, Dy3þ(SA14) phosphors by ball milling. In addition, the regeneration possibilities of rare earth metal doped strontium aluminate phosphors (SAEDs) were investigated. The crystallinity degradation and particle size reduction were characterized by powder X-ray diffraction, and scanning electron microscopy (SEM) techniques respectively. Afterglow (AG), photo- (PL) and thermoluminescent (TL) properties of SAEDs were followed in parallel. The trap level shifts during the degradation and regeneration process were calculated from the TL data. The oxidation and reduction of Eu2þ/3þluminescence centre was followed by X-ray photo- electron spectroscopy (XPS). Luminescence degradation became significant after 2 μm avg. particle diameter reached, for both SAEDs. Considerable differences were found in their stress durabilities. The SA2 and SA14 characteristics are largely influenced by the details of the mechanical energy investment method, in reached crystallinity, particle diameter, and the Eu2þ/3þstate, besides the total amount of energy transferred. The reversibility of the Eu2þ/3þratio, PL and afterglow performance of the milled phosphors could be restored to some extent, by similar to synthesis annealing. The SA14 and SA2 phosphors responded differently to the regeneration process.
1. Introduction
Long-persistent inorganic phosphors are widely studied materials due to their high-performance energy-storing capabilities [1–3]. They can emit visible light up to several hours after excitation. The afterglow process is a delayed radiation on a luminescence centre, caused by thermally stimulated slow recombination of trapped charge carriers [4–6]. While their sufficiently long phosphorescence lifetimes render these materials suitable for many applications, their available particle size range can limit their usability, for example in luminescent paints [7], bioimaging applications [8], solar cells supports [9], photocatalytic reactions [10], and other industrial processes [11,12].
The first long-persistent phosphors were sulfide-based materials doped with transition metals and radioactive elements. Titanates,
silicates, aluminates, and nitrides were later converted successfully into high-performance phosphors [2,13–15]. Since the discovery of SrAl2O4: Eu2þ, Dy3þas a new persistent luminescent phosphor by Matsuzawa [5], a large number of rare earth metal doped alkaline earth metal alumi- nates have been studied in various lattices. Eu2þand Dy3þco-activated variants of strontium aluminates (SAED) have become particularly important due to their high luminescence and stability [1]. Studies focused on optimizing the precursor properties or the use of flux agents are available in the literature [16,17]. Considerable efforts have been put into both top-down and bottom-up approaches to produce phos- phors with controlled particle size [18–21]. These include solid-state synthesis [22], precipitation [23], combustion [24] and magnetron sputtering [25]. Nonetheless, high-quality phosphors are typically syn- thesized primarily in a broad size distribution ranging from 10 to 500
* Corresponding author.
E-mail address: kakos@chem.u-szeged.hu (A. Kukovecz). �
Contents lists available at ScienceDirect
Journal of Luminescence
journal homepage: http://www.elsevier.com/locate/jlumin
https://doi.org/10.1016/j.jlumin.2019.116917
Received 9 August 2019; Received in revised form 8 November 2019; Accepted 23 November 2019
μm. This is due to the reductive heat treatment process typical for most types of synthesis.
Phosphor milling is investigated today as an industrially accepted, scalable particle size control alternative. However, the energy invested into SAED particle size reduction is expected to oxidize some Eu2þions into inactive Eu3þin the host lattice [3]. Moreover, the local coordi- nation environment offered to dopants in strontium aluminate hosts depends heavily on crystallinity and lattice microstructure [26]. Even though these factors can affect the performance of submicrometer-sized phosphors, their complete analysis is not yet available in the literature.
Besides, information about the feasibility of thermal restoration of the performance of degraded SAED phosphors is also not available.
Here we present a comparative study on the long-persistent phos- phorescent properties of SrAl2O4: Eu2þ, Dy3þ (SA2, monoclinic) and Sr4Al14O25: Eu2þ, Dy3þ(SA14, orthorhombic) phosphors. These SAEDs were milled into submicrometer-sized particles in a planetary ball mill.
The changes in the most important phosphor quality parameters were determined, and the durability of SA2 and SA14 was compared. In addition, the possibilities to restore the luminescence behaviour of degraded SAEDs were investigated. Powder X-ray diffraction (XRD), scanning electron microscopy (SEM), X-ray photoelectron spectroscopy (XPS), photoluminescence spectroscopy (PL), afterglow photometry (AG), decay curve modelling, and thermoluminescence (TL) analysis were employed.
2. Experimental 2.1. Synthesis
SrCO3 (99.9%), Al2O3 (150 mesh, >99%), Eu2O3 (99.9%), Dy2O3
(99.9%), H3BO3 (99.5%) were all purchased from Sigma-Aldrich and used as received. Phosphors were prepared in the general compositions
of Sr1-x-yAl2-2bO4: bB3þxEu2þ, yDy3þ(SA2) and Sr4-4(xþy)Al14-14bO25: bB3þ, xEu2þ, yDy3þ(SA14) where b ¼0.1, x ¼0.04 and y ¼0.08. A solid-state synthesis method was used to produce bulk SAED materials for milling. Precursors were homogenized by milling at 500 rpm for 60 min in a Fritsch P6 planetary ball mill using Si3N4 balls in an 80 ml Si3N4
bowl. A high-temperature treatment at 1200 �C in a reductive atmo- sphere (10 vol% H2, 90 vol% N2) was carried out afterwards to yield the bulk poison green (SA2), and pale green (SA14) products. These prod- ucts were then ground by hand in an agate mortar, their coarse fractions consisting of particles with diameters over 1 mm were removed by sieving, 1 g of each material was dry milled in a planetary ball mill for different times at 200, 350, and 500 rpm. Attempts were made to restore the performance by annealing some of the milled phosphors at 1000 �C or 1200 �C for 4 h in a flow of the original reducing gas mixture. In the case of regenerative precursor addition, the precursors were added in 1:1 wt ratio to the milled samples.
2.2. Characterization
The crystal structure of the synthesized phosphors was analyzed by the powdered X-ray diffraction (XRD) technique in a Rigaku MiniFlex II system operating with Cu Kα radiations in 0.5�/min steps. Scanning electron microscopy (SEM) was performed using a Hitachi S4700 Type II FE-SEM microscope. Ocean Optics USB4000 spectrometer and a DH- 2000-BAL UV–Vis–NIR light source having a 250–450 nm range with its maximum output intensity at 325 nm were used to measure the
photoluminescence (PL) emission spectra. The maximum resolution of the spectrometer was 0.1 nm in the 200–850 nm wavelength range. PL decay curves of 100 mg sample aliquots were measured using a custom- built setup. The samples were illuminated with a UV LED for 60 min in a direction perpendicular to the detection. The LED light source was a 5 mm DIP LED. Its peak intensity was available at 395 �15 nm, FWHM 12 nm. The source was driven with 3.7 V dc voltage. No monochromator was used. The intensity of the light was modulated by a chopper wheel and detected by a Hamamatsu R928 photomultiplier tube operated at 1000 V using lock-in technique with 1 s integration time. X-ray photo- electron spectroscopy (XPS) measurements were performed in a Specs instrument on disk-like samples pelleted to 1 cm in diameter and 1 mm in thickness. Thermoluminescence (TL) measurements were performed in a Risoe TL/OSL DA-15 unit. The PM tube of the unit was run at 810 V acceleration voltage. BG3 and RG610 filters were used to avoid signal saturation when recording the spectra. 20 mg powder samples were charged with 1 min irradiation from a 0.33 W 400 nm LED source. Trap depths and densities were calculated by Chen’s peak shape method [27–31]. The particle size distribution was determined manually by measuring the diameters of 300 randomly selected particles using three SEM micrographs recorded at different regions of the sample using ImageJ image analysis software. Visible light photographs were taken using a Canon EOS 50D frame and Sigma 100–300 mm lens. The exposition time was 1/250 s in ambient light, ½ s when illuminated, and 1s in dark, by a 0.33 W LED light source (λ~395 nm) for 1 min and 1 s in dark.
The Burgio-Rojac model was used to quantify the milling process.
The energy of a single ball hit as well as the cumulative energy trans- ferred to the material during a planetary ball milling session can be calculated by the Burgio-Rojac model [32–34] as described in equations (1) and (2), respectively.
Here K is a geometrical constant of the mill, ϕb is the obstruction coefficient, ρb is the density of the milling balls, db is the diameter of the milling balls, dv is the diameter of the milling drum, ωp and ωv are the rotational speed of the milling plate and the drum, respectively and rp is the distance between the rotation axes of the plate and the drum. The cumulative energy (Ecum) received by the material in a t time period is calculated as
Ecum¼ΔEb�vt�t
mp (2)
where νt is the impact frequency and mp is the mass of the admeasured sample [33]. The energy transferred to the phosphor particles in a single ball impact was calculated to be 11.9, 36.5 and 74.5 mJ/hit when running the mill at 200, 350 and 500 rpm, respectively [35].
Trap densities (1/cm3) and depths (eV) were calculated using Chen’s so called peak-shape equation [28–31] as:
E¼
��
2:52þ10:2 μg 0:42���
kbT2m
ω
� 2kbTm
�
1:602*10 19 (3)
n0¼ ω* Im β*�
2:52þ10:2μg 0:42�� (4)
Here ω is the shape parameter defined as ω ¼δ þτ with δ being the high- ΔEb¼1
2ϕbK
� ρbπd3b
6
� ω2p
��ωv
ωd
�2� dv db
2
�2� 1 2ωv
ωd
� 2rp
�ωv
ωd
��dv db
2
� � ωv
ωd
�2� dv db
2
�2�
(1)
temperature half width and τ the low-temperature half width of the peak. kb is Boltzmann’s constant and Tm indicates the maximum in- tensity peak position in the curves. The asymmetry parameter is μg ¼ δ/ω and Im is the TL intensity at the peak position. E is the average activation energy of trap sites and n0 is their density. It should be noted that the trap density should be treated only as a value relative to that of the non-milled reference phosphor because Im is strongly dependent on the settings of the instrument.
3. Results and discussion
3.1. Milling effects on the phosphor particle morphology
Phosphor particles featured an irregular shape both before and after
milling [20]. In contrast to the bulkier SA2, SA14 was friable and the particles were observed to have blunt edges even without fine grinding.
It was easier to pulverize SA14 to pulverize to coarse powder.
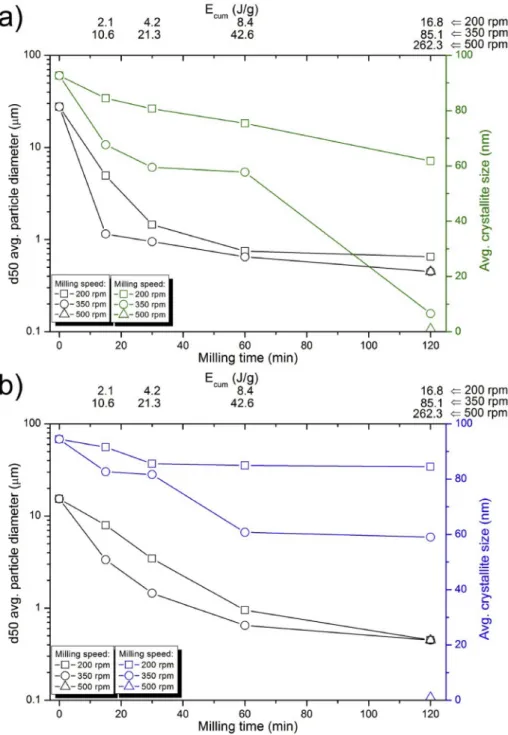
The average phosphor particle apparent diameters are depicted as functions of milling time and cumulative milling energy in Fig. 1. It should be noted that the d50 values correspond to the size of agglom- erates (see Supplementary Information for SEM images). The primary crystallite size calculated by the Scherrer equation from XRD data is provided in the secondary y axis. After a short time of milling, it can be seen that the size of the SA2 particles reduced less gradually as compared to SA14. The gradual reduction of SA14 can be attributed to the looser aggregation of particles in SA14 in contrast to the glassy ag- gregation of particles in SA2. Nevertheless, both materials exhibited the same attrition rate as the milling was further progressed. The gradual
Fig. 1. Average (black) and maximum (green/blue) particle diameters of SA2 (a) and SA14 (b) phosphor particles milled under identical conditions. (For inter- pretation of the references to colour in this figure legend, the reader is referred to the Web version of this article.)
size reduction in the initial stages was followed by levelling of the curves after about 60 min. This is in agreement with earlier reports about the existence of a lowest particle size limit achievable by milling [3,36–38].
This appears to be at approx. 500 nm average diameter for both SA2 and SA14, regardless of the cumulative impact energy applied. Both phos- phors could be reduced into submicron sizes, utilizing about 10 J/g energy transfer cumulatively. Although the impact energy, Eb and the milling time, t should compensate each other according to equation (2), our results reveal that increasing Eb is better than increasing the milling time for the size reduction of SAED phosphors. This is indicated by the fact that a prolonged milling time reduced the maximum and average particle diameter with a highly depreciating pace. Therefore, only higher impact energies could result in smaller particles, which is also observed in Fig. 1. Moreover, as reported by Kandpal et al. long milling times could also result in the reaggregation of the particles [3].
3.2. Milling effects on phosphor crystallinity
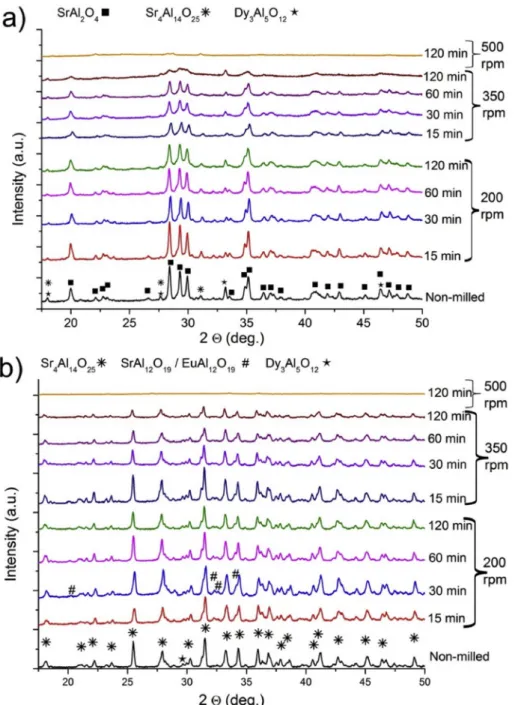
The powder XRD profiles recorded at various stages of the milling are depicted in Fig. 2. As particles were converted from irregularly shaped particles with diameters >50 μm into submicron diameter crystallites, uniform fine powders were obtained with amorphization of crystallites occurring simultaneously over prolonged milling times [38]. As can be deduced from the weakened and broadened reflections in Fig. 2, SA2 (Fig. 2a) and SA14 (Fig. 2b) suffered slightly different reductions in their crystallinity. While SA2 shows slight amorphization at the end of low energy milling at 200 rpm, SA14 shows no apparent reduction in its crystallinity. A serious reduction in the crystallinity of SA2 was observed after about 15 min of higher energy milling at 350 rpm and an even more pronounced amorphization was observed after 120 min. Although a serious amorphization was also observed in SA14, it remained more crystalline compared to SA2 under the same processing conditions. Both SA2 and SA14 could be destroyed completely when exposed to very
Fig. 2. Powder XRD patterns of SA2 (a) and SA14 (b) phosphors milled at 200 and 350 rpm for 15–120 min and 500 rpm for 120 min.
high-energy milling (at 500 rpm) for 120 min. No recognizable pattern of any SAED variants could be identified in these cases. Considering the particle size reduction tendencies, the observed difference in durability suggests that different aggregation states of SA2 and SA14 crystallites are the main reason behind the dissimilarity. This is why the smaller crystallites of glassy SA2 start getting seriously damaged from the impact of balls just from the beginning. Whereas, the loosely aggregated crystallites of SA14 get damaged later only when the aggregation level is lowered, resulting in a higher durability.
While no significant phase transformation was observed in either of the phosphors due to milling, some contaminants could be identified and characteristic differences were found in the details of the crystal struc- ture evolution. SA2 (JCPDS: 09–0039) identified as SrAl2O4 phase, Fig. 2 a indicates the presence of two contaminant phases in SA2. Sr4Al14O25
(JCPDS: 74–1810) and Dy3Al5O12 (JCPDS: 22–1093) phases were found and their peaks followed parallel to the main peaks of SA2. Interestingly, the reflection intensities of contaminants were preserved better than those of SA2 during the milling. This can also be noticed from the in- tensities of 27.6 and 33.3 2Θ contaminant reflections as these peaks are identifiable even after a prolonged high energy milling. It is regardless of their tiny presence in SA2. This suggests that the contaminant phases have a higher resistance against mechanical grain damage than the phosphor itself. On the other hand, these phases could form during milling, even though their reflections were not strengthened.
The intensities of SA14 (Fig. 2 b) (JCPDS: 74–1810) showed less reduction with milling time as compared to that of SA2. SA14 also had contaminant phases, identified as EuAl12O19 (JCPDS: 26–0976), SrAl12O19 (JCPDS: 26–1125) and Dy3Al5O12 [23]. It can be observed that Dy3Al5O12 and MAl12O19 were reduced and amorphized almost simultaneously with SA14. Slightly strengthened reflections of these contaminants in low energy milled products can be related to some suppression effect of the undamaged main lattice. Besides that, their durability seems to be equal to SA14.
With an overall 262.3 J/impact energy employed, both the phos- phors showed a complete destruction of their crystalline phases with their secondary phases. The resultant powders contained almost negli- gible reflections, identified as Si3N4 (JCPDS: 71–0623) originated from the mill container. Results indicate that the observed sample particles were completely non-crystalline post-products of SA2 and SA14.
Comparing the crystallinity of SA2, SA14 and their secondary phases reveals that the aggregation and durability of single grains are usually responsible for durability against milling impacts.
3.3. Milling effects on the photoluminescence properties
Both SAED phosphors appeared as pale green coarse powders under ambient light (Fig. 3.). As the applied low energy milling was prolonged, both SAEDs were observed to whiten out. On the other hand, greying was observed under higher energies, with SA2 more inclined to fade towards grey. Under 400 nm illumination, all SA2 and SA14 samples exhibited some kind of photoluminescence, except the 500 rpm milled ones. As no crystallinity or PL was noticed, these samples will be not detailed in later measurements. Consequently, the as-used conditions caused a gradual degradation of SAEDs until the complete degradation.
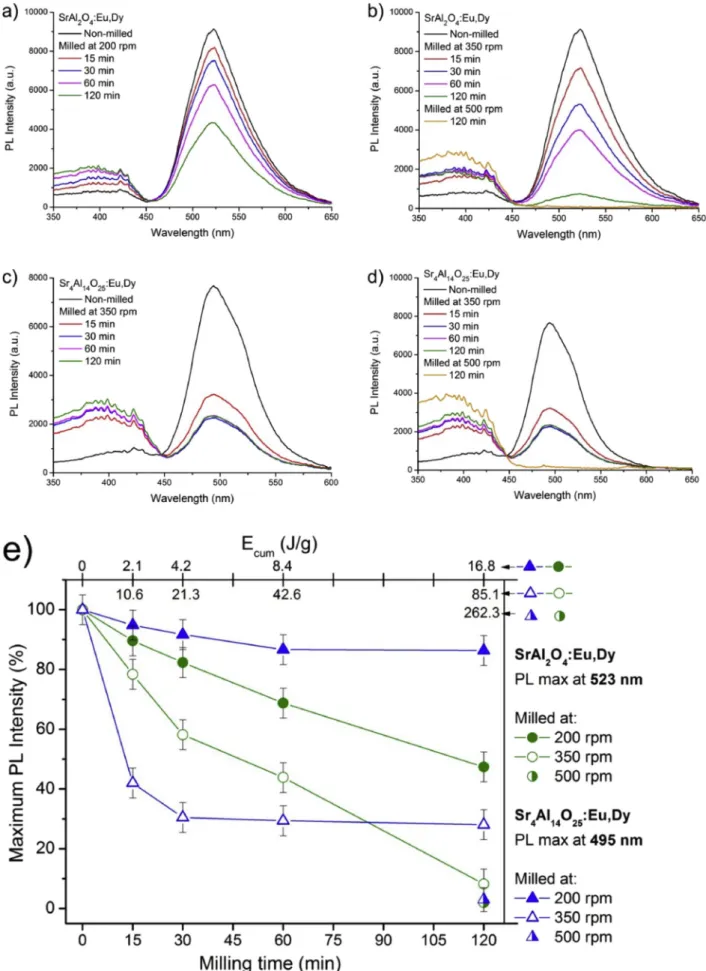
SAED phosphors showed no luminescence when no crystalline phase was present. Only the reflection of the photons from the light source can be seen in the completely destroyed samples. Depending on the milling parameters, an apparent blue shift and fading of the PL could be clearly observed with naked eyes. The apparent blue shift and fading effect are both related to the smaller quantum yield and absorbance, but increased reflection of excitation photons. However, no shift was recorded in the PL of the phosphors, as can be seen in Fig. 4 a-d. This suggests that milling was not able to reduce the grain size to the Bohr-exciton radius, and – in accordance with the XRD interpretation – the formation of sizeable amounts of new light-emitting phases can also be excluded.
Weakened PL tendencies were quantified as shown in Fig. 4 e. where the maximal PL intensities are depicted as a function of milling time and cumulative milling energy. It is also clear that increasing the impact energy inevitably results in worsened PL intensity. This is due to the loss of available Eu2þluminescence centres, less crystallinity and formation of non-radiative trap sites in the remaining lattices [2,3]. The degra- dation process was observed to be more powerful during the afterglow process when the 400 nm illumination was switched off (Fig. 3). This is detailed later in the discussion.
Some characteristic differences were observed between the behav- iours of SA2 and SA14 even though their particle size distributions (Supplementary information, Fig. S1) at a given impact energy/milling time conditions were similar. The PL intensity loss of SA2 is a quasi-
Fig. 3. Optical images of SA2 (top) and SA14 (bottom) phosphors milled and illuminated under various conditions.
Fig. 4.PL spectra of milled SA2 (a–b) and SA14 (c–d) phosphors. Maximum photoluminescent (PL) intensity as a function of milling time for SA2 (green) and SA14 (blue) phosphors (e). (For interpretation of the references to colour in this figure legend, the reader is referred to the Web version of this article.)
linear function of the cumulative energy transferred to the phosphor.
Only the slope of the intensity reduction curve was affected by a vari- ation in the impact energy. Luminescence degradation in SA2 appears to be proportional to the loss of crystallinity (see XRD in Fig. 2), which is linear to the overall energy invested.
On the other hand, SA14 showed a highly nonlinear loss behaviour, with serious dependence on milling energy rather than overall invested energy. Very little (approx. 10%) PL intensity reduction occurred when exposed to low impact energy regardless of the milling time (at 200 rpm). High impact energy (at 350 rpm) caused an almost time- independent loss in luminescence, however approx. 75% of PL in- tensity was lost. It seems that in the case of SA14, an amount equal to the threshold impact energy is needed to induce quantized luminescence degradation.
A possible explanation for this phenomenon is that the SA2 and SA14 particles are covered by defensive flux layers in relatively different manners. The more solid SA2 particles break gradually, while Eu2þions
oxidize to inactive Eu3þions in the inner lattice. This results in the oxidation of majority of Eu2þions and gradual loss of intensity in SA2.
Since the crystallinity of SA14 particles reduced slowly and nonlinearly, it appears that no serious damage to the crystallites occurs under the threshold energy. This is due to the non-oxidation of luminescence centres in the inner lattice. The luminescence loss can be related to the oxidation of surface luminescence centres only during low energy milling. High energy milling can, however, oxidize Eu2þluminescence centres both on the surface and the lattice, damaging the crystallites simultaneously. The process seems very quick above the threshold en- ergy, as most of the luminescence centres get oxidized during the first 15 min of milling and a dead layer is possibly formed.
3.4. Milling effects on the afterglow properties
Non-milled phosphors exhibited the largest afterglow intensities.
The most intense AG signal was observed for non-milled SA14. The
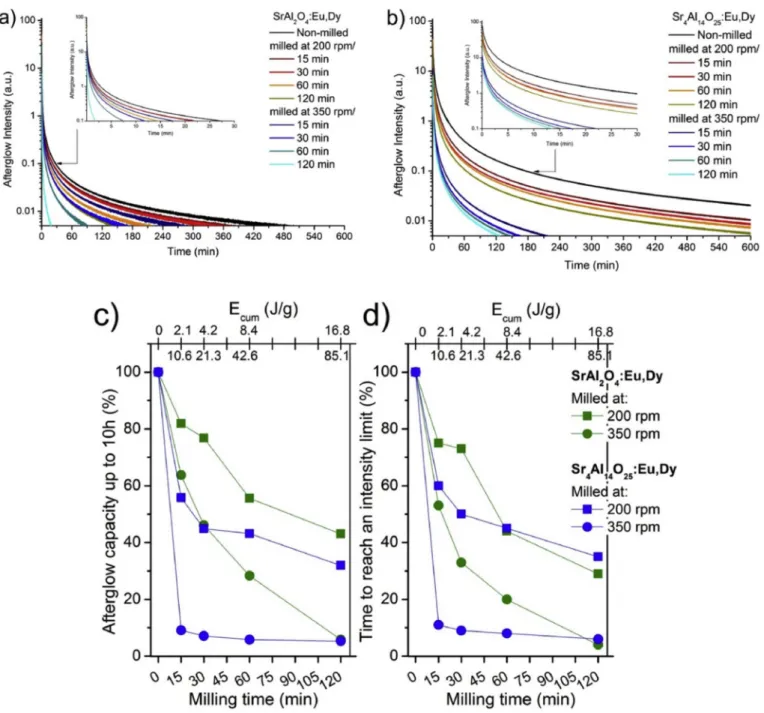
Fig. 5.Afterglow curves of as milled SA2 (a) and SA14 (b) phosphors. Overall integrated area as afterglow capacities of milled SA2 and SA14 phosphors (c) and the time needed to reach the arbitrary 0.005% of the initial intensity of the non-milled sample (d).
decay of the afterglow intensities was measured at the wavelength range corresponding to the visible luminescent spectra of SA2 and SA14. The micrometer and nanometer sized strontium aluminates have shown considerable differences in their afterglow characteristics in earlier studies. These differences were related mostly to the dissimilarities in their crystallite sizes [21,39]. Since the afterglow comes from the suc- cessful relaxation of charge carriers on luminescence centrums, the afterglow properties follow precisely the decay of PL characteristics.
Fig. 4 Showed that PL intensities of SA2 and SA14 are basically similar. On the other hand, we can see from Fig. 3 that the afterglow properties of SA14 were superior to those of SA2 under all the condi- tions. Fig. 5 a. and b. indicate that the superiority comes from the overall higher afterglow capacity of SA14 instead of the maintained afterglow properties. Afterglow properties were simply detailed as integrated ca- pacity (Fig. 5 c.) of the phosphors [40–42]. We can see in Fig. 5a-b, that differences are logarithmically proportional in the initial and later phases of the afterglow for both the phosphors. As a constantly worsened property, the amounts of time to reach a given intensity and exponential decay values of the afterglow curves were also calculated. Results ob- tained correlate well with the integrated capacities (seeFig. 5).
For SA2 the afterglow properties decayed in a gradual way in all aspects. In this case the resulted loss followed the invested cumulative impact energies. In addition, results clearly correlate to the PL charac- teristics both in proportion and exact values. The same little differences can be observed in the invested milling energy and decay relations.
The afterglow properties of SA14 showed a similar tendency as their PL properties, but in a far poorer performance. All milled SA14 samples showed an overall ~20% lower afterglow capacity than as expected from their PL. As most of the crystallinity remained, the formation of non-radiative trap sites in the lattice and the dead layer may be a result of the strong affection to long term afterglow properties [43,44].
3.5. Regeneration effect on the phosphor particles
During the regeneration process, the two phosphors acted similarly, however a stronger re-aggregation occurred in case of SA2. Overall, a
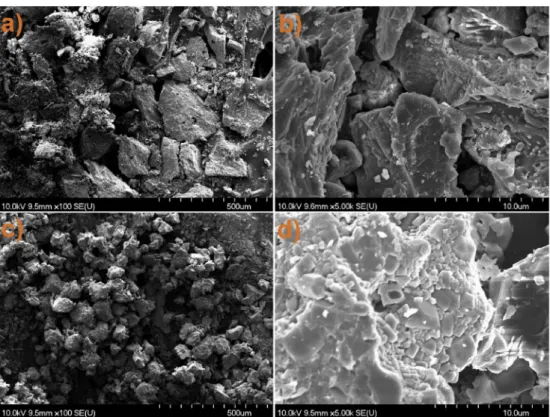
serious re-aggregation process was induced, where the average di- ameters of the particles of both phosphors became comparable to their original, non-milled values (Fig. 6). Similarly, the average diameter of the regenerated phosphor particles was observed to be in 20–100 μm range, in a slight dependence on their initial condition. From a closer view, we could see that the particles became slightly different from the original. During the re-aggregation process, particles were mostly rebuilt from fragmented crystallites. Individual grains could be barely seen in larger particles originally but aggregated small crystallites built up larger particles after regeneration. In case of regenerated non-milled phosphors, slightly larger particles which were not built up from aggregated crystallites were observed. Smaller overall particle sizes were obtained during regeneration at 1000 �C due to lesser induced aggregation. The addition of the precursor material was observed to have no effects on the apparent re-crystallization or re-aggregation processes, during our experiment.
3.6. Regeneration effect on the phosphor crystallinity
Inorganic phosphors are known to be very inert materials, with a theoretical capacity of unlimited charge-up cycles. On the other hand, little is known about the possibilities of restoring their luminescence and crystallic performance after the application of mechanical [18], chem- ical [45,46] or oxidative stresses [47], or even after a poorly performed crystallization process. Besides, it is well known that the slight differ- ences in the precursor composition can result in other different crys- talline and amorphous optical materials [48–50].
Also, the significance of initial precursor composition in the quality of the phosphor was confirmed in multiple studies. The precursor properties were tuned by dry and wet-milling [51], combustion tech- nique regulation [52–55] and pre-calcination [56,57] methods. Lü et al.
described that the particle size of the precursor has an effect on the phosphor properties [58]. Therefore, to investigate the recrystallization effects, we annealed the as-milled phosphors under the same conditions as they were produced for the first time. In addition, the effect of pre- cursor addition in 1:1 ratio, and possibilities of lowering the reannealing
Fig. 6. SEM images of regenerated non-milled (left) and 350 rpm milled (right) SA2 (top row) and SA14 (bottom row) phosphors.
temperature to 1000 �C were investigated.
Characteristic XRD profiles of the annealed samples are presented in Fig. 7. The second annealing affected the crystallinity of both phosphors, under all conditions. The source condition had a key role in the regen- eration process, as well as during synthesis. For both phosphors, some degradation was observed for samples with high crystallinity. However, the samples with low crystallinity showed some improvement. A similar phenomenon was observed under oxidative environment [47], there- fore, both the degradation and recrystallization can be related to the heat treatment process, regardless of the atmosphere.
For SA2, the crystallinity decrease was slightly lower and the in- crease was higher than that for SA14 by reannealing at 1200 �C. It can be clearly seen in Fig. 7 a. that higher crystallinity variants (non-milled and 200 rpm milled) of SA2 reached nearly the same crystallinity as the original. While more degraded (350 rpm) sample gave a poorer result, thus, indicating some limitations in the regeneration possibilities. SA2
showed large sensitivity to the reannealing temperature similarly to the synthesis process [59]. Low crystallinity could be slightly increased at a lower temperatures. This phenomenon confirmed the common role of the precursor condition and reannealing temperature in the regenera- tion of SA2. Addition of the same amount of precursor material to highly degraded SA2 contributed highly to the recrystallization process. The as-reannealed material reached the same crystallinity as the less degraded ones during the reannealing, but couldn’t reach the original level.
For SA14 the crystallinity resulted from the second annealing was less dependent on the initial properties. However, slightly lower crys- tallinity was achieved in the samples with a high initial crystallinity.
Also, the crystallinity improved only slightly for more degraded sam- ples. Since reannealing at 1000 �C and 1200 �C resulted into similar crystallinity, it indicates that SA14 was less sensitive to the reannealing temperature. The addition of precursor, however resulted in values Fig. 7.XRD patterns of milled and regenerated SA2 (a) and SA14 (b) phosphors.
similar to that of SA2, as crystallinity increased when it was close to the pure synthesized state. Precursor addition caused the same result as in the case of SA2, as crystallinity increased close to the pure synthesized state.
The re-annealing of 500 rpm milled and slightly Si3N4 contaminated samples of both phosphors yielded recrystallization into a different state. The product was identified as a mixture of Sr6Al18Si2O37 (JCPDS:
10–0025) and SrAl2Si2O8 (JCPDS: 38–1454). Results show that another limiting factor in the regenerating process is the elemental contamina- tion during a degradation process. Strontium-aluminates can easily incorporate other elements in their lattice during high-temperature annealing [49,60,61]. Results show that in presence of some contami- nants, other crystallites may form dominantly, such as garnets or alu- minosilicates. Therefore, proper regeneration can be expected only when the SAEDs remain chemically uncontaminated.
3.7. Regeneration effects on the luminescence properties
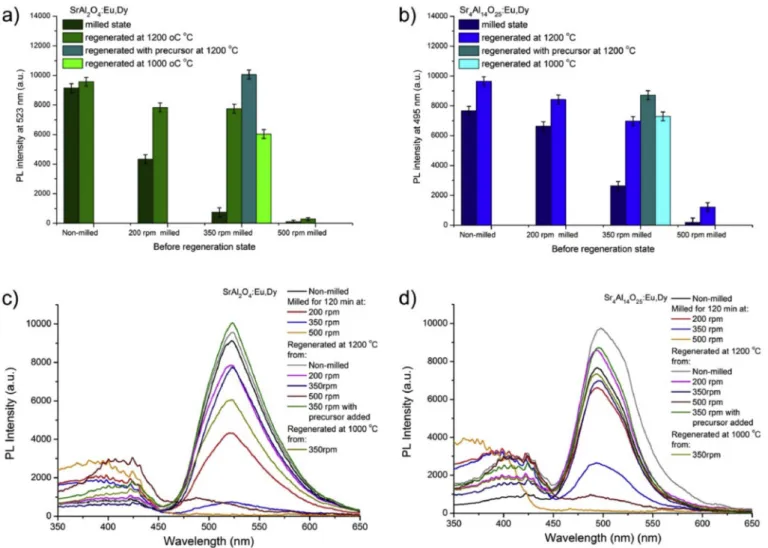
It can be observed from Fig. 8a-b that regeneration of both SA2 and SA14 were achievable by multiple ways. The two phosphors acted similarly, as the luminescence properties of the regenerated samples were dependent on the initial materials. Interestingly, the PL properties of both phosphors were enhanced slightly, when non-degraded samples were annealed the second time.
After the regeneration process at 1200 �C in a reductive atmosphere, the PL intensity of SA2 increased by ~5%, while that of SA14 increased
by ~20% of their initial values. The observed decrease of crystallite size of these samples suggests that a slight reduction in the size of crystallite without Eu2þ oxidation affects PL properties positively. Regenerated samples with lower or damaged crystallinity, (due to low crystalline initial materials) showed slightly worsened PL properties for SA2. Re- generated SA14 samples with lower crystallinity displayed properties similar to the original samples. No significant photoluminescence was observed from the completely destroyed and contaminated samples due to the formation of side-products. Even though the regeneration tem- perature was lowered to 1000 �C, the regeneration of the phosphors was still successful. In the case of SA2, the PL intensity was 22% less than the 1200 �C reannealed sample. In the case of SA14, the lowered tempera- ture did not affect the PL intensity negatively, as can also be noticed from the crystallinity values. For both phosphors, the addition of pre- cursor resulted in the same 12% higher PL intensity compared to their non-milled variants. Results showed that addition of precursor material can initiate the proper recrystallization of both phosphors during the regeneration process. Results also indicate that PL properties could be regenerated for both phosphors, while their complete recrystallization is achievable. All the properly recrystallized phosphors except the contaminated ones suffered no shifts in their PL spectra.
3.8. Regeneration effects on the afterglow properties
The regeneration of afterglow properties indicates a pronounced dependence on the initial material. Both phosphors showed some
Fig. 8. PL intensity maximum values of milled and regenerated SA2 (a) and SA14 (b) phosphors. PL spectra of milled and regenerated SA2 (a) and SA14 (b) phosphors.
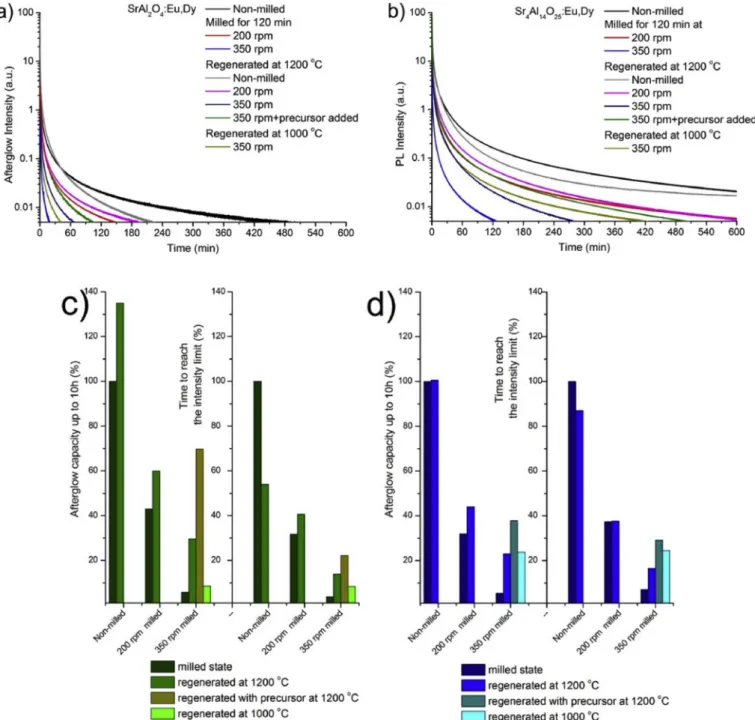
improvement compared to their milled conditions. However, none of the presented conditions led to the restoration of original afterglow prop- erties from their 120 min milled states. Due to the restored Eu2þlumi- nescence centres, a significant improvement compared to the milled phosphors could be seen in the integral of the curves. The improvement in the decay times was not as substantial as the integral values of the curves. Results show that regardless of the regeneration of the lumi- nescence centres, there is an appreciable number of non-radiative cen- trums as remaining lattice defects (Fig. 8 c-d). In addition, afterglow values could not be predicted like the milled ones.
From Fig. 9 a we can note that the second treatment had some effect on the non-degraded SA2 phosphor. The phosphor displayed a better luminescence performance in the initial 60 min, however, the perfor- mance worsened later as compared to the original sample. The regen- eration of 200 rpm milled SA2 led to a slight improvement only when
the decay times were prolonged by 15–20%. The regeneration process of the 350 rpm milled SA2 was barely successful, as even the properties similar to samples milled at 200 rpm could not be achieved. Precursor addition initiated a slight improvement. Reannealing at 1000 �C resul- ted in an inferior afterglow performance compared to that of reanneal- ing at 1200 �C.
For SA14, a slight degradation was noticeable when the non-milled phosphor was reannealed. Tendencies similar to SA2 were found as the regeneration of 200 rpm milled SA14 showed only a slight improvement in afterglow. Larger improvements were observed in the case of the 350 rpm milled SA14, though the regenerated afterglow remained under the 200 rpm level of milling. The addition of some precursor generated only a slight positive difference. Interestingly, for the 350 rpm milled SA14, reannealing at 1000 �C resulted in a better afterglow performance than the reannealing at 1200 �C.
Fig. 9. Afterglow curves of milled and regenerated SA2 (a) and SA14 (b) phosphors. Overall integrated area as afterglow capacities of milled SA2 and SA14 phosphors (c) and the time needed to reach the arbitrary 0.005% of the initial intensity of the non-milled sample (d).
Results indicate that the afterglow properties of both phosphors cannot be fully regenerated from an arbitrary initial damage and size of the crystallites. And high-temperature annealing can damage the structure of intact crystallites in the case of SA14.
3.8.1. Eu oxidation state changes during the milling and regeneration X-ray photoelectron spectra of the phosphors are presented in Fig. 10. The importance of XPS investigations was demonstrated by Luo et al. who found that the local concentration of dopant lanthanides is several times higher near the phosphor grain boundaries than inside the bulk particles [62]. Europium was not clearly detectable in our pristine samples but well appeared after etching an approx. ~50 nm thick sur- face layer away by Ar ion bombardment. This suggests that a flux layer covers all synthesized phosphor particles. This layer temporarily pro- tects the aggregated grains from oxidation. Ion etched pristine phos- phors show the three-dimensional orbital peaks at specific binding energies (1125 eV for Eu2þto 1136 eV Eu3þ).
The europium signal was clearly visible for the milled samples without any etching. This suggests that the flux layer had been removed from the grains due to the mechanical agitation. Low-impact energy milling (200 rpm) had a slight effect on the Eu2þ/Eu3þratio. In contrast, the relative amount of Eu2þwas significantly reduced by oxidation for both SA2 and SA14 when milled at 350 rpm. The initial Eu2þ/Eu3þratio was the same in both phosphors. Milling for 120 min at 200 or 350 rpm modified the relative Eu2þamount to 0.6 and 0.4 in the case of SA2, and 0.9 and 0.6 in the case of SA14. The less pronounced change in the latter case correlates well with the observation that size reduction is less
pronounced for SA14. It is important to realize that decreasing the crystallite size increases the number of defect sites acting as radiation traps. Thus, the observable PL intensity variations are due to the com- bination of Eu2þ oxidation and increased defect site concentration.
Similar results were achieved for SA2 by Rojas-Hernandez et al. [24].
Since the Eu2þ/Eu3þratio is crucial for good phosphor performance [3], these findings support the PL intensity loss explained above. After the reductive annealing at 1200 �C, Eu signals were lost again for both SA2 and SA14. Results revealed that during the recrystallization, the grains are again covered by the flux layer. Therefore although the ratio of Eu2þ/Eu3þshould have been moved back to the original (as synthesized) state according to Rojas-Hernandez et al. [24], this could not be directly observed in the XPS spectra due to the layer of flux.
3.8.2. Trap position changes during the milling and regeneration The phosphors were studied by thermoluminescence (TL) technique to gain more insight into the underlying phenomena. The TL curves and the calculated trap levels of milled and regenerated strontium aluminate phosphors are presented in Fig. 11 a-b. The presented phosphors uni- formly obeyed the general order kinetics [31]. The crystallinity decay of two phosphors caused slight changes in the dominant trap levels.
Phosphors acted differently, as SA2 shifted slightly deeper, but SA14 shifted to slightly shallower levels. Besides the serious drop of trap-carrying capacity of the phosphors, the shifts correlate to the decay of afterglow properties. In accordance with the shift, both the afterglow decays were relatively higher in SA14 than in the case of SA2. For both phosphors, second annealed originals had slightly narrowed TL curves.
Fig. 10. XPS spectra of SA2 (a) and SA14 (b) phosphor powders: non-milled, non-milled and ion etched, milled and regenerated variants. Part (c) illustrates the relationship between the development of the XPS signal and the physical state of the material.
A slight shift to deeper levels was observed in their estimated trap depths. Reannealed original phosphors showed high TL capacity, while their long afterglow properties had decayed. This phenomenon suggests that main trap levels and luminescence centres retained their qualities.
Besides, a serious amount of crystal defects with non-radiating transition appeared during the second annealing which may have obstructed the delayed afterglow.
After the regeneration of SA2 at 1200 �C, the main trap depths of the low energy milled phosphors were observed to be close to their original levels, while trap carrier capacity was slightly restored. In contrast, high energy milled phosphors displayed even more dissimilar trap levels with lower capacities. During the regeneration process, significant number of secondary levels were noticed. These were mostly identified as shallow trap levels, while the main traps levels had shifted to deeper values. The same was observed in the case of second annealing with the temperature reduced to 1000 �C. This phenomenon reveals that the appearance of the secondary levels can be related only to an initially less crystalline
material. The trap carrier capacity was also observed to be limited by the crystallite size of the regenerated phosphors.
After the regeneration of SA14 at 1200 �C, the main trap depths of the low energy milled phosphors approximated their original levels, however, the trap carrier capacity was observed to be stagnated. This result correlates to the afterglow property. Deeper trap levels were formed with slightly higher capacities from the high energy milled SA14. The regeneration at 1000 �C brought the trap level close to the original, with slightly higher capacity improvement. The capacity and trap level evolution also suggest a direct correlation with the evolution of crystallinity during the regeneration process.
4. Conclusions
A comparative investigation of mechanical stress resistance of SrAl2O4: Eu2þ, Dy3þ (SA2) and Sr4Al14O25: Eu2þ, Dy3þ (SA14) was carried out by planetary ball milling. Loss of long-persistent Fig. 11. Thermoluminescence curves of milled and regenerated SA2 (a) and SA14 (b) phosphors. Estimated average main and secondary trap levels are embedded where the secondary levels were estimated from deconvolution of main curves.
luminescence performance became significant as the average crystallite size was reduced below 2 μm for both phosphors. Considerable differ- ences were found in the stress reactions of the two phosphors, due to their different aggregation states. The size reduction was a non-linear process, and the different results obtained can be defined only by knowing the exact way the mechanical energy is invested. SA2 was more prone to amorphization than SA14, nevertheless, both the phosphors could be completely amorphized by the application of proper level of mechanical stress. While SA2 showed gradual, SA14 showed sudden decay in PL and AG properties. During the milling process, the afterglow properties could be directly estimated from the PL properties, for both the phosphors. Results were correlated with XPS measurements of the Eu2þ/Eu3þratio and TL measurements as well.
During the regeneration process, reaggregation of smaller grains was observed, no significant recrystallization tendency was observed. Com- plete crystallinity recovery was not achieved, and recovery level had a high dependence on the initial level of crystallinity in the material.
Recovery could not be performed if the phosphor was contaminated before, as SAEDs tend to form other phases in presence of contaminants.
It was possible to restore the PL performance of milled SA2 and SA14 phosphors to some extent by annealing in a reducing atmosphere at 1200 �C and 1000 �C. The PL regeneration was achieved by restored Eu2þ/3þratio. Though the afterglow properties are strongly related to higher crystallinity, these could not be restored. TL measurements also confirmed that during the regeneration process, non-radiant trap levels could be retained, while unsuitable new trap sites could be formed.
Acknowledgement
This work was supported by the Hungarian Research Development and Innovation Office through grants K126065, K120115 and GINOP- 2.3.2-15-2016-00013 00Intelligent materials based on functional surfaces - from syntheses to applications", as well as the Ministry of Human Ca- pacities through the EFOP-3.6.1-16-2016-00014 project.
Appendix A. Supplementary data
Supplementary data to this article can be found online at https://doi.
org/10.1016/j.jlumin.2019.116917.
References
[1] K. Van den Eeckhout, P.F. Smet, D. Poelman, Persistent Luminescence in Eu2þ- doped compounds: a review, Materials 3 (4) (2010) 2536–2566.
[2] Y.Q.L. Rong-Jun Xie, Naoto Hirosaki, Hajime Yamamoto, in: Nitride Phosphors and Solid-State Lighting, Taylor & Francis, 2011.
[3] S.K. Kandpal, et al., Investigation of the emission mechanism in milled SrAl(2)O(4):
Eu, Dy using optical and synchrotron X-ray spectroscopy, ACS Appl. Mater.
Interfaces 3 (9) (2011) 3482–3486.
[4] Y. Lin, Z. Tang, Z. Zhang, Preparation of long-afterglow Sr4Al14O25-based luminescent material and its optical properties, Mater. Lett. 51 (1) (2001) 14–18.
[5] T. Matsuzawa, A new long phosphorescent Phosphor with high brightness, SrAl2O4: Eu2þ,Dy3þ, J. Electrochem. Soc. 143 (8) (1996) 2670.
[6] F. Clabau, et al., Mechanism of phosphorescence appropriate for the long-lasting phosphors Eu2þ-doped SrAl2O4 with codopants Dy3þand B3þ, Chem. Mater. 17 (15) (2005) 3904–3912.
[7] X. Shi, et al., Efficient luminescence of long persistent phosphor combined with photonic crystal, ACS Appl. Mater. Interfaces 6 (9) (2014) 6317–6321.
[8] S.K. Singh, Red and near infrared persistent luminescence nano-probes for bioimaging and targeting applications, RSC Adv. 4 (102) (2014) 58674–58698.
[9] H. Sun, et al., Long afterglow Sr4Al14O25:Eu,Dy phosphors as both scattering and down converting layer for CdS quantum dot-sensitized solar cells, Dalton Trans. 43 (40) (2014) 14936–14941.
[10] H. Li, et al., Green phosphorescence-assisted degradation of rhodamine Bdyes by Ag3PO4, J. Mater. Chem. 1 (4) (2013) 1123–1126.
[11] Y. Yan, et al., Morphology and spectral characteristics of a luminous fiber containing a rare earth strontium aluminate, Text. Res. J. 82 (17) (2012) 1819–1826.
[12] Y. Fujio, et al., Influence of organic solvent treatment on elasticoluminescent property of europium-doped strontium aluminates, J. Lumin. 148 (2014) 89–93.
[13] J.-C. Zhang, et al., Controlling elastico-mechanoluminescence in diphase (Ba,Ca) TiO3:Pr3þby co-doping different rare earth ions, RSC Adv. 4 (77) (2014) 40665–40675.
[14] S. Xin, et al., Preparation, characterization, and luminescent properties of CaAl2O4: Eu2þ, Nd3þnanofibers using core–sheath CaAl2O4:Eu2þ, Nd3þ/carbon nanofibers as templates, J. Mater. Chem. C 1 (48) (2013) 8156.
[15] T. Ishigaki, et al., Long phosphorescent Ca2SnO4 with minuscule rare earth dopant concentration, Dalton Trans. 42 (14) (2013) 4781–4785.
[16] A. Nag, T.R.N. Kutty, The mechanism of long phosphorescence of SrAl2 xBxO4 (0<x<0.2) and Sr4Al14 xBxO25 (0.1<x<0.4) co-doped with Eu2þand Dy3þ, Mater.
Res. Bull. 39 (3) (2004) 331–342.
[17] J. Niittykoski, et al., Effect of boron substitution on the preparation and luminescence of Eu2þdoped strontium aluminates, J. Alloy. Comp. 374 (1–2) (2004) 108–111.
[18] R.E. Rojas-Hernandez, et al., A low-energy milling approach to reduce particle size maintains the luminescence of strontium aluminates, RSC Adv. 5 (53) (2015) 42559–42567.
[19] X. Li, et al., Crystal structures and optical properties of new quaternary strontium europium aluminate luminescent nanoribbons, J. Mater. Chem. C 3 (4) (2015) 778–788.
[20] H. Zhang, et al., A top-down method to fabricate SrAl2O4:Eu2þ,Dy3þnanosheets from commercial blocky phosphors, Opt. Mater. 36 (11) (2014) 1802–1807.
[21] D.S. Kshatri, A. Khare, Comparative study of optical and structural properties of micro- and nanocrystalline SrAl2O4: Eu2þ, Dy3þphosphors, J. Lumin. 155 (2014) 257–268.
[22] S.-D. Han, et al., Preparation and characterization of long persistence strontium aluminate phosphor, J. Lumin. 128 (3) (2008) 301–305.
[23] C. Chang, Z. Yuan, D. Mao, Eu2þactivated long persistent strontium aluminate nano scaled phosphor prepared by precipitation method, J. Alloy. Comp. 415 (1–2) (2006) 220–224.
[24] R.E. Rojas-Hernandez, et al., Designing nanostructured strontium aluminate particles with high luminescence properties, J. Mater. Chem. C 3 (6) (2015) 1268–1276.
[25] C. Chang, D. Mao, Long lasting phosphorescence of Sr4Al14O25:Eu2þ,Dy3þthin films by magnetron sputtering, Thin Solid Films 460 (1–2) (2004) 48–52.
[26] D.A. Dutczak, et al., Eu2þluminescence in strontium aluminates, Phys. Chem.
Chem. Phys. 17 (23) (2015) 15236–15249.
[27] L. Jiang, et al., A new long persistent blue-emitting Sr2ZnSi2O7:Eu2þ, Dy3þ prepared by sol–gel method, Mater. Lett. 58 (12–13) (2004) 1825–1829.
[28] R. Chen, Glow curves with general order kinetics, J. Electrochem. Soc. 116 (9) (1969) 1254–1257.
[29] T. Katsumata, et al., Thermally Stimulated and photostimulated Luminescence from long duration phosphorescent SrAl2O4:Eu, Dy crystals, J. Electrochem. Soc.
150 (5) (2003) H111.
[30] T. Aitasalo, et al., Thermoluminescence study of persistent luminescence Materials:
Eu2þ- and r3þ-doped calcium aluminates, CaAl2O4:Eu2þ,R3þ, J. Phys. Chem. B 110 (10) (2006) 4589–4598.
[31] G.K. Vasilis Pagonis, Claudio Furetta, Numerical And Practical Exercises In Thermoluminescence, Springer-Verlag, New York, 2006, p. 210.
[32] N. Burgio, et al., Mechanical alloying of the Fe Zr system. Correlation between input energy and end products, Il Nuovo Cimento D 13 (4) (1991) 459–476.
[33] P.P. Chattopadhyay, et al., A mathematical analysis of milling mechanics in a planetary ball mill, Mater. Chem. Phys. 68 (1–3) (2001) 85–94.
[34] V. Pagonis, et al., Experimental and modelling study of pulsed optically stimulated luminescence in quartz, marble and beta irradiated salt, J. Phys. D Appl. Phys. 42 (5) (2009), 055407.
[35] S.L. James, et al., Mechanochemistry: opportunities for new and cleaner synthesis, Chem. Soc. Rev. 41 (1) (2012) 413–447.
[36] H.F. Brito, et al., Persistent luminescence mechanisms: human imagination at work, Opt. Mater. Express 2 (4) (2012) 371–381.
[37] J. Alkebro, et al., Modeling high-energy ball milling in the alumina–yttria system, J. Solid State Chem. 164 (1) (2002) 88–97.
[38] Z.H. Loh, A.K. Samanta, P.W. Sia Heng, Overview of milling techniques for improving the solubility of poorly water-soluble drugs, Asian J. Pharm. Sci. 10 (4) (2015) 255–274.
[39] C. Zhao, et al., Synthesis of Sr4Al14O25:Eu2þ,Dy3þphosphor nanometer powders by combustion processes and its optical properties, Mater. Sci. Eng., B 133 (1–3) (2006) 200–204.
[40] H. Hagemann, et al., Wavelength dependent loading of traps in the persistent phosphor SrAl2O4:Eu2þ, Dy3þ, J. Lumin. 170 (2016) 299–304.
[41] X. Luo, W. Cao, Z. Xiao, Investigation on the distribution of rare earth ions in strontium aluminate phosphors, J. Alloy. Comp. 416 (1–2) (2006) 250–255.
[42] V. Havasi, et al., Systematic comparison of saturation effects and afterglow properties of Sr 4 Al 14 O 25 :Eu, Dy phosphor excited by alpha and beta ionizing sources and UV light, J. Mol. Struct. 1140 (2017) 89–98.
[43] G. Bizarri, B. Moine, On the role of traps in the BaMgAl10O17:Eu2þfluorescence mechanisms, J. Lumin. 115 (1–2) (2005) 53–61.
[44] B.L. Abrams, P.H. Holloway, Role of the surface in luminescent processes, Chem.
Rev. 104 (12) (2004) 5783–5802.
[45] Y. Zhu, et al., Luminescence enhancing encapsulation for strontium aluminate phosphors with phosphate, Mater. Chem. Phys. 113 (2–3) (2009) 721–726.
[46] C. Ye, et al., Formation of crystalline SrAl(2)O(4) nanotubes by a roll-up and post- annealing approach, Angew Chem. Int. Ed. Engl. 45 (30) (2006) 4922–4926.
[47] E. Karacaoglu, B. Karasu, The effects of re-firing process under oxidizing atmosphere and temperatures on the properties of strontium aluminate phosphors, Mater. Res. Bull. 48 (10) (2013) 3702–3706.
[48] S. Alahrach�e, et al., Perfectly transparent Sr3Al2O6Polycrystalline ceramic Elaborated from glass crystallization, Chem. Mater. 25 (20) (2013) 4017–4024.
[49] C.W. Ow-Yang, et al., Processing and characterization of phosphorescent strontium aluminate powders, Adv. Sci. Technol. 45 (2006) 2627–2632.
[50] M. Capron, A. Douy, Strontium dialuminate SrAl4O7: synthesis and stability, J. Am. Ceram. Soc. 85 (12) (2002) 3036–3040.
[51] S.Y. Kaya, E. Karacaoglu, B. Karasu, Particle size influence of starting batches on phosphorescence behaviour of Sr4Al14O25based bluish green phosphors, Adv.in Appl.Ceramics 111 (7) (2013) 393–397.
[52] H. Chander, et al., Synthesis of nanocrystals of long persisting phosphor by modified combustion technique, J. Cryst. Growth 271 (1–2) (2004) 307–312.
[53] E. Shafia, M. Bodaghi, M. Tahriri, The influence of some processing conditions on host crystal structure and phosphorescence properties of SrAl2O4:Eu2þ, Dy3þ nanoparticle pigments synthesized by combustion technique, Curr. Appl. Phys. 10 (2) (2010) 596–600.
[54] Y. Qu, et al., Rapid combustion method for surface modification of strontium aluminate phosphors with high water resistance, Appl. Surf. Sci. 258 (18) (2012) 6814–6818.
[55] R.E. Rojas-Hernandez, M.A. Rodriguez, J.F. Fernandez, Role of the oxidizing agent to complete the synthesis of strontium aluminate based phosphors by the combustion method, RSC Adv. 5 (4) (2015) 3104–3112.
[56] N. Thompson, et al., Role of oxidative pre-calcination in extending blue emission of Sr4Al14O25 nanophosphors formed with microemulsions, J. Alloy. Comp. 537 (2012) 147–153.
[57] J. Chen, F. Gu, C. Li, Influence of precalcination and boron-doping on the initial photoluminescent properties of SrAl2O4:Eu,Dy phosphors, Cryst. Growth Des. 8 (9) (2008) 3175–3179.
[58] X. LÜ, et al., Effect of mixing process on the luminescent properties of SrAl2O4:Eu2 þ, Dy3þlong afterglow phosphors, J. Rare Earths 28 (1) (2010) 150–152.
[59] C.-H. Lu, S.-Y. Chen, C.-H. Hsu, Nanosized strontium aluminate phosphors prepared via a reverse microemulsion route, Mater. Sci. Eng., B 140 (3) (2007) 218–221.
[60] M. Capron, et al., Synthesis and structural characterisation of Sr3Al10SiO20 by XRD and solid-state NMR, J. Solid State Chem. 169 (1) (2002) 53–59.
[61] H.N. Luitel, et al., Tuning the luminescence color and enhancement of afterglow properties of Sr(4 x y)CaxBayAl14O25:Eu2þ,Dy3þphosphor by adjusting the composition, Mater. Sci. Eng., B 178 (12) (2013) 834–842.
[62] M. Fasoli, et al., Optical methods for the evaluation of the thermal ionization barrier of lanthanide excited states in luminescent materials, Phys. Rev. B 85 (8) (2012).