ProsperAMnet at the FinSim Task: Detecting hypernyms of financial concepts via measuring the information stored in sparse word representations
G´abor Berend
1,2, Nobert Kis-Szab´o
1, Zsolt Sz´ant´o
11
University of Szeged, Institute of Informatics
2
MTA-SZTE Research Group on Artificial Intelligence {berendg,ksznorbi,szantozs}@inf.u-szeged.hu
Abstract
In this paper we propose and carefully evaluate the application of an information theoretic approach for the detection of hypernyms for financial con- cepts. Our algorithm is based on the application of sparse word embeddings, meaning that – unlike in the case of traditional word embeddings – most of the coefficients in the embeddings are exactly zero.
We apply an approach that quantify the extent to which the individual dimensions for such word rep- resentations convey the property that some word is the hyponym of a certain top-level concept ac- cording to an external ontology. Our experimental results demonstrate that substantial improvements can be gained by our approach compared to the di- rect utilization of the traditional dense word em- beddings. Our team ranked second and fourth ac- cording to average rank score and mean accuracy that were the two evaluation criteria applied at the shared task.
1 Introduction
We introduce our contribution to the FinSim 2020 shared task [Maaroufet al., 2020] where the task was to classify financial terms according to their ontological properties.
As sparse word embeddings have been reported to con- vey increased interpretability [Murphyet al., 2012; Faruqui et al., 2015; Subramanianet al., 2018], we investigated the extent to which applying them can improve the extraction of financial taxonomic relations. To this end we carefully evaluate in this paper an algorithm in the task of extracting taxonomic relations for financial terms on the shared task dataset by exploiting an algorithm for extracting common- sense knowledge from sparse word representations proposed in [Balogh et al., 2020]. Our results corroborate previous claims that the application of sparse word representations not only result in a more interpretable representation, but the systems built on top of them often outperform approaches that employ dense word embeddings [Faruqui et al., 2015;
Berend, 2017]. We release our source code and trained em- beddings in order to foster reproducibility of our results1.
1https://github.com/begab/prosperAM-finsim
2 Related work
Hypernym discovery has spurred substantial research atten- tion with one of the 2018 SemEval shared task being focused on the detection of hypernyms in multiple languages and do- mains [Camacho-Colladoset al., 2018]. The top-performing system applied a combination of supervised learning and unsupervised pattern matching techniques [Bernier-Colborne and Barri`ere, 2018]. [Held and Habash, 2019] also argued for the applications of hybrid approaches involving Hearst patters [Hearst, 1992] for extracting hypernyms. Most re- cently, [Dashet al., 2020] introduced Strict Partial Order Net- works (SPON), a neural network architecture for detecting word pairs for which theIsArelation holds paying special attention to the fact of the relation being asymmetric.
[Berend et al., 2018] employed sparse word representa- tions and formal concept analysis for building a model that decides if a word is a hypernym of another by investigating the non-zero coefficients for a pair of input expressions. Even though our work also exploits sparse word representations, we rather build our framework on an information theory- inspired approach that we introduce in the followings.
3 System description
Our framework adapts recent algorithm in [Balogh et al., 2020] which devises an information theory-inspired algo- rithm for quantifying the extent to which the individual di- mensions of sparse word representations relate to certain commonsense properties of concepts. The basis of the al- gorithm is to measure the amount of information overlap be- tween the properties of concepts and the nonzero coefficients of sparse word representations. [Baloghet al., 2020] took ConceptNet [Speer and Havasi, 2012] as the basis for mea- suring the information overlap, however, the approach is gen- eralizable to any commonsense knowledge.
We next summarize our approach in details. As a first step, we extract the raw text from the prospectuses that were pro- vided by the organizers in pdf format using Tika. As a sub- sequent step, we trained standard static word embeddings us- ing approaches fasttext [Bojanowskiet al., 2017] and Glove [Penningtonet al., 2014].
We relied on the default tokenization protocol and set all the hyperparameters of the algorithms for creating the em- beddings to their default settings as well in order to avoid ex-
cessive hyperparamter tuning. In the end, we were left with a vocabulary of 17,105 unique word forms and 100 dimen- sional dense embeddings.
Our next step was to derive the sparse word representations from the dense embeddings that we created earlier. For this step, we relied on the algorithm proposed in [Berend, 2017], that is given matrixX ∈ Rn×m (n = 17,105, m = 100) containing a collection of stacked dense embeddings of car- dinalityn, we strive to solve
min
α∈Rn×k≥0 ,D∈Rk×m
1
2kX−αDk2F +λkαk1, (1)
with the additional constraint that the vectors comprisingD have a bounded norm. That is, we would like to express each dense word embedding as a sparse linear combination of the vectors included in D. The number of vectors included in D ∈ Rk×mis controlled by the value ofk. We conducted experiments fork∈ {1000,1500,2000}.
The`1-based penalty term included in (1) causes most of the coefficients inαto be zero, and we tread the rows of this matrix as our sparse word representations. Larger values for the regularization coefficientλresults in higher levels of spar- sity in the word representation that we obtain. We performed our experiments withλ∈ {0.1, ,0.2,0.3,0.4,0.5}. For solv- ing (1), we used the dictionary learning algorithm introduced in [Mairalet al., 2009].
Next, we constructed the matrix of representations for the terms in the training dataset. This resulted in a matrix of T ∈ R100×k, with 100 referring to the number of terms included in the training dataset. The embeddings for multi- token terms got determined by taking the centroid of the vec- torial representation of the words that are included in a multi- token expression.
We subsequently constructed a binary matrix B ∈ {0,1}8×100. In this matrix, every row corre- sponds to one of the eight labels, i.e., {Bonds, Forward, Funds, Future, MMIs, Option, Stocks, Swap}and an entry bij was set to 1 if training termjwas labeled by labeliin the training data and 0 otherwise.
By multiplying matricesBandT we obtained such a ma- trixM ∈R8×kwhich includes the sparse coefficients of the terms aggregated by the labels they belong to. We treated this matrix as an incidence matrix and calculated the normalized positive pointwise mutual information [Bouma, 2009]. For some labelli and dimensiondj, we calculated this quantity (that we abbreviate as NPPMI) as
NPPMI(li, dj) = max
0; ln P(li, dj) P(li)P(dj)
−lnP(li, dj)
In the above formula P(li)refers to the probability of ob- serving labeli,P(dj)indicates the probability of dimension j having a non-zero value and P(li, dj)refers to the joint probability of the two events. We derived these probabilities by taking the row and column marginals of the`1-normalized version of the incidence matrixM. By performingNPPMI over every entry ofM, we obtain matrixA∈[0,1]8,k, every entry of which determines the strength of association between labeliand dimensionj.
When facing a new term that is associated by vector v ∈ Rk, we take the products=Av. An elementsifrom scan be regarded as a score indicating the extent to whichv refers to a vector that describes a term that belong to labeli.
Our final prediction hence is going to be labeli∗ for which i∗= arg maxisi.
4 Experiments
We first report our experiments that we obtained for our of- ficial submissions in the shared task. During this batch of experiments, we were working with 100 dimensional fasstext vectors created based on the training data provided by the shared task organizers, using the CBOW training approach with the default hyperparamter settings. We used the train- ing set as the development set by measuring the performance of our algorithm over the 100 training instances in a leave- one-out fashion, i.e. averaged the evaluation metrics on every training term, while excluding the currently evaluated term from building our model.
For evaluating purposes we used the two official measures for the shared task, i.e. Mean Accuracy (MA) and Average Rank (AR). MA quantifies the percentage of terms for which a model regarded the true class label as the most likely one, whereas AR also takes into consideration the position of the correct label within the ranked list of class labels for an in- dividual term. For the MA metric higher values mean better performance, whereas AR behaves in the opposite manner.
4.1 Centroid-based baseline
In order to see the added value of using sparse represen- tations, we performed a comparison towards a baseline ap- proach that was based on those dense embeddings. To ensure comparability, our baseline approach was based on the very same fasttext CBOW dense embeddings that we later created our sparse embeddings from.
Notice that the dense embeddings fit naturally into our framework, since utilizing the rawm = 100 dimensional dense embeddings can be viewed as performing (1) by choos- ingk=m,λ= 0andD ∈Rk×kto be the identity matrix.
Under these circumstances, theα=Xis a trivial solution for (1), meaning that we are essentially using the original dense embeddingsX. Applying our methodology involving the cal- culation ofNPPMIbased the raw dense embeddings, how- ever, resulted in poor results.
In order to favor the application of dense embeddings, we made slight modifications in our framework when the inputs were dense emebddings. For the dense embeddings based baseline, we created a matrix M ∈ R8×100, the rows of which contained unit normalized centroids for each class la- bel that we obtained from averaging the term vectors that be- long to each label. Upon making prediction for a dense em- beddingv∈R100, we followed the same strategy as before, i.e. formed the productvM of the term vector and the ma- trix of unit normalized label centroids and took the argmax of the resulting vector. Table 1 includes the results of our base- line approach which was based on the centroids of the dense fasttext-CBOW embeddings.
Input MA AR 100d fasttext CBOW 78.0 1.35
Table 1: Baseline results for the label centroid-based approach us- ing dense embeddings. MA and AR stands for mean accuracy and average ranking, respectively.
λ= 0.1 λ= 0.2 λ= 0.3 λ= 0.4 λ= 0.5
85.0 84.0 82.0 84.0 86.0
(a) Mean accuracy (MA)
λ= 0.1 λ= 0.2 λ= 0.3 λ= 0.4 λ= 0.5
1.33 1.34 1.33 1.33 1.24
(b) Average Rank (AR)
Table 2: Average Rank (AR) and Mean Accuracy (MA) metrics of models obtained for using different regularization coefficientλ when evaluated on the training data in a leave-one-out fashion using fasttext CBOW input embeddings andk= 1000.
4.2 Evaluation of our approach
Regarding the hyperparameters influencing our approach, we performed controlled experiments for analyzing the effects of changing the hyperparameter of bothλandk.
Controlling the regularization coefficientλ
We first performed controlled experiments to mea- sure the effects of the regularization coefficient λ ∈ {0.1,0.2,0.3,0.4,0.5} while fixing the value of k to be 1000 following [Balogh et al., 2020]. These results are included in Table 2. We can see that the choice for the regularization coefficient did not severely influence our evaluation scores.
By comparing the results in Table 2 with those in Table 1, we can see that our approach performs at least as good as the baseline approach which is based on the centroid of dense fasttext-CBOW embeddings. The contents of Table 1 demon- strate that the results obtained by relying on the sparse CBOW word representations were the best for the highest level of sparsity, i.e. when usingλ= 0.5.
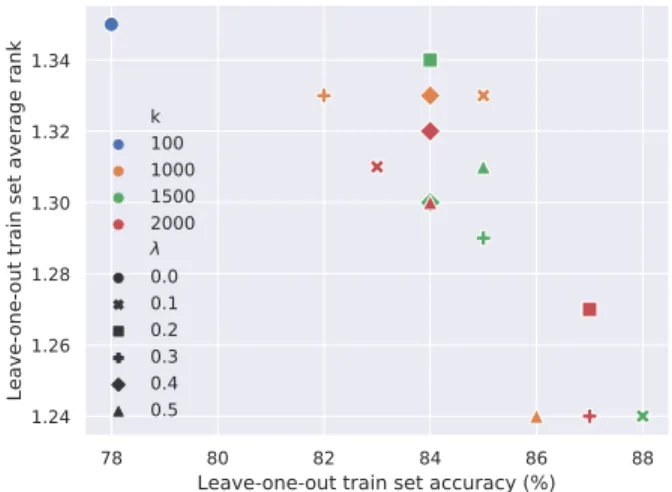
Jointly controlling the regularization and the dimensions We subsequently measured the effects of simultaneously modifying the regularization coefficient λ and k, i.e. the number of basis vectors to be included in D. Figure 1 in- cludes the results of those experimental settings for(λ, k)∈ (0,100)∪ {0.1,0.2,0.3,0.4,0.5} × {1000,1500,2000}, i.e.
we experimented with 15 different combinations ofλandk besides relying on the original 100-dimensional dense em- beddings.
Figure 1 displays the MA and AR metrics along the x and y axis, respectively. We can see a negative correlation, i.e. the higher MA values we obtained the lower AR scores we regis- tered. Since lower AR scores mean better performance this is a desired property of our approach. We can further notice that our approach produced substantially better results compared
78 80 82 84 86 88
Leave-one-out train set accuracy (%) 1.24
1.26 1.28 1.30 1.32 1.34
Leave-one-out train set average rank
k100 10001500 2000 0.00.1 0.20.3 0.40.5
Figure 1: The joint effects of modifying the regularization co- efficientλ and the number of basis vectors k when using 100- dimensional dense fasttext-CBOW embeddings as input. The per- formance of the centroid-based baseline is indicated by the blue dot in the upper-left corner of the scatter plot.
Train (LOO) Test Aggregation strategy MA AR MA AR
Ranking-based 86.0 1.27 77.7 1.34 Preceded by`2normalization 85.0 1.30 74.7 1.37 Based on raw scores 85.0 1.30 73.7 1.38
Table 3: The effects of the different aggregation strategies when en- sembling. The three aggregation strategies correspond to our three official submissions. Our official results are the ones labeled as Test.
to the dense embeddings-based baseline. This is true for any combination of hyperparameters we tested our algorithms for and both for the MA and AR evaluation criteria.
Taking an ensemble of models
In order to combine the independently constructed models that were obtained by different choices of hyperparameters, we derived our final predictions as a combination of the pre- diction of multiple models. We randomly chose 7 different models that were the result of different(k, λ)choices2 and combined the predictions of these models.
We came up with three different ways of combining the predictions of the same independent models. The first ap- proach only took into consideration the rankings that we ob- tained for each model but not the actual numerical scores of s(j)=A(j)vwiths(j)denoting the association scores for the jthmodel towards each class label.
The remaining two models differed in that they also consid- ered the numeric scores fors(j)upon combining them. One of the approaches that considered the actual numeric scores per- formed`2-normalization of the individuals(j)vectors prior to summing them up, whereas the other alternative just summed up the raw scores in the distincts(j)vectors for making the final prediction.
2(1000, 0.4), (1000, 0.5), (1500, 0.3), (1500, 0.4), (2000, 0.1), (2000, 0.3), (2000, 0.5)
78 80 82 84 86 88 Leave-one-out train set accuracy (%)
57.5 60.0 62.5 65.0 67.5 70.0 72.5 75.0
Test set accuracy (%)
k100 10001500 2000 0.00.1 0.20.3 0.40.5
(a) Comparing the MA scores for the leave-one-out evaluation on the training data and the test set
1.24 1.26 1.28 1.30 1.32 1.34
Leave-one-out train set average rank 1.40
1.45 1.50 1.55 1.60 1.65 1.70
Test set average rank
k100 10001500 2000 0.00.1 0.20.3 0.40.5
(b) Comparing the AR scores for the leave-one-out evaluation on the training data and the test set
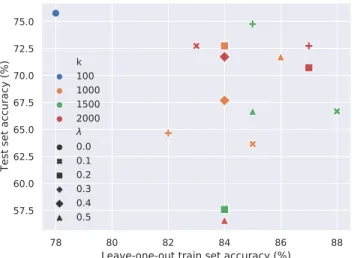
Figure 2: Systematic evaluation of selecting the various hyperparameters (kandλ) differently. The scatter plot includes the results of the MA and AR evaluations on the training set using leave-one-out evaluation and on the test set across the x any y axis, respectively. Theλ= 0 (k= 100) case corresponds to the utilization of our dense embeddings-based baseline approach.
Table 3 includes the results of the ensemble models accord- ing to the three different ways of aggregating thes(j)vectors for both the training terms in a leave-one-out manner and the test set. The results for the test set constitute the results of our official submission.
Our official results over the test set coincidentally resemble our leave-one-out evaluation scores obtained over the training set when employing our baseline approach which relies on the centroids of dense term embeddings (cf. the blue point in the upper-left corner of Figure 1) and the best test set results in bold included in Table 3).
Experiments with different input embeddings
After the gold labels for the test set of the shared task were released, we conducted a detailed experiment measuring the extent of different hyperparameter choices had similar effects when applying them on the training instances (in a leave-one- out fashion) and the test set. Figure 2 includes our compari- son for all the combinations ofλandkwhen using the same fasttext-CBOW embeddings as before.
By looking at Figure 2, we can see that the relative perfor- mance of the dense embeddings based baseline is dominantly better on the test set when evaluated using MA as opposed to its performance over the training set. Interestingly, our baseline would even deliver the best performance on the test set in terms of MA, however, it would still offer a mediocre performance in terms of AR over the test set (cf. the blue points along the y axis in Figure 2). It is important to empha- size that the test set performance of our official submissions relying on an ensemble of sparse embeddings-based models outperforms that of the baseline approach for both evaluation metrics, i.e. it achieves a 77.7% MA (as opposed to 75.7%
for our baseline) and a 1.34 AR (as opposed to 1.49 for the baseline).
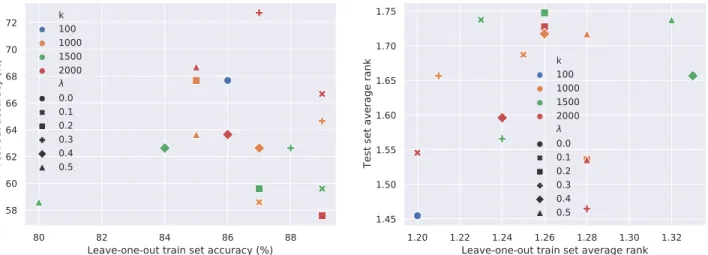
We next conducted similar experiments on alterna- tively trained dense embeddings. Besides the previously used fasttext-CBOW embeddings, we also trained fasttext- skipgram and Glove embeddings. Similar plots for the one in Figure 2 for these additional kinds of emebddings can be seen in Figure 3 for fasttext-skipgram (cf. Figure 3a and 3b) and Glove (cf. Figure 3c and 3d).
As illustrated in Figure 3, the dense fasttext-skipgram em- bedding baseline behaves complementary to what was seen for the fasttext-CBOW case, i.e. it yields the best AR per- formance, while not having outstanding capabilities in terms of MA. In summary, the best test set performance of the in- dividual models based on fasttext-skipgram embeddings are 72.7% for MA (for k = 2000, λ = 0.3) and 1.45 for AR (fork= 100, λ= 0), none of which manages to surpass the performance of our ensemble model.
Looking at Figure 3, we can also conclude that Glove has the poorest performance on this task compared to any of the fasttext variants. Even the best MA scores delivered by Glove are around 80% and 60% when evaluating against the training and test set, respectively, whereas the fasttext variants are able to perform close to 90% and above 70% for the training and test sets, respectively.
5 Conclusions
In this paper we investigated the applicability of a general- purpose information theory-inspired algorithm for extracting ontological knowledge for the financial domain. Our experi- ments verified that by employing our algorithm allows us to predict ontological relations better as if we were relying on standard dense embeddings. Our source code for replicating our experiments is accessible fromhttps://github.com/
begab/prosperAM-finsim.
80 82 84 86 88 Leave-one-out train set accuracy (%) 58
60 62 64 66 68 70 72
Test set accuracy (%)
k100 10001500 2000 0.00.1 0.20.3 0.40.5
(a) Comparing the MA scores for the leave-one-out evaluation on the training data and the test set using fasttext-skipgram embeddings
1.20 1.22 1.24 1.26 1.28 1.30 1.32 Leave-one-out train set average rank 1.45
1.50 1.55 1.60 1.65 1.70 1.75
Test set average rank
k100 10001500 2000 0.00.1 0.20.3 0.40.5
(b) Comparing the AR scores for the leave-one-out evaluation on the training data and the test set using fasttext-skipgram embeddings
60 65 70 75 80
Leave-one-out train set accuracy (%) 40.0
42.5 45.0 47.5 50.0 52.5 55.0 57.5 60.0
Test set accuracy (%)
k100 10001500 2000 0.00.1 0.20.3 0.40.5
(c) Comparing the MA scores for the leave-one-out evaluation on the training data and the test set using Glove embeddings
1.4 1.5 1.6 1.7 1.8
Leave-one-out train set average rank 1.8
1.9 2.0 2.1 2.2 2.3 2.4
Test set average rank
k100 10001500 2000 0.00.1 0.20.3 0.40.5
(d) Comparing the AR scores for the leave-one-out evaluation on the training data and the test set using Glove embeddings
Figure 3: Systematic evaluation of selecting the various hyperparameters (kandλ) differently when employing fasttext-skipgram (3a, 3b) and Glove (3c, 3d). The scatter plot includes the results of the MA and AR evaluations on the training set using leave-one-out evaluation and on the test set across the x any y axis, respectively.
Acknowledgments
This research has been partly conducted in the project “Pro- gressing Service Performance and Export Results of Ad- vanced Manufacturers Networks”, no CE1569 ProsperAM- net. The project has been supported by the European Fund for Regional Development in the framework of Interreg CEN- TRAL EUROPE 2019-2022. This research was also sup- ported by the European Union and co-funded by the Euro- pean Social Fund through the project ”Integrated program for training new generation of scientists in the fields of com- puter science” (EFOP-3.6.3-VEKOP-16-2017-0002) and by the National Research, Development and Innovation Office of Hungary through the Artificial Intelligence National Ex- cellence Program (2018-1.2.1-NKP-2018-00008).
References
[Baloghet al., 2020] Vanda Balogh, G´abor Berend, Dim- itrios I. Diochnos, and Gy¨orgy Tur´an. Understanding the semantic content of sparse word embeddings using a commonsense knowledge base. In The Thirty-Fourth AAAI Conference on Artificial Intelligence, AAAI 2020, The Thirty-Second Innovative Applications of Artificial In- telligence Conference, IAAI 2020, The Tenth AAAI Sympo- sium on Educational Advances in Artificial Intelligence, EAAI 2020, New York, NY, USA, February 7-12, 2020, pages 7399–7406, 2020.
[Berendet al., 2018] G´abor Berend, M´arton Makrai, and P´eter F¨oldi´ak. 300-sparsans at SemEval-2018 task 9: Hy- pernymy as interaction of sparse attributes. InProceedings
of The 12th International Workshop on Semantic Evalua- tion, pages 928–934, New Orleans, Louisiana, June 2018.
Association for Computational Linguistics.
[Berend, 2017] G´abor Berend. Sparse coding of neural word embeddings for multilingual sequence labeling. Trans- actions of the Association for Computational Linguistics, 5:247–261, 2017.
[Bernier-Colborne and Barri`ere, 2018] Gabriel Bernier- Colborne and Caroline Barri`ere. CRIM at SemEval-2018 task 9: A hybrid approach to hypernym discovery. InPro- ceedings of The 12th International Workshop on Semantic Evaluation, pages 725–731, New Orleans, Louisiana, June 2018. Association for Computational Linguistics.
[Bojanowskiet al., 2017] Piotr Bojanowski, Edouard Grave, Armand Joulin, and Tomas Mikolov. Enriching word vec- tors with subword information. Transactions of the Asso- ciation for Computational Linguistics, 5:135–146, 2017.
[Bouma, 2009] Gerlof Bouma. Normalized (pointwise) mu- tual information in collocation extraction. InProceedings of GSCL, pages 31–40, 2009.
[Camacho-Colladoset al., 2018] Jose Camacho-Collados, Claudio Delli Bovi, Luis Espinosa-Anke, Sergio Oramas, Tommaso Pasini, Enrico Santus, Vered Shwartz, Roberto Navigli, and Horacio Saggion. SemEval-2018 task 9:
Hypernym discovery. InProceedings of The 12th Interna- tional Workshop on Semantic Evaluation, pages 712–724, New Orleans, Louisiana, June 2018. Association for Computational Linguistics.
[Dashet al., 2020] Sarthak Dash, Md. Faisal Mahbub Chowdhury, Alfio Gliozzo, Nandana Mihindukulasooriya, and Nicolas Rodolfo Fauceglia. Hypernym detection us- ing strict partial order networks. In The Thirty-Fourth AAAI Conference on Artificial Intelligence, AAAI 2020, The Thirty-Second Innovative Applications of Artificial In- telligence Conference, IAAI 2020, The Tenth AAAI Sympo- sium on Educational Advances in Artificial Intelligence, EAAI 2020, New York, NY, USA, February 7-12, 2020, pages 7626–7633, 2020.
[Faruquiet al., 2015] Manaal Faruqui, Yulia Tsvetkov, Dani Yogatama, Chris Dyer, and Noah A. Smith. Sparse over- complete word vector representations. InProceedings of the 53rd Annual Meeting of the Association for Computa- tional Linguistics and the 7th International Joint Confer- ence on Natural Language Processing (Volume 1: Long Papers), pages 1491–1500, July 2015.
[Hearst, 1992] Marti A. Hearst. Automatic acquisition of hy- ponyms from large text corpora. InCOLING 1992 Volume 2: The 15th International Conference on Computational Linguistics, 1992.
[Held and Habash, 2019] William Held and Nizar Habash.
The effectiveness of simple hybrid systems for hypernym discovery. In Proceedings of the 57th Annual Meeting of the Association for Computational Linguistics, pages 3362–3367, Florence, Italy, July 2019. Association for Computational Linguistics.
[Maaroufet al., 2020] Ismail El Maarouf, Youness Mansar, Virginie Mouilleron, and Dialekti Valsamou-Stanislawski.
The finsim 2020 shared task: Learning semantic represen- tations for the financial domain. InProceedings of IJCAI- PRICAI 2020, Kyoto, Japan (or virtual event), 2020.
[Mairalet al., 2009] Julien Mairal, Francis Bach, Jean Ponce, and Guillermo Sapiro. Online dictionary learning for sparse coding. InProceedings of the 26th Annual In- ternational Conference on Machine Learning, ICML ’09, pages 689–696, 2009.
[Murphyet al., 2012] Brian Murphy, Partha Talukdar, and Tom Mitchell. Learning effective and interpretable seman- tic models using non-negative sparse embedding. InPro- ceedings of COLING 2012, pages 1933–1950, December 2012.
[Penningtonet al., 2014] Jeffrey Pennington, Richard Socher, and Christopher Manning. Glove: Global vectors for word representation. In Proceedings of the 2014 Conference on Empirical Methods in Natural Language Processing (EMNLP), pages 1532–1543, October 2014.
[Speer and Havasi, 2012] Robert Speer and Catherine Havasi. Representing general relational knowledge in conceptnet 5. InProceedings of the Eighth International Conference on Language Resources and Evaluation (LREC-2012). European Language Resources Association (ELRA), 2012.
[Subramanianet al., 2018] Anant Subramanian, Danish Pruthi, Harsh Jhamtani, Taylor Berg-Kirkpatrick, and Eduard H. Hovy. SPINE: sparse interpretable neural embeddings. InProceedings of the Thirty-Second AAAI Conference on Artificial Intelligence, (AAAI-18), the 30th innovative Applications of Artificial Intelligence (IAAI-18), and the 8th AAAI Symposium on Educational Advances in Artificial Intelligence (EAAI-18), pages 4921–4928, 2018.