ELECTROPHYSIOLOGICAL
CHARACTERIZATION OF THE AMBLYOPIC NEURAL DEFICIT
Ph.D dissertation
Judit Körtvélyes MD
Scientific adviser:
Prof. Zoltán Vidnyánszky Ph.D, D.Sc.
Éva M. Bankó Ph.D
Péter Pázmány Catholic University Faculty of Information Technology and Bionics
Multidisciplinary Doctoral School of Sciences and Technology
Budapest, 2014
DOI:10.15774/PPKE.ITK.2015.009
“The eyes are useless when the mind is blind.”
Acknowledgments
Foremost, I would like to thank my supervisor, Prof. Zoltán Vidnyánszky for his support and helpful guidance throughout my study and research. I owe special thanks to my other supervisor, Éva Bankó, for her enthusiasm, motivation, continuous practical and theoretical support. I am very grateful to the Doctoral School, especially to Prof. Tamás Roska and Prof. Péter Szolgay for providing the opportunity to spend my Ph.D years in a multi-disciplinary environment. I am also very thankful to Prof. János Németh, head of Department of Ophthalmology, Semmelweis University to support my work.
I would like to thank Zsuzsanna Vágó and Prof. Árpád Csurgay for giving me a deeper understanding of mathematics and physics. I would like to express my sincere gratitude to Prof.
József Hámori and Prof. György Karmos for sharing their knowledge with me and for their encouragement.
Very special thanks to Patrícia Domsa who introduced me to the world of pediatric ophthalmology, for her invaluable support and teaching.
I am also grateful to all my close colleagues, Viktor Gál, István Kóbor, Petra Hermann, Balázs Knakker, Gergely Pápay and Vanda Nemes for all their help, fruitful discussions and the time we spent together.
I say thanks to all my fellow Ph.D students especially to Norbert Béci, András Bojárszky, Balázs Karlócai, Ferenc Lombai, Dániel Szolgay, Barnabás Hegyi, Balázs Gergely Soós, Béla Weiss, Kálmán Tornai and Zoltán Kárász for their help.
I owe a lot to Lívia Adorján and Katinka Tivadarné Vida for their practical and official aid. I am also very thankful to Viktória Sifter from the Library.
I am indebted to all of the patients and healthy controls who participated in our experiments.
In addition thanks are also due to all my friends for being so patient during my busy days.
Last but certainly not least I am tremendously grateful to my sister, my parents and grandparents for all their love and support, especially to my grandfather who always believed in me. I would like to thank my loving husband Kristóf for being beside me.
DOI:10.15774/PPKE.ITK.2015.009
SUMMARY OF ABBREVIATIONS
Abbreviation Concept
AE amblyopic eye
ANOVA analysis of variance
ATS Amblyopia Treatment Studies
BCVA best corrected visual acuity
BO binocular
BOLD blood oxigenation-level dependent
Br broad spatial spectrum
D diopter
Dsph spherical diopter
Dcyl cylindrical diopter
EEG electroencephalogram
ERP event-related potential
ET esotropia
Exp. experiment
FE fellow eye
FFA fusiform face area
fMRI functional magnetic resonance imaging
ITI inter-trial interval
IQR interquartile range
Lo low-pass filtered
mfVEP multifocal visual evoked potential PEDIG Pediatric Eye Disease Investigator Group
RT reaction time
SCD scalp current density
SNR signal to noise ratio
SOA stimulus onset asynchrony
RT reaction time
rTMS repetitive transcranial magnetic stimulation
VA visual acuity
VEP visual evoked potential
XT exotropia
TABLE OF CONTENTS 5
TABLE OF CONTENTS
Chapter One
Introduction... 7
1. Motivations ... 7
2. Amblyopia ... 7
2.1. What is amblyopia? ... 8
2.2. Causes of amblyopia ... 8
2.3. Strabismic and anisometropic amblyopia ... 9
2.4. Treatment ... 11
2.5. Electrophysiological deficits in amblyopia ... 13
2.6. Open questions ... 14
3. Goals of the dissertation ... 15
4. Methods ... 15
Chapter Two
The strength of interocular suppression ... 17
1. Motivations ... 17
2. Materials and methods ... 17
2.1. Subjects ... 17
2.2. Visual stimuli ... 19
2.3. Procedure ... 19
2.4. Data analysis ... 20
3. Results... 21
3.1. Behavioral results ... 21
3.2. Amblyopic effects on amplitude and latency of the early ERP components ... 22
4. Discussion ... 24
Chapter Three
Amblyopic deficits in high-level object processing ... 26
1. Motivations ... 26
2. Materials and methods ... 27
2.1. Subjects ... 27
2.2. Visual stimuli and procedures ... 27
2.3. Electrophysiological acquisition and processing ... 29
2.4. Statistical analysis ... 30
2.5. Analysis of eye tracking data ... 31
3. Results... 32
3.1. Behavioral results ... 32
3.2. Amblyopic effects on the averaged ERP responses ... 32
3.3. Amblyopic effects differ on trial-by-trial latency and amplitude ... 35
3.4. Results of the analysis of the ongoing oscillations ... 40
3.5. Results of the eye-tracking analysis ... 41
3.6. Average-referenced mean ERP responses show similar amblyopic effects ... 42
4. Discussion ... 43
Chapter Four
Amblyopic deficit beyond the fovea ... 46
1. Motivations ... 46
2. Materials and methods ... 47
DOI:10.15774/PPKE.ITK.2015.009
2.1. Subjects ... 47
2.2. Visual stimuli and procedures ... 48
2.3. Electrophysiological acquisition and processing ... 51
2.4. Statistical analysis ... 51
2.5. Analysis of eye-tracking data ... 52
3. Results ... 53
3.1. Behavioral results ... 53
3.2. Averaged ERPs show amblyopic deficit both at the fovea and perifovea... 54
3.3. Amblyopic latency distributions display both foveal and perifoveal deficit ... 62
3.4. Fellow eye ERPs do not differ significantly from control ERPs ... 62
4. Discussion ... 64
4.1. Importance of cortical magnification ... 65
4.2. Deficient ERP response timing in amblyopia... 65
4.3. Unaltered amblyopic ERP response strength at the periphery ... 66
Chapter Five
Conclusions and possible applications... 67
Chapter Six
Summary ... 70
New scientific results ... 70
Bibliography ... 72
Motivations 7
C h a p t e r O n e
INTRODUCTION
1. Motivations
Amblyopia, commonly known as lazy eye, is a developmental visual disorder, which starts at an early age. A key issue in its treatment is an early diagnosis. For best results correction should happen no later then 3-5 years. However, methods used to diagnose visual impairment in children are not efficient enough and cannot be applied successfully for wide range population screening at an early age. As a result, most of the children affected by visual impairments resulting in amblyopia are only diagnosed at school age when the impairment has fully developed and chances of effective therapy are significantly lower. The consequences of not identifying and treating amblyopia early include permanent visual impairment, poor fine motor skills, adverse effects on school performance, social interactions and self-image.
In Hungary this is a prominent issue, since according to estimates the prevalence of amblyopia is larger here than in other developed countries (2-3% instead of 1.6%). In addition, among the goals of “Vision 2020”, a worldwide program launched by WHO to eliminate avoidable blindness, the fight against amblyopia receives high priority in Hungary, too.
2. Amblyopia
The earliest clinical description of human amblyopia is generally credited to Le Cat in 1713.
Pioneering work by David Hubel and Torsten Wiesel, based on animal models, led to the hypothesis that amblyopia is the result of competition between each eye’s afferents into the visual cortex during the formative stages of the visual system [15, 16]. Amblyopia literally means "dullness of vision" (from the Greek amblyos—dull; opia, from the stem ops—vision) [17]. It arises from abnormal visual experiences in early childhood. According to large population studies it occurs in 1.6-3.6% of the population [18–22] with evidence that the rate is even higher in medically underserved populations [23]. With 625 million children under the age of 5 years worldwide, more than 15 million may have amblyopia, and more than half of them will not be identified before they reach school age [24]. Amblyopia accounts for more cases of unilateral reduced vision in children than all other causes combined [25].
DOI:10.15774/PPKE.ITK.2015.009
2.1. What is amblyopia?
Amblyopia has traditionally been defined by what it is not, rather than by what it is.
Definitions often include aphorisms such as a disorder “in which the patient sees nothing and the doctor sees nothing” [26, 27]. It can be defined as a unilateral or, less commonly, bilateral reduction in best corrected visual acuity, not directly attributed to a structural abnormality of the eye or posterior visual pathways. Eyes appear normal on physical examination. Unilateral amblyopia is clinically defined as a two-line difference of best corrected visual acuity between the eyes. It is one of the most common causes of vision loss and primary causes are strabismus, anisometropia (significant difference in refractive error between the two eyes) and stimulus deprivation (in particular congenital cataract and ptosis). Early detection of amblyopia is crucial in obtaining the best response to treatment. If treated early in life, is completely or partially reversible [17].
Permanent monocular visual impairment due to amblyopia is a risk factor for total blindness if the better seeing eye is injured or if the fellow eye is affected by disease later in life [28, 29]. This fact adds urgency to our efforts to learn more about this disorder. The lifetime risk of blindness because of loss of the better eye is 1.2% [30]. If the better seeing eye is lost, the visual acuity of 10% of amblyopic eyes can improve [31]. These findings suggest there is some plasticity in the visual system of a few visually mature individuals with amblyopia.
Based on animal studies [32] and functional human neuroimaging [33], amblyopia can be defined as a disorder in which there is dysfunction in the processing of visual information.
This dysfunction is usually detected and evident as reduced recognition visual acuity, although the abnormalities include many types of visual function [34] such as contrast-sensitivity function (CSF), vernier acuity as well as spatial distortion [35], abnormal spatial interactions [36, 37], impaired contour detection [38] and binocular abnormalities such as impaired stereoacuity and abnormal binocular summation. Although clinical ocular examination is most often entirely normal, microscopic anatomical and structural abnormalities have been found in the retina [39], lateral geniculate bodies [40], and visual cortex [41]. The visual deficiencies are thought to be irreversible after the first decade of life, by which time the developmental maturation window has been terminated.
2.2. Causes of amblyopia
The degradation of the image, and subsequent central suppression that leads to amblyopia, results from one of three causal processes (
Table 1.1
). About a third of amblyopia is caused by strabismus (ocular deviation), a third by anisometropia (unequal interocular refractive error), and a third by a combination of both disorder types [27, 42, 43]. Deprivation amblyopiaAmblyopia 9
results from occlusion of the pupil and lack of pattern stimulation. It seems to be rare, based on the incidence of the primary causative factors such as infantile cataract (2 to 4.5 of every 10000 births) [44, 45], corneal dystrophy, ptosis, media opacities, or excessive patching therapy for amblyopia treatment (reverse amblyopia) accounting for only up to 3% of cases [46], but it has the most potential to cause severe amblyopia.
Features Unilateral or
bilateral effect Strabismus
(ocular misalignment)
The eyes do not receive corresponding images on the fovea
Unilateral
Anisometropia
(difference in refractive error)
One foveal image is more blurred than the other
Unilateral
Deprivation
(including ametropia—ie, large symmetric refractive errors)*
Physical obstruction of one image (eg. cataract, ptosis, or bilateral blur from uncorrected refractive error)
Either
Table 1.1. Causes of amblyopia [27]. *Amblyopia is the residual visual deficit after the physical obstruction is removed and appropriate optical correction is provided.
2.3. Strabismic and anisometropic amblyopia
Strabismic and anisometropic amblyopia differ in the spectrum of associated visual deficits despite their common effect on visual acuity. Levi and Klein found that in amblyopes with strabismus the deficits in optotype acuity and in Vernier acuity were disproportionately greater than the deficit in grating acuity, whereas anisometropic amblyopia is associated with proportional deficits in optotype, vernier, and grating acuity [47, 48]. There are two hypotheses regarding the source of differences in the pattern of visual deficits between these two types of amblyopia. First is the etiology hypothesis, the differences may reflect fundamentally different pathophysiological processes [49]. For example, sparse/irregular sampling may be associated with binocular competition between two discordant images in strabismus but not between the sharp versus defocused images in anisometropia. The second hypothesis is the effective age hypothesis, the different constellations of spatial deficits in anisometropic and strabismic amblyopia reflect the degree of visual maturation present at the onset of amblyopia [49]. That is anisometropic amblyopia may arise at an age where visual maturation is more complete [22]. Birch at al. found the same, that anisometropia may develop later, and become an etiologic factor for amblyopia primarily after 3 years of age or another
DOI:10.15774/PPKE.ITK.2015.009
alternative is that anisometropia may be present early but requires a longer duration than strabismus to cause amblyopia [22].
Both types of amblyopia show a selective decrease in foveal vision [35], however, tests of contrast sensitivity also indicate some peripheral field visual deficits [50]. The deficit is generally more limited to central vision in strabismic amblyopia [51], which is thought to be similar to peripheral vision, compared to anisometropic amblyopia, which is like blurred normal foveal vision [52, 53]. This distinction is in agreement with the differential effect of flankers in anisometropic and strabismic amblyopes in visual crowding experiments [36, 52, 54].
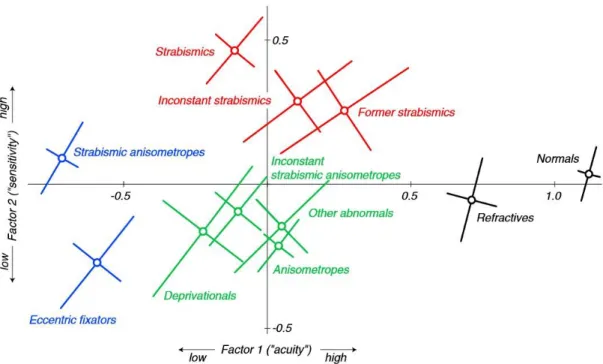
Figure 1.1. McKee’s “amblyopia map”: Factor 1 (“acuity”): acuity measures (optotype, Vernier, and grating). Factor 2 (“sensitivity”): contrast sensitivity measures (edge contrast and PelliRobson contrast thresholds). The coloring captures the four broad categories: normal or near-normal (black), moderate acuity loss with superior (red) or impaired (green) sensitivity, and severe acuity loss (blue). These four zones correspond roughly to a traditional classification scheme: normals (black), strabismics (red), anisometropes (green), and strabismic anisometropes (blue) [34].
In McKee’s “amblyopia map” strabismics show supernormal sensitivity (edge contrast and PelliRobson contrast thresholds), well above that of the anisometropes. Anisometropes, despite their poor sensitivity, show an acuity (optotype, Vernier, and grating acuity) that is as good or perhaps slightly better than strabismics (Figure 1.1) [34]. Many eccentric fixators are probably strabismic anisometropes with severe visual acuity loss. In the same study two thirds of the anisometropes passed motion integration, randot circles tests, while only about 10% of constant strabismics passed both tests.
Amblyopia 11
There is evidence that using checkerboard patterns calcarine activity as measured with fMRI was most suppressed for low spatial frequency stimuli in strabismics, while in anisometropic patients it was most reduced for high frequency patterns [55, 56]. On the other hand, the fMRI study by Conner and colleagues [57] has failed to differentiate anisometropic and strabismic subtypes based on fMRI activation levels in retinotopic maps of V1 and V2, while animal studies of contour/motion integration and form detection also found similar deficiencies for the amblyopic eyes of both strabismic and amblyopic monkeys [58, 59].
Kiorpes and colleagues [60] in a macaque study also found that physiological changes associated with amblyopia were related to the severity, not the etiology, of the visual losses.
2.4. Treatment
In the past several years much has been published regarding the treatment of this disease, owing mostly to a series of Amblyopia Treatment Studies (ATS) undertaken by the Pediatric Eye Disease Investigator Group (PEDIG). These studies were designed to evaluate the traditional methods for treating amblyopia and provide evidence on which to base treatment decisions.
In general, treatment for amblyopia consists of depriving the healthy eye of visual input by patching or by optical or pharmaceutical penalisation to force the use of the amblyopic eye. In deprivation amblyopia, the cause of the visual deprivation needs to be addressed first and then the disorder should be treated similarly to other types of amblyopia. In anisometropic amblyopia, refractive errors need to be corrected with spectacles or contact lenses or refractive surgery. In strabismic amblyopia, conventional wisdom states that amblyopia should be treated first, and that correction of the strabismus will have little if any effect on amblyopia, although the timing of surgery is controversial [27].
Table 1.2 summarises the degrees of refractive error thought to induce amblyopia.
With the optimum refractive correction in place, any residual visual deficit is, by definition, due to amblyopia. Convincing evidence indicates that continued spectacle wear is therapeutic in its own right, providing a clear image to the fovea of the amblyopic eye for perhaps the first time.
Patching, atropine
Patching and atropine have been used to treat amblyopia for hundreds of years. Only in the last 15 years have randomized clinical trials been conducted to evaluate the effectiveness of amblyopia treatment and to begin to define optimal treatment protocols. Occlusion therapy with patching of the dominant eye has been the cornerstone of amblyopia treatment. On average, 120 h of occlusion results in a one-line (0.1 logMAR) improvement in visual acuity at 6 years of age [61]. Beyond the critical period for plasticity, supervised patching (movie
DOI:10.15774/PPKE.ITK.2015.009
watching while dominant eye patched) has been shown to have positive impact for anisometropic, but not for strabismic amblyopia in adults [62].
Atropine is used as a 1% drop to the healthy eye, blocking parasympathetic innervation of the pupil and ciliary muscle and causing pupillary dilatation and loss of accommodation, thus blurring the vision at near and allowing the amblyopic eye to be used preferentially. Atropine penalization works less quickly than occlusion [63] and generally has been advocated for amblyopia with vision better than 20/100, because it may not be sufficient to switch fixation in severe amblyopia [24]. In some cases, occlusion and atropine penalization may be combined.
Prescribing guidelines for children aged 2–3 years*
Spectacle requirements before entry into recent randomised trials†
Anisometropia **
Hyperopic ≥+1·50D ≥+1·00D
Astigmatism ≥2·00D ≥1·50D
Myopic ≥–2·00D ≥–1·00D
Symmetric
Hyperopia ≥+4·50D >+3·00D
Myopia ≥–3·00D >–3·00D
Table 1.2. Degrees of refractive error thought to induce amblyopia [27]. ** asymmetric refractive error,
*Based on prescribing guidelines from the American Academy of Ophthalmology for refractive error recorded in a routine eye examination and the philosophy of preventing ambylopia. (American Academy of Ophthalmology. Pediatric eye evaluations, preferred practice pattern. San Francisco, CA, USA: American Academy of Ophthalmology, 2002.), †Based on the minimum amount of refractive error that should be first treated with spectacles, with respect to reduced visual acuity in recent randomised trials by the Pediatric Eye Disease Investigator Group (PEDIG) [64–66].
Levodopa and citocholine
Oral levodopa (which is used to treat Parkinson’s disease) and citocholine have been reported in treatment of amblyopia and has shown effects seen on both visual acuity and functional MRI [67–72]. The neuropsychiatric side-effects of these drugs render their use unlikely in routine clinical practice for amblyopia treatment.
Repetitive transcranial magnetic stimulation (rTMS)
It has been reported that a single session of 1 Hz or 10 Hz repetitive transcranial magnetic stimulation (rTMS) and continuous theta burst stimulation (cTBS) of the visual cortex can improve contrast sensitivity in adults with amblyopia [73, 74].
Amblyopia 13
Visual stimulation, perceptual learning
While it is widely believed that amblyopia cannot be treated successfully after the age of about 10, recent studies show that the adult human visual cortex retains a significant degree of plasticity. The stimuli used are very diverse, ranging from Gabor stimuli to different video games and dichoptic training (e.g. tetris) [75]. The perceptual learning therapy of the amblyopic eye leads to significant improvements in visual functions (e.g. visual acuity, stereopsis), especially when both eyes are stimulated simultaneously during the visual training as opposed to conventional procedures that severely penalize the good eye [75–86]. These findings raise the hope that perceptual learning could become a new therapeutic means for treating amblyopia beyond the sensitive period, which currently has no clinically validated treatment option.
2.5. Electrophysiological deficits in amblyopia
Several studies have been performed with electrophysiological methods used in humans and in animal models, to investigate the amblyopic dysfunction of the visual system. Visually evoked potentials provide direct means of measuring the electrical responses of the brain in humans with naturally occuring amblyopia. Using diffuse light flashes, several investigators have reported a decrease in the amplitude of the cortical response to stimulation of the amblyopic eye [87, 88], while others have found no difference between the two eyes [89–91]. When pattern stimuli are used, the results are more consistent, with most investigators reporting decreased amplitude and/or increased latency in the response obtained when stimuli are presented to the amblyopic eye [90–95]. However, most of these earlier studies have restricted the temporal presentation of the gratings or the repetition rate of the diffuse flash to only a small number of temporal frequencies [96].
The reduced function of the amblyopic eye evident in the VEP to spatial contrast is greater for high than for low spatial frequencies, and probably reflects abnormalities of the central portion of the visual field [97].
Most neurophysiologic studies conducted on human amblyopes has focused on the early, low-level visual cortical processing deficits - responsible for e.g. reduced visual acuity and contrast sensitivity [98, 99] -, which are reflected in the P1 component of the visual- evoked responses (VEPs) [41, 96, 100, 101]. However, higher order visual functions (e.g.
global form and motion processing) are also affected [102–106], a recent study showing that global motion signal evokes reduced VEP in amblyopia [107].
Traditionally, amblyopia has been regarded as a disorder limited to the central retina [108], even though there exist studies that question this notion [50, 109]. Full-field pattern- reversal VEP studies [101, 110] support the dominantly central deficit in amblyopia based on the lack of interocular difference when using large check sizes (>60’), where response are
DOI:10.15774/PPKE.ITK.2015.009
thought to predominantly arise from neurons processing the periphery of the visual field [101, 111–113]. Stimulation of the amblyopic eye with small check sizes (<30’), on the other hand, which preferentially activates the foveal area [101, 111–113] as it only elicits measurable VEP responses up to 2-4 degrees eccentricity [111], yield drastically reduced and delayed VEP responses. Similar divergence is obtained in studies using small central and large annular stimuli for the stimulation of the fovea and perifovea, respectively [114, 115]. As opposed to full-field VEP, the multifocal VEP (mfVEP) technique is capable of directly investigating peripheral processing by stimulating the visual field at different eccentricities. These studies, on the other hand, tend to find amplitude and latency differences at the perifoveal region as well as the fovea, even though smaller in size [116–118].
2.6. Open questions
1. Previous research revealed that in monocular viewing condition, stimuli presented to the amblyopic eye lead to reduced and delayed visual evoked potentials (VEP) as compared to the stimulation of the fellow eye [41, 96, 100, 101, 107]. Similarly, fMRI responses are also decreased for stimuli presented in the amblyopic eye compared to the fellow eye both in monocular viewing condition as well as in the case when stimuli are presented separately to the amblyopic and fellow eye using red-green glasses [102, 114, 119–123]. However, it is not known whether and to what extent neural responses to the visual information coming from the amblyopic eye is suppressed during binocular viewing condition.
2. The extensive behavioral research in the past decades revealed that amblyopia involves both low level (e.g. reduced visual acuity and contrast sensitivity) [98, 99]
and higher-order (e.g. global form and motion processing) visual deficits [102–106].
In agreement with this, human fMRI studies showed reduced fMRI responses throughout the visual processing hierarchy – including the lateral geniculate nucleus, the striate and extra-striate cortex [57, 102, 114, 121–123]. In spite of this, neurophysiologic research in human amblyopes has focused on the early, low-level visual cortical processing deficits, which are reflected on the P1 component of the visual-evoked responses (VEPs) [41, 96, 100, 101] with an exception of a recent study showing that global motion signal evokes reduced VEP in amblyopia [107]. As a result, it is not known how the temporal structure and strength of neural responses at the higher, object-specific stages of visual information processing are altered in human amblyopia.
Goals of the dissertation 15
3. Traditionally, amblyopia has been regarded as a disorder limited to the central retina [108], even though there exist studies that question this notion [50, 109]. As the results collected over some four decades are equivocal, no consensus has been reached so far how the peripheral visual field is affected in amblyopia. Today only strabismic amblyopia is considered a deficit primarily of central vision as early psychophysical investigations found that contrast detection threshold [51], acuity [124–126] and binocular interactions [127] are similar between the two eyes from eccentricities of 20˚ on. This is in agreement with macaque single unit recording [60] and human fMRI studies [114] that also found no peripheral interocular differences in strabismic amblyopia. On the contrary, other studies investigating both strabismic and anisometropic amblyopes have shown decreased sensitivity of the amblyopic eye in the periphery for motion detection and discrimination [109] and contrast detection [50] in the eccentricity range of 10-30deg. The extent of the amblyopic loss in the periphery in both experiments was related to the degree of foveal loss rather than the type of amblyopia.
3. Goals of the dissertation
1. In accordance with the above, the present dissertation focuses on whether and to what extent neural responses to the visual information coming from the amblyopic eye is suppressed during binocular viewing condition.
2. It also aims at uncovering the neural mechanisms of amblyopic disruption of early visual experience and understanding the nature of amblyopic deficits at different stages of visual information processing.
3. It's final goal is to investigate cortical processing of the amblyopic eye outside the foveal area by scaling the stimulus size, thus, keeping the stimulated area of the visual cortex constant at different eccentricities.
4. Methods
Throughout the course of my work I have collected the patients, and performed the clinical examinations: refraction, visual acuity test (ETDRS chart), contrast sensitivity test (SWCT- 1000), binocular vision tests (Bagolini striated glasses test, Worth 4 dot test, Lang stereo test, Titmus test), ocular aligmment examination, anterior segment and fundus examination with slit lamp. I have used a wide array of experimental methods applicable in cognitive neuroscience research: psychophysics, electrophysiology with classical ERP. For writing
DOI:10.15774/PPKE.ITK.2015.009
experimental presentations and scripts for analyzing the results I used Matlab 7.1 (The MathWorks Inc., Natick, MA, USA) with various toolboxes for presentation (Psychtoolbox 2.54 - [128], [129]) and for data analysis (Psignifit - [130]) alongside other commercial software (Brain-Vision Analyzer 1.05 - EEG preprocessing, Brainproducts GmbH., Munich, Germany). I recorded EEG with a BrainAmp MR amplifier (Brainproducts GmbH., Munich, Germany) with 64 Ag/AgCl electrodes mounted in an EasyCap (Easycap GmbH, Herrsching- Breitbrunn, Germany). I used Statistica 9 for statistical analysis and iViewX Hi-Speed tracking column (SMI GmbH, Germany) for eye-tracking.
We chose faces for stimuli as opposed to the more conventional checkerboard or sine wave grating/Gabor patch stimuli in our experiments because they are natural, ecologically valid stimuli and it is possible to control their spatial frequency content just as well as using Gabor patches. In addition our research group is specialized for studying face processing with eletrophysiological and fMRI methods. Thus, we have prior knowledge about the validity of our single-trial peak detection approach on the event-related potentials evoked by faces. Even though it has been previously shown that there is a face specific processing deficit in amblyopia [102], the amblyopic deficit in early neural processing, as reflected in the P1 component, should not be significantly affected by the stimulus used.
Face processing is one of the most researched fields of cognitive neuroscience, since the majority of socially relevant information is conveyed by the face, rendering it as a stimulus of exquisite importance. Faces are considered a special class of stimuli with dedicated neural processing mechanisms that differ from that of other nonface objects. Opinions differ on the reason underlying their special status: one group of researchers claims that faces are processed by cortical areas entirely dedicated to face processing [131, 132], while others argue that the specific responses obtained for faces is a result of the type of judgment we are required to make whenever viewing a face: differentiating that individual face from the rest (i.e.
subordinate level of categorization) and also the level of expertise with which we make these categorization judgments [133, 134]. Within the processing circuits there is evidence for a certain degree of separation between changeable (such as expression, lipspeech and eye gaze) and invariant facial attributes (such as identity and gender), the former being coded/processed predominantly in the superior temporal sulcus (STS), the later in the fusiform face area (FFA) [135]. This separation is not exclusive however, since there is significant overlap [136].
Motivations 17
C h a p t e r T w o
THE STRENGTH OF INTEROCULAR SUPPRESSION
1. Motivations
Amblyopia is a visual disorder affecting primarily foveal vision and is caused by an anomalous early visual experience. It has been suggested that suppression of the visual input from the weaker eye might be a primary underlying mechanism of the amblyopic syndrome (for review see [137]). In agreement with this, previous research revealed that in monocular viewing condition, stimuli presented to the amblyopic eye lead to reduced and delayed visual evoked potentials (VEP) as compared to the stimulation of the fellow eye [41, 96, 100, 101, 107]. Similarly, fMRI responses are also decreased for stimuli presented in the amblyopic eye compared to the fellow eye both in monocular viewing condition as well as in the case when stimuli are presented separately to the amblyopic and fellow eye using red-green glasses [102, 114, 119–123]. However, it is not known whether and to what extent neural responses to the visual information coming from the amblyopic eye is suppressed during binocular viewing condition.
To address this question we measured event-related potentials (ERP) to foveal face stimuli in amblyopic patients, both in monocular and binocular viewing conditions. We compared the ERP responses obtained in the binocular viewing condition to those in the monocular stimulation of the amblyopic and fellow eye. We reasoned that strong and efficient suppression of the visual input from the amblyopic eye in the binocular viewing condition would result in ERP responses very similar to those in the monocular stimulation of the fellow eye. On the other hand, if amblyopic input is not or only weakly suppressed during binocular stimulation, it might affect both the amplitude and delay of the early ERP components and thus result in altered ERP responses in the case of binocular compared to the fellow eye stimulation.
2. Materials and methods
2.1. Subjects
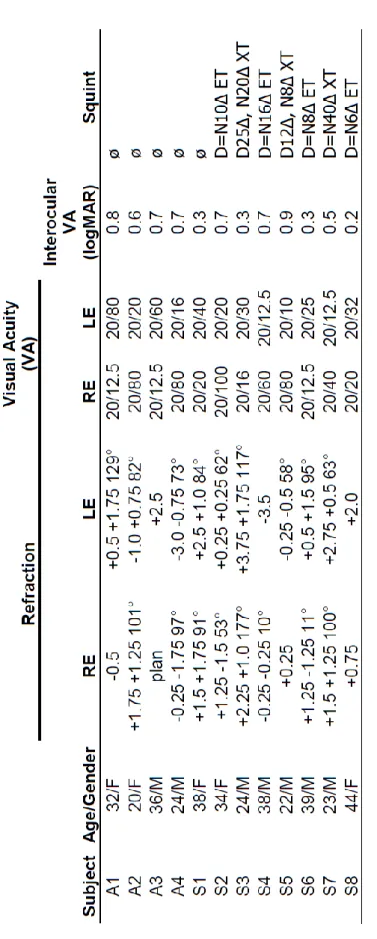
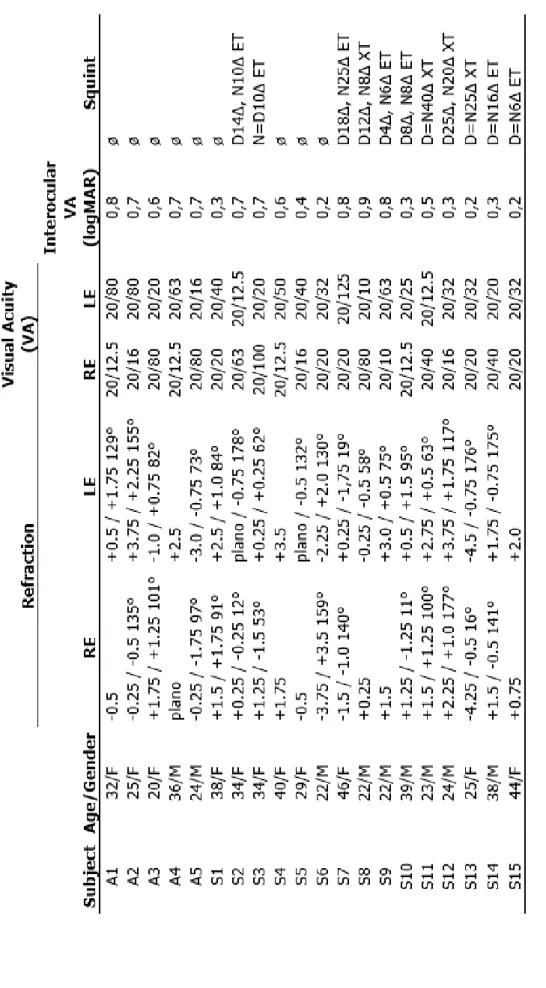
Twelve amblyopic subjects (5 females, 9 right-handed, mean age: 31 years) participated in the experiment. In six cases the amblyopic eye was their right eye. None of them had any history of neurological or psychiatric diseases and all had normal or corrected-to-normal visual acuity of the dominant fellow eye (see Table 2.1 for more details).
DOI:10.15774/PPKE.ITK.2015.009
Table 2.1. Clinical details of amblyopic subjects (RE: right eye, LE: left eye, D: distant, N: near, ET: esotropia, XT: exotropia)
Materials and methods 19
2.2. Visual stimuli
Participants viewed images of human faces and performed a gender categorization task. Face- stimuli consisted of front view grayscale photographs of four female and four male neutral faces that were cropped and covered with a circular mask to eliminate the outer features. All images were equated for luminance and contrast. Stimuli were presented centrally on a uniform gray background and subtended 2 visual degrees, matching approximately the size of the fovea.
2.3. Procedure
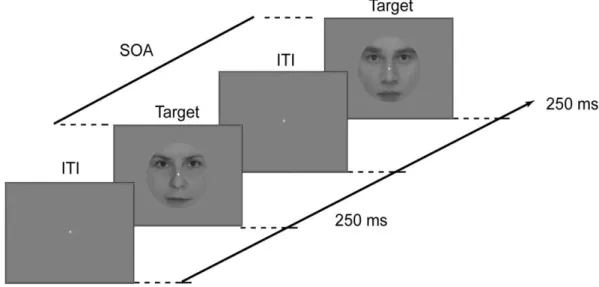
Gender categorization was measured by a two-alternative forced choice procedure. Subjects were required to judge the gender of the face images (female/male) as accurately and fast as possible, indicating their choice with one of the mouse buttons. Button assignment was left for female and right for male for half of the subjects and was reversed for the other half. Each stimulus was presented for 250 ms followed by a response window which lasted until the subjects responded but was maximized in 2 s (Figure 2.1). The fixation point was present throughout the entire trial. In the experiment, the inter-trial interval (ITI) was randomized in the range of 1600–1800 ms. Viewing was monocular with the amblyopic eye (AE) in one block and with the dominant fellow eye (FE) in another while the unused eye was patched, while in yet another block viewing was binocular (BO). Each participant completed one run per eye yielding 128 trials each. Stimulus presentation was controlled by MATLAB 7.1. (The Math-Works) using the Cogent 2000 toolbox (http://www.vislab.ucl.ac.uk/cogent.php).
Figure 2.1. Experimental design. In experiment 1 the inter-trial interval (ITI) was randomized in the range of 1600–1800 ms after the response had been made.
DOI:10.15774/PPKE.ITK.2015.009
In the EEG experiment, visual stimuli were presented on a 26” LG LCD monitor at a refresh rate of 60 Hz and were viewed from 56 cm.
2.4. Data analysis
Behavioral Data Analysis
Responses and reaction times were collected during both experiments. Data was rank transformed where needed to correct for inhomogeneity of variances and entered into one-way repeated-measures ANOVAs with eye (BO vs. FE vs. AE) as within subject factor with Greenhouse-Geisser correction for non-sphericity; post-hoc t-tests were computed using Tukey HSD tests.
Electrophysiological Recording and Analysis
EEG data were acquired using a BrainAmp MR (Brainproducts GmbH., Munich, Germany) amplifier from 60 Ag/AgCl scalp electrodes placed according to the extended 10-20 international electrode system and mounted on an EasyCap (Easycap GmbH, Herrsching- Breitbrunn, Germany) with four additional periocular electrodes placed at the outer canthi of the eyes and above and below the right eye for the purpose of recording the electrooculogram.
All channels were referenced to joint earlobes online; the ground was placed on the nasion. All input impedance was kept below 5 kΩ. Data were sampled at 1000 Hz with an analog bandpass of 0.016–250 Hz and re-referenced offline using a Laplacian transform on spherical spline interpolated data (4th order splines, maximum degree of Legendre polynomials:10, lambda: 10-5) to generate scalp current density (SCD) waveforms. The SCD data is reference independent and displays reduced volume conduction eliminating raw EEG contamination from saccadic potentials [138]. Subsequently, a digital 0.1 Hz 12 dB/octave Butterworth Zero Phase high-pass filter was used to remove DC drifts, and a 50 Hz notch filter was applied to minimize line-noise artifacts. Finally, a 24 dB/octave low-pass filter with a cutoff frequency of 30 Hz was applied. Data was segmented (see below) and trials that contained voltage fluctuations exceeding ±100 μV, or electro-oculogram activity exceeding ±50 μV were rejected. Data processing was done using BrainVision Analyzer (Brainproducts GmbH., Munich, Germany).
The trial-averaged EEG waveform – i.e. the event-related potential (ERP) – was computed as follows. Data was segmented into 1000 ms epochs starting from 200 ms preceding the stimuli. Segments were baseline corrected over a 200 ms pre-stimulus window, artifact rejected and averaged to obtain the ERP waveforms for each subject for each condition. Subject ERPs were averaged to compute the grand average ERP for visualization
Results 21
purposes. Statistical analysis was performed on early component peaks (P1, N170) of the averaged ERP waveform. Early peak amplitudes were computed as follows: peak latency was determined individually on pooled electrodes from left and right clusters (P7, P9, PO7, and PO9 and P8, P10, PO8, and PO10) separately, while mean peak amplitudes were measured over the individual electrodes in the above clusters in a 10 ms window centered on the peak latencies. The clusters included electrodes where P1 and N170 showed their maxima, which happened to coincide due to the SCD transform. Amplitude and latency values were rank transformed where needed to correct for inhomogeneity of variances and analyzed by three- way repeated-measure ANOVAs with eye (BO vs. FE vs. AE), side (2) and electrode (4) as within-subject factors separately for each component. Greenhouse-Geisser correction was applied to correct for possible violations of sphericity. Post-hoc t-tests were computed using Tukey HSD tests.
We assessed the relationship using Pearson correlation between the relative changes (AE-FE) in ERP component amplitude and latency and the difference in interocular visual acuity (VA) (AE-FE) expressed in logMAR values obtained at a distance of 4 m with the best refractive correction, the difference in performance (FE-AE) and in reaction time (RT) (AE- FE). Latency and amplitude measures can be treated as independent, while measured values over the different hemispheres and different behavioral measurements are strongly dependent on each other. Therefore, the significance threshold was set to p=0.025 (pBonf =0.05) to correct for the multiple comparisons problem.
3. Results
3.1. Behavioral results
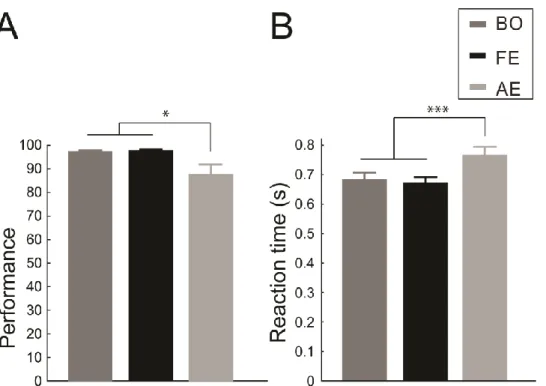
Performance in the gender categorization task was decreased when stimuli were presented in the amblyopic eye (rank ANOVA: main effect of eye: F(2,22)=5.57, pG-Gcorr=0.021, post hoc:
p=0.036, p=0.014 compared with binocular viewing and the fellow eye conditions, respectively, Figure 2.2A). Similar amblyopic effects were found on the reaction times:
responses with amblyopic viewing were significantly slower than in the other two conditions (main effect of eye: F(2,22)=14.58, pG-Gcorr=0.0003, post hoc: p=0.0008 and p=0.0003 compared with the binocular viewing and the fellow eye condition, respectively, Figure 2.2B) Importantly, however, performance and reaction times did not differ between the presentation to the fellow eye and the binocular viewing condition (post hoc: BO vs. FE p=0,911 and p=0,84 for performance and RTs, respectively).
DOI:10.15774/PPKE.ITK.2015.009
Figure 2.2. Behavioral results. (A) Accuracy and (B) reaction times in the binocular, fellow eye and amblyopic viewing conditions. In all cases the amblyopic eye performed worse/slower, while there was no difference between the fellow eye and binocular viewing (N=12, * p<0.05; *** p<0.001).
3.2. Amblyopic effects on amplitude and latency of the early ERP components
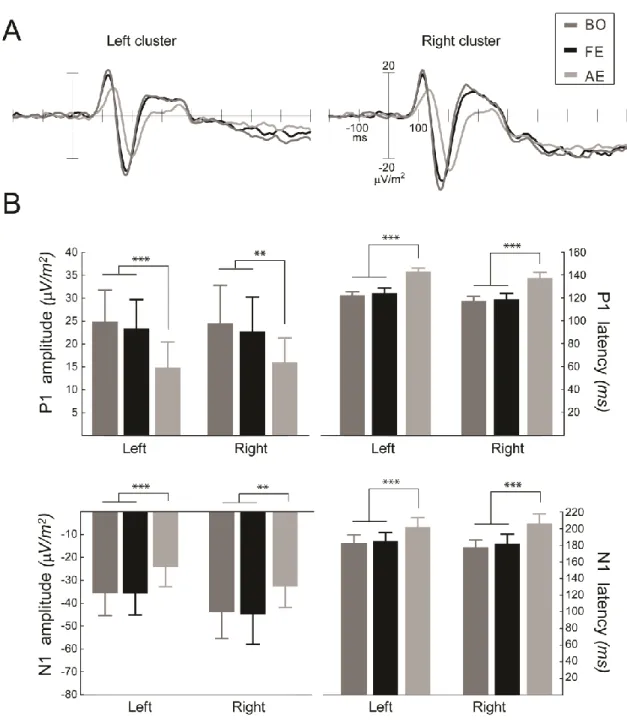
Electrophysiological results revealed that amblyopia has a profound effect on the amplitude and latency of the early event-related potential (ERP) components. Viewing with the amblyopic eye resulted in reduced amplitudes (rank ANOVA: main effect of eye:F(2,22)=11.00, pG-Gcorr=0.0036 and F(2,22)=8.28, pG-Gcorr=0.007 for the components P1 and N170, respectively; post hoc: AE vs. BO p=0.0008, AE vs. FE p=0.0035 for the component P1, post hoc: AE vs. BO p=0.0065, AE vs. FE p=0.0043 for the component N170) and increased latencies (main effect of eye: F(2,22)=18.18, pG-Gcorr=0.0004 and F(2,22)=25.47, pG-Gcorr<0.0001 for the components P1 and N170, respectively, post hoc AE vs. BO p=0.0002, AE vs. FE p=0.0002, for the component P1, post hoc: AE vs. BO p=0.0001, AE vs. FE p=0.0002, for the component N170) compared with the fellow eye and the binocular viewing condition for both early ERP components (Figure 2.3A). However, in accordance with the behavioral results, there was no difference in the early ERP responses between the fellow eye presentation and the binocular viewing condition (post hoc: BO vs. FE p=0.79 and p=0.98 for the P1 and N170 amplitude, respectively; p=0.89 and p=0.63 for the P1 and N170 latency, respectively).
Results 23
Figure 2.3. Electrophysiological results. (A) Amblyopic effects on the grand average ERPs of the left and right electrode cluster (P7, P9, PO7, and PO9 and P8, P10, PO8, and PO10). (B) Amblyopic effects on the P1 and N170 component amplitude and latency. Stimulation of the amblyopic eye resulted in reduced amplitudes and increased latencies of both early visual ERP components compared with either the fellow eye or the binocular viewing condition, while the latter two differed neither in amplitude nor in latency (N=12, ** p<0.01; *** p<0.001).
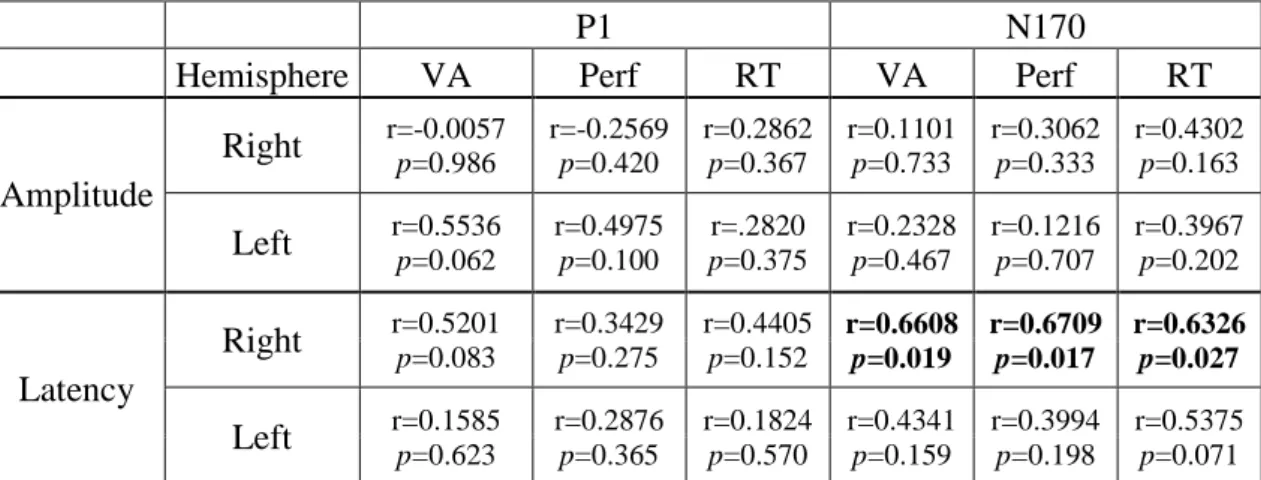
Next, we tested the relationship between the amblyopic effects measured on the ERP components (i.e. interocular difference in the amplitude and latency of the early components) and the amblyopic impairment in visual acuity (VA, logMAR), face gender categorization performance and reaction times. We found significant correlation between the amblyopic effects on the behavioral measures and on the latency of the N170 component over the right hemisphere (N170 latency vs. VA r=0.66, p=0.019; N170 latency vs. performance r=0.67,
DOI:10.15774/PPKE.ITK.2015.009
p=0.017; N170 latency vs. RT r=0.63, p=0.027). Amblyopic effects on the N170 over the left hemisphere and on the P1 component showed no correlation with the amblyopic impairments found on the behavioral measures. Behavioral impairments also did not correlate with the amblyopic effects on the amplitudes of either component (see Table 2.2).
P1 N170
Hemisphere VA Perf RT VA Perf RT
Amplitude
Right
r=-0.0057 p=0.986 r=-0.2569 p=0.420 r=0.2862 p=0.367 r=0.1101 p=0.733 r=0.3062 p=0.333 r=0.4302 p=0.163Left
r=0.5536 p=0.062 r=0.4975 p=0.100 p=0.375 r=.2820 r=0.2328 p=0.467 r=0.1216 p=0.707 r=0.3967 p=0.202Latency
Right
r=0.5201 p=0.083 r=0.3429 p=0.275 r=0.4405 p=0.152 r=0.6608 p=0.019 r=0.6709 p=0.017 r=0.6326 p=0.027Left
r=0.1585 p=0.623 r=0.2876 p=0.365 r=0.1824 p=0.570 r=0.4341 p=0.159 r=0.3994 p=0.198 r=0.5375 p=0.071Table 2.2. Pearson r and p values of the correlation analysis between the amblyopic effect on peak amplitudes/latencies and the amblyopic effect on behavioral measures. N= 12, VA: visual acuity, Perf:
performance, RT: reaction time. Significant correlations are indicated by bold face.
4. Discussion
The results revealed no difference in the amplitude and latency of early P1 and N170 components of the ERP responses between the binocular and fellow eye stimulation. This is in accordance with the behavioral results showing that face gender categorization performance and reaction times are identical when stimuli are presented binocularly or to the fellow eye. On the other hand, in agreement with previous results we found strong amblyopic effects on the behavioral measures as well as on the P1 and N170 ERP components in the case of monocular stimulation of the amblyopic eye.
Previous research investigating interocular suppression in healthy visual systems revealed that suppression processes might start very early in visual processing [138–141].
Furthermore, previous psychophysical [142, 143] and fMRI [105, 106, 119] studies provided converging evidence that information conveyed by the non-dominant stimuli during binocular rivalry might almost entirely be suppressed in ventral areas of the visual cortex. In addition, an fMRI study investigating the processing of faces in amblyopia using anaglyph stimuli found almost no activation in FFA during amblyopic stimulation as the magnitude of the amblyopic effects on the fMRI responses to faces increased as one moves to more downstream visual cortical areas, such as FFA [102]. These results are at odds with ours showing reduced, but still clearly identifiable amblyopic responses in the N170 component. The most parsimonious
Discussion 25
explanation for this discrepancy might lie in the difference in stimulus presentation, as it is reasonable to assume that the stronger signal reduction for the stimuli presented to the amblyopic eye in the Lerner et al [102] compared with the current study might be due to the fact that interocular suppression of the amblyopic eye might be stronger when the fellow eye is open and fixating as compared to when it is closed as was the case in our study. FMRI studies also revealed the dominant eye response differs less from the binocular response than does the amblyopic eye response both in cortical area and mean level of activation [145]. Moreover, both a delay and an amplitude reduction was found in the early visual cortical hemodynamic response function (HRF) of amblyopic eye stimulation under the suppressed binocular condition [146]. However the BOLD signal is only an indirect measure of the underlying neural response integrated in time, having a much worse temporal resolution compared with the ERP response. Therefore, our findings of suppression early in time strengthen the above results obtained with fMRI.
In conclusion, our findings are in agreement with these previous results, by showing that input from the amblyopic eye is completely suppressed already at the earliest stages of visual cortical processing during binocular viewing.
DOI:10.15774/PPKE.ITK.2015.009
C h a p t e r T h r e e
AMBLYOPIC DEFICITS IN HIGH-LEVEL OBJECT PROCESSING
1. Motivations
The extensive behavioral research in the past decades revealed that amblyopia involves both low level (e.g. reduced visual acuity and contrast sensitivity) [98, 99] and higher-order (e.g.
global form and motion processing) visual deficits [102–106]. In agreement with this, human functional magnetic resonance imaging (fMRI) studies showed reduced fMRI responses throughout the visual processing hierarchy – including the lateral geniculate nucleus, the striate and extra-striate cortex [57, 102, 114, 119, 121–123]. In spite of this, neurophysiologic research in human amblyopes has focused on the early, low-level visual cortical processing deficits, which are reflected on the P1 component of the visual-evoked responses (VEPs) [41, 96, 100, 101] with an exception of a recent study showing that global motion signal evokes reduced VEP in amblyopia [107]. As a result, it is not known how the temporal structure and strength of neural responses at the higher, object-specific stages of visual information processing are altered in human amblyopia.
To address this question we measured event-related potential (ERP) responses to foveal face stimuli in amblyopic patients. More specifically, our goal was to characterize the amblyopic deficits in the face-selective N170 ERP component, reflecting higher level structural processing of facial information (for a review see [147]) and originating from a network of occipito-temporal cortical areas [148–150] and compare it to the amblyopic effects present already at the P1 ERP component, which marks primarily the low-level cortical processing of visual features. Importantly, we used single trial analysis, which enabled us to investigate the amblyopia-related deficits selectively in the amplitude and latency of the ERP components. This was critical because neurophysiological research on strabismic cats suggests [151–153] that neuronal response latencies could be more variable in visual cortical neurons driven by the amblyopic eye, which would manifest itself in reduced amplitudes of the averaged ERP responses [154] and thus might account at least partly for the strong reduction of the averaged P1 amplitudes in previous studies [41, 96, 100, 101]. Furthermore, the current study was designed to be able to test whether ongoing oscillations at the time of stimulus onset differ between the stimulation of the amblyopic eye and fellow eye, since ongoing oscillations are known to affect evoked neural responses [155–157] and thus, could contribute to the amblyopic deficits measured in the ERPs. We recorded eye movements during the ERP
Materials and methods 27
experiment to investigate the relationship between the stability of fixation and the ERP component amplitudes and latencies. This was important, because previous research suggested that decreased fixation stability exhibited by the amblyopic eye [158, 159] might modulate multi-focal VEP responses [116].
2. Materials and methods
2.1. Subjects
Nineteen amblyopic patients (five anisometropic, six had their right eye as the amblyopic eye, four left-handed, ten females, mean±sd age: 30±8 years) gave their informed and written consent to participate in the study, which was approved by the ethics committee of Semmelweis University. However, one of them had to be excluded due to his poor performance on the task with both eyes. All subjects were examined by an ophthalmologist and fitted with optimal correction Table 3.1 details their medical parameters.
2.2. Visual stimuli and procedures
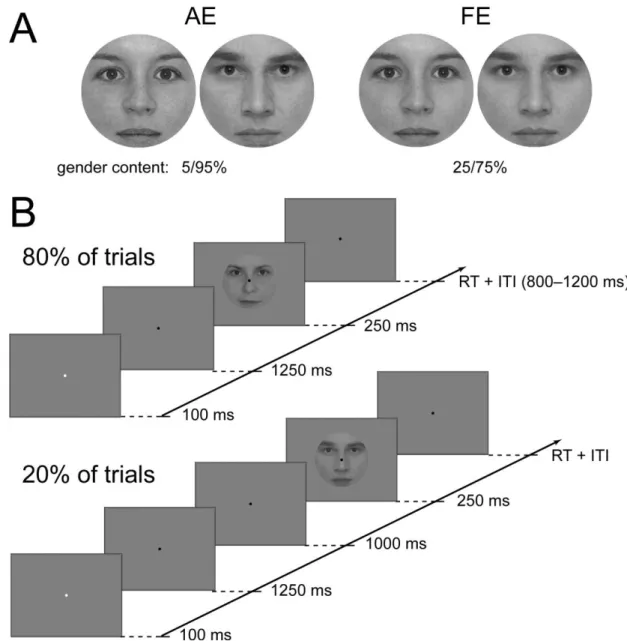
Participants performed a two-alternative forced choice gender categorization task with morphed female/male face images. Detailed description of image processing can be found in [14]. The level of task difficulty was adjusted individually to achieve 80-90% accuracy in both eyes by choosing face pairs with different female/male content for the eyes (typically 25/75%
and 5/95% gender content for the fellow and amblyopic eye, respectively; Figure 3.1A). On half of the trials, subjects were presented with noisy, decreased phase coherence face images [14], while on the other half of the trials subjects viewed 100% phase coherence images. In the current study, however, we will present and discuss only the results obtained with the 100%
phase coherence face stimuli, while results obtained with the noisy faces will be presented elsewhere. Stimuli subtended 2 visual degrees, matching approximately the size of the fovea and were presented centrally on a uniform gray background.
Each trial started with a cue, a brief change (100 msec) in color of the fixation dot followed by the face stimulus for 250 msec with a fixed SOA of 1350 msec on 80% of the total trials and 2350 msec on 20% of the trials. Subjects were instructed to pay attention following the cue and were explicitly told about the 1350 msec SOA. However, they were not informed about the extra 1 sec delay in 20% of the trials, which meant they always expected the faces 1250 msec following the cue. A response window of 2 sec was given, which terminated when the subjects responded. Trials were separated by a random ITI of 800–1200 msec (Figure 3.1B) and a fixation point was present throughout the entire block. Viewing was monocular, alternated between blocks, while the other eye was patched.
DOI:10.15774/PPKE.ITK.2015.009
Table 3.1. Clinical details of amblyopic subjects (RE: right eye, LE: left eye, D: distant, N: near, ET: esotropia, XT: exotropia)
Materials and methods 29
Each participant completed four runs for each eye yielding 192 trials altogether for each stimulus type per eye and altogether 80 trials per eye where the face images where delayed.
Stimulus presentation was controlled by MATLAB 7.1. (The MathWorks Inc., Natick, MA) using the Cogent 2000 toolbox (www.vislab.ucl.ac.uk/Cogent/) and were presented on a 26” LG LCD monitor at a refresh rate of 60 Hz and were viewed from 56 cm.
Figure 3.1. Stimuli and experimental protocol. (A) Typical gender composition of stimuli presented into the amblyopic (left panel) and fellow eye (right panel). (B) Experimental protocol, which shows the general stimulus sequence (upper panel) and those 20% of all trials where the face was presented later than expected (bottom panel).
2.3. Electrophysiological acquisition and processing
EEG data was acquired using a BrainAmp MR (Brainproducts GmbH., Munich, Germany) amplifier from 60 Ag/AgCl scalp electrodes placed according to the extended 10-20
DOI:10.15774/PPKE.ITK.2015.009
international electrode system, mounted on an EasyCap (Easycap GmbH, Herrsching- Breitbrunn, Germany) with four additional periocular electrodes placed at the outer canthi of the eyes and above and below the right eye for the purpose of recording the electrooculogram.
All channels were referenced to joint earlobes online; the ground was placed on the nasion. All input impedance was kept below 5 kΩ. Data were sampled at 1000 Hz with an analog bandpass of .016–250 Hz and was re-referenced offline using a Laplacian transform on spherical spline interpolated data to generate scalp current density (SCD) waveforms. The SCD data is reference independent and displays reduced volume conduction eliminating raw EEG contamination from saccadic potentials [160], [138]. Moreover its peaks and troughs are sharper and larger than those of the original scalp potential [161], which makes it better suited for single-trial peak detection compared to raw surface potentials. Data was band-pass filtered from .1-30 Hz (using digital .1 Hz 12 dB/octave Butterworth Zero Phase high-pass filter, 30 Hz 24 dB/octave low-pass filter, and 50 Hz notch filter), segmented, artifact rejected and baseline corrected in a 200 msec pre-stimulus window directly preceding the presentation of the stimulus in the case of ERP analysis and preceding the expected presentation of the face in the case of the wavelet analysis. 1000 msec long epochs (-200 – 800 msec relative to stimulus) were used for creating the trial-averaged event-related potentials and for single trial peak analysis. On the other hand, to detect a possible baseline oscillation difference between amblyopic and fellow eyes a single-trial wavelet analysis was performed on 3000 msec long data segments starting from the presentation of the cue (i.e. -1350 to 1650 msec relative to the expected stimulus onset) on the 2350 msec cue-face SOA trials. Thus, no evoked potentials were present that could affect the wavelet transform of the baseline period due to the large window length of lower frequencies. Data processing was done using BrainVision Analyzer (Brainproducts GmbH., Munich, Germany), while time-frequency spectrum was calculated using Matlab’s cmor function over the frequency range of 1-30 Hz with a bandwidth of 1 Hz, and central frequency of also 1 Hz.
2.4. Statistical analysis
Accuracy, RTs for correct trials, and visual acuity (VA) as expressed in logMAR values obtained at a distance of 6 m with the best refractive correction were analyzed as behavioral measures. On both the averaged and single-trial ERPs, P1 and N170 component peaks were detected and analyzed on electrode-clusters (PO7, PO9, P7, and P9, and PO8, PO10, P8, and P10 for left and right clusters, respectively). In the case of average ERPs peak latency was determined individually on pooled electrodes from left and right clusters separately, while mean peak amplitudes were measured over the individual electrodes of the clusters in a 10 msec window centered on the peak latencies. In the case of the single-trial peak detection, minima and maxima for P1 and N170, respectively, were detected on each trial for each
Materials and methods 31
electrode in a 100 msec time window centered on the individual peak latency of the respective component measured on the averaged ERPs. The amplitude and corresponding time of the extrema were taken as the amplitude and latency of the component on the given trial. The trial was rejected if the detected extrema was located at the beginning or end of the time window.
The single trial amplitude and latency values were pooled from the four electrodes on each side and the distribution of the values was characterized by calculating the median and the interquartile range (IQR), which is a measure of spread and is computed as the difference of the upper and lower quartile of the data, and thus describes the middle 50% of the data values.
For the P1-N170 peak-to-peak analysis N170 – P1 latency difference was calculated on a trial- by-trial basis and the distributions were characterized as above. To characterize ongoing oscillations log power and phase concentration (kappa) was computed – the latter using the circStat Matlab toolbox [162] – in the delta, theta and alpha frequency bins by pooling data from 2-3, 4-7 and 8-12 Hz, respectively.
The above measures were compared using mixed-effects ANOVAs with eye (fellow:
FE vs. amblyopic: AE), side (L vs. R), electrode – only in the case of averaged ERP amplitudes –, and frequency (delta vs. theta vs. alpha) – only in the case of wavelet results – as within-subject factors and etiology (anisometropia vs. strabismus) as a between-subject factor using Tukey HSD tests for post-hoc comparison. Greenhouse-Geisser correction was applied to correct for possible violations of sphericity where the levels of a within-subject factor exceeded two. In the case where the assumption for homogeneity of variances was not met due to the higher variance of measurements from the AE, values were first rank transformed before being entered into the statistical test, which is noted by rANOVA (rank ANOVA) when detailing statistical results.
We also assessed the relationship between the interocular changes in median/IQR of the distributions, ERP peak amplitudes/latencies and the interocular visual acuity using Pearson correlation. For use in the correlation analysis we calculated the difference of the measures derived from the amblyopic and the fellow eye in a way that positive values meant amblyopic deficit, the larger the difference, the bigger the deficit. Latency and amplitude measures can be treated as independent, while measured values over the different hemispheres and different measurements derived from latency/amplitude are strongly dependent on each other. Therefore, the significance threshold was set to p=.025 (pBonf =.05) to correct for the multiple comparisons problem.
2.5. Analysis of eye tracking data
We tracked the gaze direction of all subjects while they performed the EEG experiment.
However, we were able to record useable eye movement data only for ten patients due to the strong reflection of glasses that many were wearing. Eye-gaze direction was assessed using a
DOI:10.15774/PPKE.ITK.2015.009
![Table 1.1. Causes of amblyopia [27]. *Amblyopia is the residual visual deficit after the physical obstruction is removed and appropriate optical correction is provided](https://thumb-eu.123doks.com/thumbv2/9dokorg/1306335.105088/9.892.148.792.285.585/amblyopia-amblyopia-residual-physical-obstruction-appropriate-correction-provided.webp)
![Table 1.2. Degrees of refractive error thought to induce amblyopia [27]. ** asymmetric refractive error,](https://thumb-eu.123doks.com/thumbv2/9dokorg/1306335.105088/12.892.99.744.390.665/table-degrees-refractive-thought-induce-amblyopia-asymmetric-refractive.webp)