Contents lists available atScienceDirect
DNA Repair
journal homepage:www.elsevier.com/locate/dnarepair
Two main mutational processes operate in the absence of DNA mismatch repair
Eszter Németh
a, Anna Lovrics
a, Judit Z. Gervai
a, Masayuki Seki
b, Giuseppe Rospo
c,d, Alberto Bardelli
c,d, Dávid Szüts
a,*
aInstitute of Enzymology, Research Centre for Natural Sciences, 1117 Budapest, Hungary
bDepartment of Biochemistry, Tohoku Medical & Pharmaceutical University, Miyagi 981-8558, Japan
cCandiolo Cancer Institute, FPO-IRCCS, 10060, Candiolo TO, Italy
dDepartment of Oncology, University of Turin, 10060, Candiolo TO, Italy
A R T I C L E I N F O Keywords:
DNA mismatch repair Mutagenesis Mutational signatures MSH2Whole genome sequencing
A B S T R A C T
The analysis of tumour genome sequences has demonstrated high rates of base substitution mutagenesis upon the inactivation of DNA mismatch repair (MMR), and the resulting somatic mutations in MMR deficient tumours appear to significantly enhance the response to immune therapy. A handful of different algorithmically derived base substitution mutation signatures have been attributed to MMR deficiency in tumour somatic mutation datasets. In contrast, mutation data obtained from whole genome sequences of isogenic wild type and MMR deficient cell lines in this study, as well as from published sources, show a more uniform experimental mutation spectrum of MMR deficiency. In order to resolve this discrepancy, we reanalysed mutation data from MMR deficient tumour whole exome and whole genome sequences. We derived two base substitution signatures using non-negative matrix factorisation, which together adequately describe mutagenesis in all tumour and cell line samples. The two new signatures broadly resemble COSMIC signatures 6 and 20, but perform better than existing COSMIC signatures at identifying MMR deficient tumours in mutation signature deconstruction. We show that the contribution of the two identified signatures, one of which is dominated by C to T mutations at CpG sites, is biased by the different sequence composition of the exome and the whole genome. We further show that the identity of the inactivated MMR gene, the tissue type, the mutational burden or the patient’s age does not influence the mutation spectrum, but that a tendency for a greater contribution by the CpG mutational process is observed in tumours as compared to cultured cells. Our analysis suggest that two separable mutational processes operate in the genomes of MMR deficient cells.
1. Introduction
Failure of DNA mismatch repair (MMR) is associated with a strik- ingly elevated rate of base substitution mutagenesis, accompanied by an increase of short insertion or deletion mutations (indels) mostly at repeat sequences, termed microsatellite instability (MSI) [1,2]. As a consequence, tumours with MMR deficiency are amongst those that contain the highest number of somatic mutations [3]. MMR deficiency (MMRd), when assessed by MSI, is found to be common in colon (15
%), stomach (20 %) and uterine corpus endometrial (30 %) cancers, and also found less frequently in other cancer types [4,5]. MMRd tu- mours generally have better prognosis than MMR proficient tumours of the same tissue type [6,7], and respond better to immune checkpoint blockade [8]. The mutational burden of MMRd tumours correlates with
immunotherapy response [9], thus understanding the mutational pro- cesses operating in MMRd cancers could have a direct impact on de- veloping treatment strategies [10,11].
The classification of cancer somatic mutations into mutation sig- natures has played a key role in understanding the underlying muta- tional processes. Base substitution mutations (single nucleotide varia- tions, SNVs) were classified based on the sequence change and the identity of the immediately preceding and following base into triplet mutation signatures [12,13]. The initial 21 signatures were expanded to 30 in COSMIC version 2 (v2) [14], and a larger set of signatures en- compassing a range of mutation types was released recently as COSMIC mutation signatures version 3 (v3) [15]. Despite the fact that muta- tional signatures were derived using non-negative matrix factorisation in an unsupervised process [16], subsequent experimental work
https://doi.org/10.1016/j.dnarep.2020.102827
⁎Corresponding author at: Research Centre for Natural Sciences, Magyar tudosok krt 2, Budapest, H-1117, Hungary.
E-mail address:szuts.david@ttk.hu(D. Szüts).
Available online 25 February 2020
1568-7864/ © 2020 The Author(s). Published by Elsevier B.V. This is an open access article under the CC BY-NC-ND license
T
demonstrated that they successfully captured the outcome of several distinct, identifiable mutagenic processes such as UV-induced DNA damage [17] or deficiency of homologous recombination repair [18,19].
The case of MMRd-dependent mutagenesis, however, remains somewhat of a mystery. As opposed to deficient homologous re- combination, which is primarily associated with a single base sub- stitution signature (signature 3), the association of MMRd with six or seven different COSMIC SNV signatures has been described [12,20].
This is surprising, given that MMR is a relatively simple process with a well conserved mechanism that relies on the same small set of MMR- specific proteins in all cells [21,22]. Mismatches are recognised by the MutSα complex (a heterodimer of MSH2 and MSH6) or MutSβ (a het- erodimer of MSH2 and MSH3). Excision of the mismatch is dependent on the recruitment of MutL (a heterodimer of MLH1 and PMS2). The removal of the mismatched section of the daughter strand and its re- synthesis is completed by the EXO1 exonuclease and general DNA re- plication proteins, although MMR also has an EXO1-independent branch [23]. Biallelic inactivating mutations of MSH2, MSH6 and MLH1 are frequently found in MMRd cancers, and inherited defects in these genes predispose to cancer in Lynch syndrome [24]. Mutagenesis in the absence of one of the core MMR factors is shaped by the sequence spectrum of the unrepaired mismatches, which themselves are the product of the insertional specificity and proofreading activity of DNA polymerases. A recent study suggested that mis-insertion at methylated cytosines is responsible for some of the mutagenesis in MMRd cells [25], but there is currently no biological explanation for the consider- able number of MMRd-associated signatures.
In cancer sequencing, the mutagenic effect of MMRd is observed in tumours of different genetic backgrounds, which may contribute to or influence the mutagenic processes. A clear approach for validating the causative relationship between DNA repair processes and mutational signatures is the use of isogenic cell line pairs. Indeed, a study on
human HAP1 cell lines detected a mutagenic spectrum caused byMSH6 inactivation, which bore similarity to most of the MMRd-associated COSMIC signatures [26], and similar spectra were found inmlh-1and pms-2mutant C. elegans strains [27].
Here, we determined the MSH2 deficiency specific mutational spectrum from isogenic cell lines and observed that it is nearly identical to theMSH6specific spectrum, while none of these fully describe mu- tations in MMRd tumours. Notwithstanding the differences between tumour and cell line mutational spectra, and the differences between separate tumour mutational spectra, the same underlying biological causes are expected to detectably result in the same mutational sig- natures in all samples. With this reasoning, we conducted an MMRd- specific investigation of SNV signatures that synthesises mutational information from available tumour and cell line sequencing. We de- rived two SNV signatures from an assembled mutation dataset from whole exome and whole genome sequences of MMRd tumours. We show that these MMRd-specific mutational signatures can adequeately explain mutagenesis in all relevant tumour and cell line samples, and perform better than the MMRd-associated COSMIC SNV signatures at identifying MMR deficient tumours.
2. Results
2.1. Base substitution spectra in mismatch repair deficient cell lines and tumours
Taking advantage of the very low background mutagenic rate of the chicken DT40 cell line [28], we measured the effect ofMSH2disruption on spontaneous genomic mutagenesis by comparing the whole genome sequences of an ancestral cell clone and two descendant clones obtained after 50 days of culturing. As opposed to a mean of 48 SNVs in the wild type cell line, we found a mean of 1167 SNVs in anMSH2knockout cell line after this period (sequencing statistics and results are summarised
Fig. 1.SNV mutational spectra in MMRd cell lines.
(A) Triplet mutational spectra of ongoing spontaneous mutagenesis in the indicated cell lines. Each mutation class, as indicated at the top of the panel, is separated into 16 categories based on the identity of the preceding and following nucleotide as shown below. The order of the following nucleotides, not shown due to lack of space, is alphabetical. The spectra are derived from the mean mutation numbers of several independent sequenced clones. In case of the DT40 and HAP1 cell lines, the mean mutation numbers of the isogenic wild type control cell line were subtracted before normalisation. HAP1 data are derived from [26]. The SNV spectrum of a typical TCGA uterine carcinoma sample is shown for comparison. (B) Cosine similarities of the cell line specific mutational spectra to MMRd-associated signatures in COSMIC v2 and v3. (C) Deconstruction of the MMRd cell line SNV spectra into COSMIC v2 mutational signatures. Individual signatures with a contribution above 6%
are shown with the signature number indicated on the columns.
in Tables S1-4). The difference in the number of indels between the wild type and theMSH2−/−cell line was even more striking, and almost all short deletions inMSH2−/−occurred at repeat sequences (Table S4).
The difference between the SNV spectra of the mutant and the wild type cell line, signifying mutations arising due to the inactivation ofMSH2, was remarkably similar to theMSH6defect specific triplet SNV spec- trum measured in human HAP1 cells [26](Fig. 1A). The spectrum is dominated by C > T and T > C mutations in a range of contexts, plus certain specific C > A peaks. We measured earlier the spontaneous mutation spectrum of the MSH6 deficient DLD-1 human colorectal cancer cell line [29], which was also very similar (Fig. 1A). In contrast, the triplet spectrum of somatic mutations in a typical MMRd cancer exome is somewhat different (Fig. 1A, showing an example ofMSH2 mutated uterine cancer).
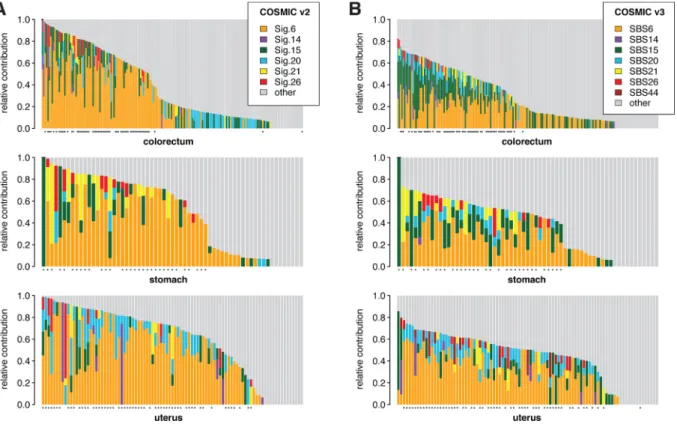
We compared the three obtained MMRd-specific cell line SNV spectra to the MMRd-associated COSMIC signatures, and found that they were most similar to signature 20 (Sig.20) in COSMIC v2, or SBS44 in COSMIC v3 (Fig. 1B). We also attempted to deconstruct the experi- mental SNV spectra using all 30 COSMIC v2 signatures. Although Sig.20 dominated the deconstructions, contributions from most MMRd-asso- ciated signatures appeared, suggesting that they indeed represent MMRd-specific mutagenesis (Fig. 1C). For comparison, we also decon- structed the mutation catalogs of colorectal, stomach and uterus whole exome tumour sequences obtained from The Cancer Genome Atlas (TCGA). Here, the largest MMRd contribution was by Sig.6 or SBS6 (Fig. 2, Table S5.). It is worth noting that the COSMIC v3 signatures generally showed a lower total MMRd contribution than COSMIC v2 signatures. The contribution of MMRd specific signatures correlated well with MSI status in the case of both v2 and v3 COSMIC signatures (Fig. 2), but the difference from the cell line genome mutation data warranted further investigation.
2.2. MMRd-associated COSMIC mutational signatures are interdependent SNV signatures 6, 14, 15, 20, 21 and 26 in COSMIC v2 have been associated with MMRd, and this set has been expanded by the new signature SBS44 in COSMIC v3. Upon close inspection, a number of similarities are apparent between these signatures. For example, C > A peaks are rather similar between Sig.6 and Sig.20, and C > T peaks are similar between Sig.14 and Sig.15 (Fig. 3A, B). A comparison of all MMRd signatures to each other also shows relatively high overall si- milarity between certain pairs, e.g. a cosine similarity of 0.89 between Sig.21 and Sig.26 (Fig. 3C), raising the question of potential re- dundancy in the MMRd signature set. COSMIC v3 signatures are better separated, with SBS21 and SBS26 showing no similarity to any of the others apart from each other, but SBS6 and SBS15 still have a cosine similarity of 0.86 (Fig. 3C). A comparison between the COSMIC v2 and v3 signatures shows many changes, most notably that Sig.20 is more similar to SBS44 than to SBS20 (Fig. 3C).
To test the interdependence of COSMIC signatures, we attempted to deconstruct each signature using the rest of the MMRd signature set. We included the ageing-associated Sig.1 in the process due to the presence of CG > TG mutations in Sig.6. Indeed, we found that Sig.6 could be deconstructed into three components of Sig.1, Sig.15 and Sig.20 with a low deconstruction error (root-mean-squared deviation) of 0.07, Sig.26 could be deconstructed into components of Sig.20 and Sig.21, and re- latively good deconstructions were also seen in case of the other sig- natures (Fig. 3D). The same deconstruction process was less successful on the better separated v3 signatures, but the overall results were si- milar (Fig. 3E). Encouraged by these results, we wondered whether a smaller number of signatures could adequately describe mutagenesis in MMRd cells.
Fig. 2.SNV mutational spectra in TCGA cancer exomes.
(A, B) Deconstruction of the SNV spectrum of tumour samples derived from the indicated tissues into all mutational signatures in COSMIC v2 (A) or v3 (B). Only those samples with at least 200 SNVs were included. Each column represents a TCGA entry, samples are ordered based on the total relative contribution MMRd-associated signatures as shown on the legends. ‘Other’ represents the sum of all signature contributions other than those shown separately. Samples with MSI-H status are indicated with an asterisk below each panel.
2.3. Two mutational signatures derived from classified MMRd tumours We sought to redefine MMRd-associated SNV signatures using a pooled TCGA mutation dataset from whole exome sequencing of 146 samples of colorectal, stomach or endometrial origin that were in- dependently classified as MMR defective based on their MSI status. Of course, this excluded those rare samples which have a very high mu- tation load with bothPOLE/POLD1and MMR gene defects but retain microsatellite stability, presumably due to a late loss of MMR profi- ciency [3]. We supplemented the dataset with 23 MMRd samples from the same tissues that were sequenced as part of the Pancancer Analysis of Whole Genomes (PCAWG) study [20]. MSI status was not available for PCAWG samples, therefore we classified and selected MMRd sam- ples based on the number of T deletions from T repeats (Fig. S1). Non- negative matrix factorisation (NMF) of the assembled SNV dataset re- sulted in only two triplet signatures (Fig. S2). Signature MMRd-A contained prominent peaks of NCG > NTG mutations, whereas sig- nature MMRd-B had a broader spectrum dominated by T > C, C > T and C > A substitutions (Fig. 4A, Table S6). MMRd-A is very similar to COSMIC signatures Sig.6 and SBS6 (cosine similarity 0.98 and 0.96, respectively,Fig. 4B). MMRd-B is most similar to COSMIC signatures Sig.26 and SBS26 (cosine similarity 0.88 and 0.82, respectively), and shows comparable similarity to the experimental MMRd spectra mea- sured inMSH6mutant DT40 cells andMSH2mutant HAP1 cells (cosine similarity 0.83 and 0.87, respectively, Fig. 4B). We also compared MMRd-A and MMRd-B signatures to the COSMIC set by decomposing them to this reference. As expected, MMRd-A can be described as the linear combination of Sig.6 and Sig.1 (Fig. 4C). However, MMRd-B is a fundamentally new signature with only smaller contributions from three MMRd related signatures (Sig.15, 20, 26) and also Sig.12, but even so the deconstruction is not complete.
2.4. Using the two new mutational signatures for the identification of MMRd tumours
In the previous analysis shown inFig. 2we performed deconstruc- tion with all COSMIC signatures to determine the contribution of MMRd signatures to the overall SNV load. For comparison, we next replaced
the MMRd-associated COSMIC v2 signatures (Signatures 6, 14, 15, 20, 21 and 26) with the new MMRd-A and MMRd-B signatures, and re- peated the deconstruction process (Fig. S3, Table S7). It is informative to look at the deconstruction errors, which were typically lower for whole genome data than whole exome data and lower for MSI samples than microsatellite stable (MSS) samples in all datasets, showing the inverse correlation of deconstruction error with the number of muta- tions in each sample (Fig. 4D). The errors of the approaches using the full COSMIC signature sets or those with the replaced MMRd signatures were very similar, showing that the two new signatures can adequately replace the six MMRd-associated COSMIC signatures for almost all cases (Fig. 4D).
We next asked how well the new signatures can identify MMRd samples. Using the signature deconstructions described above, we performed ROC analysis to separately compare the contribution of each signature to the overall SNV load against the independently measured MSI status of each TCGA and PCAWG sample. Both MMRd-A and the very similar Sig.6 performed very well at identifying MSI samples, with a slightly better performance seen with MMRd-A, as judged by the AUC (area under curve) values, which ranged from 0.966-0.993 in the in- vestigated cancer types (Fig. 4E). MMRd-B performed well in the en- dometrial samples (AUC = 0.939) and moderately well in colorectal and stomach cancer samples (AUC = 0.846 and 0.879, respectively).
MMRd-B far outperformed the COSMIC signatures other than Sig.6, of which Sig.15 in colorectal and Sig.20 in uterus samples showed the best sensitivity.
2.5. No correlation between MMRd signature contribution and genetic or clinical features
The very different MMRd-A and MMRd-B signatures are likely to have different biological causes. To explore these, we next investigated whether their separate or joint contributions correlates with genetic or clinical features (Table S8, S9) of the analysed TCGA samples. The distribution of the overall contribution of MMRd-A has a peak around 60–70 % in all three investigated tissues, whereas MMRd-B typically contributes 20–50 %, with colorectal samples near the higher end of this range (Fig. 5A). The ratio of A/B signature contribution had a Fig. 3.Interdependence of MMRd-associated COSMIC signatures.
(A) MMRd-associated signatures in COSMIC v2. (B) MMRd-associated signatures in COSMIC v3. (C) Pairwise comparison of all MMRd-associated COSMIC signatures.
The ageing-associated Sig.1 (COSMIC v2) and SBS1 (COSMIC v3) is included in the comparison. Cosine similarity values are shown. (D, E) Deconstruction of each MMRd-associated COSMIC v2 signature plus Sig.1 (D) or each MMRd-associated COSMIC v3 signature plus SBS1 (E) into all other signatures from the same set. Minor contributions are shown in grey. The decontruction errors (root-mean-squared deviation, RMSD) are shown above each stacked bar.
(caption on next page)
median of 1.5 in colorectum, 1.8 in stomach and 2.0 in uterus samples, but the differences were not significant (Fig. 5B). The total contribution of MMRd-A plus MMRd-B appeared independent of the total number of SNVs in MSI samples (Fig. 5C). We observed a 20–35 % contribution of MMRd-A + B also in MSS colorectal samples (Fig. 5A, C). The corre- lation between the number of MMRd-A and MMRd-B mutations was low, with R2values between 0.155 and 0.256 for the three investigated tissues, suggesting independent variability in the two components (Fig. 5D). We observed no correlation between the contribution of ei- ther signatures to the total mutation load and the age of the patient at diagnosis (Fig. 5E), suggesting that most somatic mutations in these tumour samples arose as a result of MMR deficiency, with an insignif- icant contribution from age-associated clock-like somatic mutations [14]. Furthermore, the contribution of MMRd-A or MMRd-B was also independent of the clinical stage of the tumour (Fig. 5F). Finally, we looked at the contribution of the two signatures in samples with de- tected somatic pathogenic mutations of MSH2, MSH6or MLH1, and found no correlation of the mutation spectrum with the identity of the defective MMR gene (Fig. 5G). Taken together, these results suggest that the detected mutations arose from a similar mutagenic process in each sample that took place early in the development of the tumours, and the mutational process has two variable components that are both the consequence of the inactivation of the MutSα branch of the MMR pathway.
2.6. Different triplet frequencies bias the contribution of SNV signatures in exome versus whole genome sequencing
Cancer mutation datasets are obtained both from whole exome and whole genome sequencing. We deliberately used a mixture of the two types of data to derive the MMRd signatures. However, the frequency of occurrence of each triplet is different in the exome and the genome, with a higher GC content and a greater density of CpG sequences in the exome represented in triplet frequencies that can show as much as 3- fold differences (Fig. 6A, Table S10). Indeed, the mean contribution of MMRd-A is much higher in MMRd whole exome mutation datasets from TCGA than in MMRd whole genome PCAWG mutation datasets (Fig. 6B). To test whether this is due to a sequence composition bias, we separately analysed signature contributions to mutations found in the exons, introns and intergenic regions of the PCAWG samples (Table S11). In all eight samples, the exonic mutations had a much higher contribution of MMRd-A than the intronic and intergenic mutations (Fig. 6D). The mean exonic MMRd-A contribution of the PCAWG col- orectal samples was similar to the MMRd-A contribution of the TCGA whole exome colorectal samples (67 % vs 70 %, compareFig. 6B and 6D), suggesting that the difference between the whole exome TCGA and whole genome PCAWG datasets is entirely due to the sequence com- position of the analysed genomic regions. Importantly, the derivation of the MMRd signatures was not significantly influenced by this exome/
genome bias, as an SNV signature pair very similar to MMRd-A and MMRd-B could be derived by NMF on either the WES or WGS samples separately (Fig. S4).
2.7. Comparison of mutagenesis in MMRd cell lines and tumours The MMRd signatures derived from tumour genomes could ade- quately reconstitute theMSH2andMSH6deficiency specific mutation spectra measured in the whole genome of isogenic DT40 and HAP1 cell lines, respectively, and also the mutation spectrum of theMSH6defi- cient DLD-1 cell line, but the contribution of the MMRd-A signature was very low (Fig. 6B). The reconstitution of the cell line or tumour derived mutation datasets only changed slightly and the errors did not decrease when the non-MMRd COSMIC v2 signatures were included, but the MMRd-A contribution was lower in WGS cell line data than WGS tu- mour data in both types of deconstruction (Fig. 6B, C).
To understand whether there is a general trend for different MMRd- A/B contribution between cell lines and tumours, we obtained two more sets of cell line derived data. First, we investigated WES data of 11 colorectal cancer derived cell lines with confirmed MMR deficiency [30]. After alignment to the human reference genome, we filtered out potential germline SNPs using a human SNP database. The remaining mutations are expected to be a mixture of the somatic mutations which arose in the tumour tissue, and the mutations which arose since the establishment of the cell line. As a second source, we used the published WES-derived datasets of mutations that arose during the culturing of eight MMRd cell lines [31]. We performed principal component ana- lysis (PCA) on all the cell line datasets and the colorectal tumour mu- tation sets, and included the pure MMRd signatures as well. The col- orectal cell line WES-derived mutations clustered together with the TCGA WES-derived mutations, closer to MMRd-A than MMRd-B (light and dark pink filled circles, Fig. 6E), suggesting that any mutations which arose in the cell lines were of a similar spectrum as those arising in the tumours. As expected, the WGS-derived PCAWG and cell line samples were closer to MMRd-B (Fig. 6E). However, when only the exonic mutations of these samples were included, the PCAWG tumours clustered together with the TCGA samples. The exonic mutations of DLD-1 from our WGS sequencing and the WES-derived mutations of the eight published cell lines, which all represent mutations that arose in culture exclusively, were still closer to MMRd-B, and some also differed in the second PCA component (Fig. 6E, Table S12). This suggests some difference in ongoing mutagenesis between MMRd tumours and cell lines, with a greater contribution of the CG > TG dominated MMRd-A signature in tumours.
3. Discussion
In this work we present a new set of two MMRd-associated SNV triplet mutation signatures, which were defined based on the analysis of whole exome and whole genome derived cancer mutation datasets. The validity of the new signatures for describing mutational processes re- sulting from MMRd was demonstrated using new and existing experi- mental mutation datasets from cell lines with MMR gene defects. The two new, robust MMRd signatures are suitable for cancer mutation signature deconstruction in place of the existing larger number of MMRd-associated COSMIC signatures, for the identification of MMRd tumours, and for understanding the causes of MMRd associated base substitution mutagenesis.
Fig. 4.Two SNV signatures adequately describe MMRd-associated mutagenesis.
(A) Two new triplet SNV signatures derived from MMRd cancer mutation data. The sequence of each triplet is shown below. NCG > NTG triplets are highlighted with arrowheads. (B) Comparison of the MMRd-A and MMRd-B signatures to MMRd-associated COSMIC signatures and to the MMR gene knockout associated mutational spectra of DT40 and HAP1 cells. Cosine similarity values are shown. (C) Deconstruction of MMRd-A and MMRd-B into all 30 COSMIC v2 signatures. Minor contributions (X) are shown in grey, decontruction errors (RMSD) are shown above. (D) A comparison of the error of signature deconstruction (RMSD) using the full 30-signature COSMIC v2 set (yaxis) or MMRd-A and MMRd-B replacing signatures 6, 14, 15, 20, 21, 26 (xaxis). Each symbol represents the mutation set of a tumour sample in TCGA (top row) or PCAWG (bottom row), from the indicated tissues. Samples are colour coded according to their independently determined MSI status (TCGA) or their MSI status estimated in this work (PCAWG, see Materials and methods). (E) Receiver operating characteristic (ROC) curves illustrating the power of each MMRd associated SNV signature to distinguish MSI and MSS tumour samples. The performance of each signature on the combined TCGA + PCAWG tissue- specific dataset was evaluated using equivalent deconstructions as presented in (D). MSI-L TCGA samples were treated as MSS; area under the curve (AUC) values are shown.
Mutational signatures provide a useful framework for the analysis of somatic mutagenesis in cancer. The genome of tumour cells bears evi- dence of multiple mutagenic processes. These can be broadly classified according to their mechanism as arising due to the action of environ- mental agents, the action of cellular metabolism, or the failure of par- ticular DNA repair processes. As cancer genomes are primarily com- pared to the germline genome, a further distinction can be made between mutations arising in the pre-cancerous somatic cell lineage or
in the subsequent tumour lineage, by attempting to correlate mutation numbers with the patient’s age [14] or determining somatic mutations in matched normal tissues [32–35]. The exact classification of muta- tions (such as the use of base triplets) and the mathematical extraction of dominant vector components from the assembled multidimensional mutational dataset matrices provides the mutational signatures. Whe- ther the derived signatures truly represent separable biological pro- cesses can be investigated by seeking their association with genomic or Fig. 5.Correlation of MMRd signature contribution with genetic or clinical features.
The SNV spectra of TCGA whole exome mutation datasets with at least 200 SNVs were reconstructed using MMRd-A, MMRd-B, and the 24 COSMIC SNV signatures not associated with MMRd. (A) The contribution of MMRd-A and MMRd-B to the SNV spectrum. The number of samples from each tissue type is shown as a transparent histogram, with an overlaid distribution curve. (B) The ratio of the relative contribution of MMRd-A over MMRd-B by tissue type. Boxes show the median and the upper and lower quartile. (C) Correlation of the sum of MMRd-A and MMRd-B contribution with the total number of mutations. Samples are coloured by tissue type; empty circles represent MSS samples, full circles represent MSI-H samples. (D) Correlation between the number of MMRd-A mutations and the number of MMRd-B mutations. Samples are marked as in (C), R2values for linear regression within each tissue type are shown. (E) Correlation of the contribution of MMRd-A or MMRd-B with the patient’s age at diagnosis, R2values for linear regression for each signature are shown. (F) The contribution of MMRd-A (top panel) or MMRd-B (bottom panel) by cancer stage. (G) The contribution of MMRd-A (top panel) or MMRd-B (bottom panel) in samples with identified likely pathogenic mutations in the indicated MMR genes.
clinical features, or by comparing them to mutation data obtained in controlled experiments. We utilised both approaches to re-examine MMRd-associated mutagenesis.
We used an independent MMRd classifier for selecting samples for base substitution signature extraction, which was either the MSI status or the presence of short T deletions. The very high AUC values for detecting the MSI samples through the contribution of either COSMIC Sig.6 (not trained on MSI samples) or MMRd-A suggests that in tumours
MSI is a good indicator of MMRd, despite the fact that MSI has also been detected upon the overexpression of base excision repair enzymes and inflammation in the absence of MMR gene defects [36,37] As both our independent classifiers relate to indels, it was prudent to omit indels from the signature analyses. Also, although the combination of base substitution and indel processes into compound signatures might make good biological sense, an arbitrary relative weighting of the two pro- cesses in the combined analysis could skew the results towards Fig. 6.Different mutation spectra in whole exome or whole genome mutation datasets.
(A) The relative frequency of the occurrence of each triplet in the human genome (grey) and exome (black). NCG triplets are highlighted with arrowheads. (B) The relative contribution of MMRd-A (red) and MMRd-B (cyan) to the SNV spectrum of MMRd cell lines or tumours. Tumour mutation datasets were summed by tissue type within the TCGA WES samples and PCAWG WGS samples. The error (RMSD) of deconstruction with MMRd-A plus MMRd-B is shown above. (C) The result of deconstructing the same datasets as in (B) with MMRd-A, MMRd-B plus the 24 COSMIC v2 SNV signatures not associated with MMRd. Signatures with non-minor contribution are colour coded. (D) Mutations in individual PCAWG colorectal samples were classified according to their positions with respect to genes, and deconstructed into MMRd-A (red) and MMRd-B (cyan). Error is shown above; the mean of all 8 samples is shown separately on the right. (E) Principal component analysis showing the first two components for the joint analysis of two MMRd signatures, the WGS mutation datasets of the MMR mutant DT40 and HAP1 cell lines plus the DLD-1 cell line, the MMRd TCGA WES and PCAWG WGS samples, WES mutation datasets of colorectal cancer (CRC) cell lines [30] and of various MMRd cell lines from Petljak et al. [31]. Open and filled circles represent whole genome and whole exome datasets, respectively. In case of the PCAWG samples and DLD-1 the coding mutations are also included as a separate sample, shown with filled circles of the same colour.
particular mutagenic processes. Our resulting targeted NMF analysis of the MMRd tumour samples identified only two signatures necessary for covering the base substitution processes, in contrast with a recent study that finds a correlation with three MMR-specific, one clock-like and one SNP-related signature [27]. Moreover, we validated the new MMRd signatures on experimental mutation datasets obtained from isogenic MMR gene knockout and control cell line pairs, as well as MMRd cancer cell lines, indicating that together they successfully describe MMRd- associated base substitions. This work therefore provides an example for the integration of cancer sequencing-derived and experimental data to refine and simplify the cancer mutational signature sets.
The derivation of such validated mutation signatures can aid the search for the biological mechanisms of MMRd-dependent mutagenesis.
MMRd-A is dominated by CG > TG mutations. It is known that CG > TG mutations can arise from T-G mismatches produced by to the spontaneous deamination of 5-methylcytosine [38], giving rise to the age-associated COSMIC Sig.1 [14], but this process is independent of MMR that acts after strand separation, behind the replication fork. If replication-independent non-canonical MMR had significant activity on T-G mismatches, CG > TG mutagenesis would be expected to decrease upon loss of MMR. Instead, the enrichment of CG > TG mutations has also been observed in MMRd cancer and shown to correlate with sites of CpG methylation [39], and a likely explanation for the formation of these mutations is the suggested higher error rate of replicative poly- merases on 5-methylcytosine [25]. MMRd-B is dominated by transition mutations irrespective of context. The formation of these mutations is likely the consequence of the intrinsic base insertional and proofreading fidelity of the replicative polymerases [40]. The MMRd-B signature also contains specific C > A peaks, primarily at CCT > CAT and other CT > AT combinations. It is possible that these mutations result from the failure of MMR to correct oxidative base damage, as a mutation signature associated with 8-oxoguanine persistence shows somewhat similar C > A peaks [41] and MMR factors have been shown to be re- quired for oxidative damage repair [42]. Taken together, the spectrum of MMRd-associated mutagenesis reflects the activity of mismatch- forming processes. The varied contribution of MMRd-A versus MMRd-B in different tumour samples, or between tumours and cell lines, could be influenced by different DNA methylation levels and patterns af- fecting MMRd-A, or different nutrient and consequent nucleotide availability affecting mismatch formation through the ‘next nucleotide effect’ [43,44].
If two base substitution signatures can explain the observed muta- genic processes, why are there so many MMRd-associated signatures in COSMIC? Part of the explanation lies in the complexity of generating mutation signatures from very large datasets, with each cancer tissue type analysed separately as well as together, and the inherent problem that the mutation sets of individual samples may be reconstructed in multiple ways [16,20]. The demonstrated partial interdependence of the MMRd-associated signatures suggests that they may describe fewer underlying mutagenic processes. But there may also be biological me- chanisms behind some of the COSMIC signatures that were not captured by our analysis, either because they are operating in few samples, or because we excluded the relevant samples from our MMRd cancer da- taset. The presence of Sig.14 and Sig.20 has been associated with a specific mutagenic mechanism, as these signatures are frequently pre- sent in cancers with a combination of inactivating MMR gene mutations and concurrent exonuclease domain mutations in POLE or POLD1 [45].
The highly mutated POLE mutant samples were mostly excluded from our analysis based on a mutation burden cut-off. However, Sig.20 was most similar to the mutation spectra of MMRd cell lines with no poly- merase proofreading defect, therefore it is unlikely to identify a distinct mutagenic process.
In conclusion, the derivation of mutational signatures from cancer exomes and genomes, their refinement based on comparison to ex- perimentally obtained data, and the re-analysis of tumour samples with the refined and potentially reduced relevant signature sets can help us
understand the underlying causes of somatic mutagenic processes in tumour cells, and also aid treatment selection based on cancer se- quencing.
4. Materials and methods
4.1. Cell culture, whole genome sequencing and mutation calling TheMSH2−/−DT40 cell line was made by the Enomoto group [46], and contains a biallelic 7 kb deletion at chromosome 3:8,546,954- 8,553,916 that removes exon 5 and part of exon 6 of theMSH2gene (genomic features refer to genome version galGal4). The cell line was cultured as described, and the experimental layout followed our pre- vious protocol [18]. Briefly, a single ancestral clone was isolated, cul- tured at high cell numbers for 50 days, at which point a further cloning step was performed. DNA was isolated from the ancestral clone and two descendent clones as soon as a sufficient cell number was reached.
Whole genome sequencing to 30x mean coverage was performed on Illumina HiSeq X Ten instruments at Novogene, China.
Whole genome sequencing data from wild type DT40 were obtained from our previous study [18]. Mutation detection on all the wild type andMSH2−/−DT40 genomes was done in a single run of the IsoMut detection tool with default settings [47]. The IsoMut run also included 20 other DT40 whole genome sequences obtained with the same se- quencing method, to improve noise filtering.
4.2. Human cancer somatic data
Mutational catalogues of colorectal adenocarcinoma, stomach ade- nocarcinoma and uterine corpus endometrial carcinoma were obtained from TCGA as published in [12]. Samples with more than 200 somatic mutations were selected for analysis, including 186 colorectum, 63 stomach and 93 uterus exomes, which contained 169118, 64,417 and 154,419 mutations, respectively. Clinical data including the MSI status, age at diagnosis and tumour stage were accessed from the GDC portal using theTCGAbiolinks R package [48]. To identify potential driver mutations, pathogenic and likely pathogenic mutations falling between the gene borders ofMSH2, MSH6 andMLH1 were identified in the downloaded somatic mutation data with InterVar [49].
Whole genome sequencing data of cancers of the same tissues was obtained from PCAWG as described in [20], including 60 colorectal adenocarcinoma, 75 stomach adenocarcinoma and 51 uterus adeno- carcinoma samples, comprising 10,309,246, 1,853,408 and 2,570,357 mutations, respectively. Samples were classified as MSI if the number of T deletions in mononucleotide T repeats of length≥5 was greater than 10,000 (Fig. S1).
4.3. Cell line data
Mutational data for the DLD-1 cell line were obtained from our previous study [29]. Mutational data from theMSH6knockout HAP1 cell line were downloaded from ftp://ftp.sanger.ac.uk/pub/cancer/
Zou_et_al_2017 [26]. To obtain the HAP1 mutational spectrum, SNVs were sorted into 96 triplet categories, and number of mutations in each category of the parent clones was subtracted from the corresponding child clones to reproduce the published spectrum.
Colorectal cancer cell line WES data from COGA-1, LOVO, SNU- 1684, SNU-175, CCK-81, DLD-1, HROC-24, LIM-1215, LS-180, LS-411 N and SNU-1040 [30] were filtered for common SNPs with the Ensembl Variant Effect Predictor [50], based on the Ensembl/GENCODE tran- scripts database. Any variant noted in the database was excluded from analysis. The remaining mutations are listed in Table S13.
WES-based mutational data of MMRd cell lines CW-2, GR-ST, HEC- 1, LS-180, MFE-319, MHH-PREB-1, MOLT-4 and NUGC-3 were ob- tained from [31].
4.4. Deconstruction of mutational spectra
The sequence context of the preceding and following base was de- termined for each mutation using theBSgenome.Hsapiens.UCSC.hg19R package. The resulting triplet SNV spectra were analysed for con- tributions of known mutational signatures in the COSMIC cancer mu- tation database [15]. ThedeconstructSigsR package [51] was applied with a minimum signature contribution of 6%. Reference signature sets included the 30 signatures of COSMIC v2 (Fig. 1C,Fig. 2A,Fig. 4C, D, E), 67 SBS signatures of COSMIC v3 (Fig. 2B), a selected set from these (Fig. 3E), a mixed set containing all COSMIC v2 signatures unrelated to MMRd (1, 2, 3, 4, 5 7, 8, 9, 10, 11, 12, 13, 16, 17, 18, 19, 22, 23, 24, 25, 27, 28, 29, 30) supplemented with MMRd-A and MMRd-B NMF-derived signatures (Fig. 4D, e,Fig. 5,Fig. 6C) or only MMRd-A and MMRd-B (Fig. 6B, D).
4.5. Non-negative matrix factorisation
De novomutational signature extraction was done with NMF using the R packageMutationalPatterns[52]. The data set contained sequen- cing data of MMRd samples from TCGA and PCAWG. From TCGA, samples with assigned clinical data and “MSI-H” classification were chosen. POLE mutant samples were excluded based on the extremely high number of mutations (more than 2000 in the whole exome se- quencing) in concordance with having a mutational spectrum similar to COSMIC Sig.10. In the case of PCAWG samples, criteria were set based on indel information, with the criteria that the number of T deletions in at least 5 nucleotide long T repeats exceeds 10.000, since we found an obvious separation of MSI and MSS samples (Fig. S1). The final set contained 62 colorectum, 32 stomach, 57 uterus exomes from TCGA and 8 colorectum, 6 stomach, 9 uterus genomes from PCAWG. To avoid bias from the different range of mutation numbers in exome and genome sequencing, all data were normalised to a sum of 1 in the 96 mutation categories. The robustness of the method was confirmed by performing a similar NMF separately on the exome and genome data, resulting in very similar NMF components (Fig. S4). An optimal com- ponent number rank of two was chosen based on the cophenetic cor- relation coefficient and the residual sum of squares values, as estimated with the Brunet method, in 50 cycles. NMF was then performed with a rank of 2, in 200 cycles.
4.6. Analysis of triplet frequencies in the human genome
Triplet frequencies in the whole genome and in exons were com- pared based on the human genome reference sequence hg19. Exons were determined based on theTxDb.Hsapiens.UCSC.hg19.knownGeneR package.
4.7. Classifying WGS data by genomic region
Annotated PCAWG whole genome vcf files were obtained from the ICGC portal. Sequence context as triplets were determined using the BSgenome.Hsapiens.UCSC.hg19R package. Based on the variant anno- tation the following categories were set: (1) genome – all mutations; (2) intron – annotation is “Intron”; (3) exon – annotation is “3′UTR”,
“5'Flank”, “5'UTR”, “De_novo_Start_InFrame”, “De_novo_Start_
OutOfFrame”, “Missense_Mutation”, “Nonsense_Mutation”, “Nonstop_
Mutation”, “Silent” or “Splice_Site”; (4) noncoding – annotation is
"IGR", "lincRNA" or "RNA". Exonic mutations were used to derive the simulated whole exome data.
Availability of data and materials
Whole genome sequence data generated in the course of this study is available from the European Nucleotide Archive under study accession number PRJEB36568.
Authors’ contributions
EN and AL performed the bioinformatic analyses, GJ performed the DT40 cell culture experiments, MS made theMSH2-/-cell line, GR and AB obtained and provided mutation data from colorectal cancer cell lines, DS conceived the study and wrote the manuscript, all authors read and approved the final manuscript.
Funding
This work was supported by the National Research, Development and Innovation Office of Hungary (FIEK_16-1-2016-0005 and K_124881 to DS, PD_124467 to AL). The research leading to these results has re- ceived funding from Fondazione AIRC under 5 per Mille 2018 - ID.
21091 program – P.I. Bardelli Alberto, AIRC IG 2018 - ID. 21923 project - PI Bardelli Alberto; Progetto NET-2011-02352137 Ministero della Salute (AB); AIRC-CRUK-FC AECC Accelerator Award contract 22795 (AB); Fondazione Piemontese per la Ricerca sul Cancro-ONLUS 5 per mille 2014 e 2015 Ministero della Salute (AB);
Declaration of Competing Interest
A. Bardelli has ownership interest in Phoremost and Neophore and is a consultant/advisory board member for Phoremost and Neophore.
No potential conflicts of interest were disclosed by the other authors.
Acknowledgements
The authors wish to thank Ádám Póti for assistance with mutation detection, and Zsófia Sztupinszki for help with cancer mutation data download.
Appendix A. Supplementary data
Supplementary material related to this article can be found, in the online version, athttps://doi.org/10.1016/j.dnarep.2020.102827.
References
[1] S.N. Shah, S.E. Hile, E. KA, Defective mismatch repair, microsatellite mutation bias, and variability in clinical cancer phenotypes, Cancer Res. 70 (2010) 431–435.
[2] P. Modrich, L. R, Mismatch repair in replication fidelity, genetic recombination, and cancer biology, Annu. Rev. Biochem. 65 (1996) 101–133.
[3] B.B. Campbell, N. Light, D. Fabrizio, M. Zatzman, F. Fuligni, R. de Borja, S. Davidson, M. Edwards, J.A. Elvin, K.P. Hodel, et al., Comprehensive analysis of hypermutation in human cancer, Cell 171 (2017) 1042–1056.
[4] R.J. Hause, C.C. Pritchard, J. Shendure, S.J. Salipante, Classification and char- acterization of microsatellite instability across 18 cancer types, Nat. Med. 22 (2016) 1342–1350.
[5] I. Cortes-Ciriano, S. Lee, W.Y. Park, T.M. Kim, P.J. Park, A molecular portrait of microsatellite instability across multiple cancers, Nat. Commun. 8 (2017) 15180.
[6] Z. Deng, Y. Qin, J. Wang, G. Wang, X. Lang, J. Jiang, K. Xie, W. Zhang, H. Xu, Y. Shu, Y. Zhang, Prognostic and predictive role of DNA mismatch repair status in stage II-III colorectal cancer: a systematic review and meta-analysis, Clin. Genet. 97 (2020) 25–38.
[7] M. Kato, M. Takano, M. Miyamoto, N. Sasaki, T. Goto, H. Tsuda, F. K, DNA mis- match repair-related protein loss as a prognostic factor in endometrial cancers, J.
Gynecol. Oncol. 26 (2015) 40–45.
[8] Durham J.N. Le DT, K.N. Smith, H. Wang, B.R. Bartlett, L.K. Aulakh, S. Lu, H. Kemberling, C. Wilt, B.S. Luber, et al., Mismatch repair deficiency predicts re- sponse of solid tumors to PD-1 blockade, Science 357 (2017) 409–413.
[9] R. Mandal, R.M. Samstein, K.W. Lee, J.J. Havel, H. Wang, C. Krishna, E.Y. Sabio, V. Makarov, F. Kuo, P. Blecua, et al., Genetic diversity of tumors with mismatch repair deficiency influences anti-PD-1 immunotherapy response, Science 364 (2019) 485–491.
[10] G. Germano, N. Amirouchene-Angelozzi, G. Rospo, B. A, The clinical impact of the genomic landscape of mismatch repair-deficient cancers, Cancer Discov. 8 (2018) 1518–1528.
[11] M. Baretti, D.T. Le, DNA mismatch repair in cancer, Pharmacol. Ther. 189 (2018) 45–62.
[12] L.B. Alexandrov, S. Nik-Zainal, D.C. Wedge, S.A. Aparicio, S. Behjati, A.V. Biankin, G.R. Bignell, N. Bolli, A. Borg, A.L. Borresen-Dale, et al., Signatures of mutational processes in human cancer, Nature 500 (2013) 415–421.
[13] S. Nik-Zainal, L.B. Alexandrov, D.C. Wedge, P. Van Loo, C.D. Greenman, K. Raine,
D. Jones, J. Hinton, J. Marshall, L.A. Stebbings, et al., Mutational processes molding the genomes of 21 breast cancers, Cell 149 (2012) 979–993.
[14] L.B. Alexandrov, P.H. Jones, D.C. Wedge, J.E. Sale, P.J. Campbell, S. Nik-Zainal, S. MR, Clock-like mutational processes in human somatic cells, Nat. Genet. 47 (2015) 1402–1407.
[15] COSMIC, COSMIC: Signatures of Mutational Processes in Human Cancer, (2019) http://cancer.sanger.ac.uk/cosmic/signatures.
[16] L.B. Alexandrov, S. Nik-Zainal, D.C. Wedge, P.J. Campbell, S. MR, Deciphering signatures of mutational processes operative in human cancer, Cell Rep. 3 (2013) 246–259.
[17] S. Nik-Zainal, J.E. Kucab, S. Morganella, D. Glodzik, L.B. Alexandrov, V.M. Arlt, A. Weninger, M. Hollstein, M.R. Stratton, Phillips DH, The genome as a record of environmental exposure, Mutagenesis 30 (2015) 763–770.
[18] J. Zamborszky, B. Szikriszt, J.Z. Gervai, O. Pipek, A. Poti, M. Krzystanek, D. Ribli, J.M. Szalai-Gindl, I. Csabai, Z. Szallasi, et al., Loss of BRCA1 or BRCA2 markedly increases the rate of base substitution mutagenesis and has distinct effects on genomic deletions, Oncogene 36 (2017) 746–755.
[19] A. Poti, H. Gyergyak, E. Nemeth, O. Rusz, S. Toth, C. Kovacshazi, D. Chen, B. Szikriszt, S. Spisak, S. Takeda, et al., Correlation of homologous recombination deficiency induced mutational signatures with sensitivity to PARP inhibitors and cytotoxic agents, Genome Biol. 20 (2019) 240.
[20] L.B. Alexandrov, J. Kim, N.J. Haradhvala, M.N. Huang, A.W. Ng, Y. Wu, A. Boot, K.R. Covington, D.A. Gordenin, E.N. Bergstrom, et al., The repertoire of mutational signatures in human Cancer, bioRxiv (2019) 322859.
[21] D. Liu, G. Keijzers, R. LJ, DNA mismatch repair and its many roles in eukaryotic cells, Mutat. Res. 773 (2017) 174–187.
[22] T.A. Kunkel, D.A. Erie, Eukaryotic mismatch repair in relation to DNA replication, Annu. Rev. Genet. 49 (2015) 291–313.
[23] E.M. Goellner, C.D. Putnam, Kolodner RD, Exonuclease 1-dependent and in- dependent mismatch repair, DNA Repair (Amst) 32 (2015) 24–32.
[24] A. de la Chapelle, Genetic predisposition to colorectal cancer, Nat. Rev. Cancer 4 (2004) 769–780.
[25] M. Tomkova, M. McClellan, S. Kriaucionis, Schuster-Bockler B: DNA Replication and associated repair pathways are involved in the mutagenesis of methylated cy- tosine, DNA Repair (Amst) 62 (2018) 1–7.
[26] X. Zou, M. Owusu, R. Harris, S.P. Jackson, J.I. Loizou, N.-Z. S, Validating the concept of mutational signatures with isogenic cell models, Nat. Commun. 9 (2018) 1744.
[27] B. Meier, N.V. Volkova, Y. Hong, P. Schofield, P.J. Campbell, M. Gerstung, G. A, Mutational signatures of DNA mismatch repair deficiency in C. Elegans and human cancers, Genome Res. 28 (2018) 666–675.
[28] B. Szikriszt, A. Poti, O. Pipek, M. Krzystanek, N. Kanu, J. Molnar, D. Ribli, Z. Szeltner, G.E. Tusnady, I. Csabai, et al., A comprehensive survey of the mutagenic impact of common cancer cytotoxics, Genome Biol. 17 (2016) 99.
[29] A. Poti, K. Berta, Y. Xiao, O. Pipek, G.T. Klus, T. Ried, I. Csabai, K. Wilcoxen, K. Mikule, Z. Szallasi, S. D, Long-term treatment with the PARP inhibitor niraparib does not increase the mutation load in cell line models and tumour xenografts, Br. J.
Cancer 119 (2018) 1392–1400.
[30] G. Rospo, A. Lorenzato, N. Amirouchene-Angelozzi, A. Magri, C. Cancelliere, G. Corti, C. Negrino, V. Amodio, M. Montone, A. Bartolini, et al., Evolving neoan- tigen profiles in colorectal cancers with DNA repair defects, Genome Med. 11 (2019) 42.
[31] M. Petljak, L.B. Alexandrov, J.S. Brammeld, S. Price, D.C. Wedge, S. Grossmann, K.J. Dawson, Y.S. Ju, F. Iorio, J.M.C. Tubio, et al., Characterizing mutational sig- natures in human cancer cell lines reveals episodic APOBEC mutagenesis, Cell 176 (2019) 1282–1294.
[32] I. Martincorena, A. Roshan, M. Gerstung, P. Ellis, P. Van Loo, S. McLaren, D.C. Wedge, A. Fullam, L.B. Alexandrov, J.M. Tubio, et al., Tumor evolution. High burden and pervasive positive selection of somatic mutations in normal human skin, Science 348 (2015) 880–886.
[33] F. Blokzijl, J. de Ligt, M. Jager, V. Sasselli, S. Roerink, N. Sasaki, M. Huch, S. Boymans, E. Kuijk, P. Prins, et al., Tissue-specific mutation accumulation in human adult stem cells during life, Nature 538 (2016) 260–264.
[34] I. Martincorena, J.C. Fowler, A. Wabik, A.R.J. Lawson, F. Abascal, M.W.J. Hall, A. Cagan, K. Murai, K. Mahbubani, M.R. Stratton, et al., Somatic mutant clones colonize the human esophagus with age, Science 362 (2018) 911–917.
[35] H. Lee-Six, S. Olafsson, P. Ellis, R.J. Osborne, M.A. Sanders, L. Moore, N. Georgakopoulos, F. Torrente, A. Noorani, M. Goddard, et al., The landscape of somatic mutation in normal colorectal epithelial cells, Nature 574 (2019) 532–537.
[36] I.Y. Chang, S.H. Kim, H.J. Cho, D.Y. Lee, M.H. Kim, M.H. Chung, Y. HJ, Human AP endonuclease suppresses DNA mismatch repair activity leading to microsatellite instability, Nucleic Acids Res. 33 (2005) 5073–5081.
[37] L.J. Hofseth, M.A. Khan, M. Ambrose, O. Nikolayeva, M. Xu-Welliver, M. Kartalou, S.P. Hussain, R.B. Roth, X. Zhou, L.E. Mechanic, et al., The adaptive imbalance in base excision-repair enzymes generates microsatellite instability in chronic in- flammation, J. Clin. Invest. 112 (2003) 1887–1894.
[38] D.E. Barnes, T. Lindahl, Repair and genetic consequences of endogenous DNA base damage in mammalian cells, Annu. Rev. Genet. 38 (2004) 445–476.
[39] R.C. Poulos, J. Olivier, W. JWH, The interaction between cytosine methylation and processes of DNA replication and repair shape the mutational landscape of cancer genomes, Nucleic Acids Res. 45 (2017) 7786–7795.
[40] T.A. Kunkel, B. K, DNA replication fidelity, Annu. Rev. Biochem. 69 (2000) 497–529.
[41] A. Viel, A. Bruselles, E. Meccia, M. Fornasarig, M. Quaia, V. Canzonieri, E. Policicchio, E.D. Urso, M. Agostini, M. Genuardi, et al., A specific mutational signature associated with DNA 8-Oxoguanine persistence in MUTYH-defective colorectal Cancer, EBioMedicine 20 (2017) 39–49.
[42] A. Zlatanou, E. Despras, T. Braz-Petta, I. Boubakour-Azzouz, C. Pouvelle, G.S. Stewart, S. Nakajima, A. Yasui, A.A. Ishchenko, K. PL, The hMsh2-hMsh6 complex acts in concert with monoubiquitinated PCNA and Pol eta in response to oxidative DNA damage in human cells, Mol. Cell 43 (2011) 649–662.
[43] T.A. Kunkel, R.M. Schaaper, R.A. Beckman, L. LA, On the fidelity of DNA replica- tion. Effect of the next nucleotide on proofreading, J. Biol. Chem. 256 (1981) 9883–9889.
[44] R.A. Beckman, L.A. Loeb, Multi-stage proofreading in DNA replication, Q. Rev.
Biophys. 26 (1993) 225–331.
[45] N.J. Haradhvala, J. Kim, Y.E. Maruvka, P. Polak, D. Rosebrock, D. Livitz, J.M. Hess, I. Leshchiner, A. Kamburov, K.W. Mouw, et al., Distinct mutational signatures characterize concurrent loss of polymerase proofreading and mismatch repair, Nat.
Commun. 9 (2018) 1746.
[46] F. Onoda, M. Seki, W. Wang, Enomoto T, The hyper unequal sister chromatid re- combination in an sgs1 mutant of budding yeast requires MSH2, DNA Repair (Amst) 3 (2004) 1355–1362.
[47] O. Pipek, D. Ribli, J. Molnar, A. Poti, M. Krzystanek, A. Bodor, G.E. Tusnady, Z. Szallasi, I. Csabai, D. Szuts, Fast and accurate mutation detection in whole genome sequences of multiple isogenic samples with IsoMut, BMC Bioinformatics 18 (2017) 73.
[48] M. Mounir, M. Lucchetta, T.C. Silva, C. Olsen, G. Bontempi, X. Chen, H. Noushmehr, A. Colaprico, P. E, New functionalities in the TCGAbiolinks package for the study and integration of cancer data from GDC and GTEx, PLoS Comput. Biol. 15 (2019) e1006701.
[49] Q. Li, K. Wang, InterVar: clinical interpretation of genetic variants by the 2015 ACMG-AMP guidelines, Am. J. Hum. Genet. 100 (2017) 267–280.
[50] W. McLaren, L. Gil, S.E. Hunt, H.S. Riat, G.R. Ritchie, A. Thormann, P. Flicek, F. Cunningham, The ensembl variant effect predictor, Genome Biol. 17 (2016) 122.
[51] R. Rosenthal, N. McGranahan, J. Herrero, B.S. Taylor, C. Swanton, DeconstructSigs:
delineating mutational processes in single tumors distinguishes DNA repair defi- ciencies and patterns of carcinoma evolution, Genome Biol. 17 (2016) 31.
[52] F. Blokzijl, R. Janssen, R. van Boxtel, E. Cuppen, MutationalPatterns: comprehen- sive genome-wide analysis of mutational processes, Genome Med. 10 (2018) 33.