https://doi.org/10.1007/s10198-019-01066-x ORIGINAL PAPER
Cost‑of‑illness studies in nine Central and Eastern European countries
Valentin Brodszky1 · Zsuzsanna Beretzky1,9 · Petra Baji1 · Fanni Rencz1,2 · Márta Péntek1 · Alexandru Rotar3 · Konstantin Tachkov4 · Susanne Mayer5 · Judit Simon5,10 · Maciej Niewada6 · Rok Hren7,8 · László Gulácsi1
Received: 30 March 2019 / Accepted: 15 April 2019 / Published online: 18 May 2019
© The Author(s) 2019
Abstract
Background To date, a multi-country review evaluating the cost-of-illness (COI) studies from the Central and Eastern European (CEE) region has not yet been published. Our main objective was to provide a general description about published COI studies from CEE.
Methods A systematic search was performed between 1 January 2006 and 1 June 2017 in Medline, EMBASE, The Cochrane Library, CINAHL, and Web of Science to identify all relevant COI studies from nine CEE countries. COI studies reporting costs without any restrictions by age, co-morbidities, or treatment were included. Methodology, publication standards, and cost results were analysed.
Results We identified 58 studies providing 83 country-specific COI results: Austria (n = 9), Bulgaria (n = 16), Croatia (n = 3), the Czech Republic (n = 10), Hungary (n = 24), Poland (n = 11), Romania (n = 3), Slovakia (n = 3), and Slovenia (n = 4).
Endocrine, nutritional, and metabolic diseases (18%), neoplasms (12%), infections (11%), and neurological disorders (11%) were the most frequently studied clinical areas, and multiple sclerosis was the most commonly studied disease. Overall, 57 (98%) of the studies explicitly stated the source of resource use data, 45 (78%) the study perspective, 34 (64%) the costing method, and 24 (58%) reported at least one unit costs. Regardless of methodological differences, a positive relationship was observed between costs of diseases and countries’ per capita GDP.
Conclusions Cost-of-illness studies varied considerably in terms of methodology, publication practice, and clinical areas.
Due to these heterogeneities, transferability of the COI results is limited across Central and Eastern European countries.
Keywords Cost-of-illness · Disease burden · Central and Eastern Europe · Austria · Bulgaria · The Czech Republic · Croatia · Hungary · Poland · Romania · Slovakia · Slovenia
JEL Classification I10
Electronic supplementary material The online version of this article (https ://doi.org/10.1007/s1019 8-019-01066 -x) contains supplementary material, which is available to authorized users.
* Valentin Brodszky
valentin.brodszky@uni-corvinus.hu
1 Department of Health Economics, Corvinus University of Budapest, Fővám tér 8., 1093 Budapest, Hungary
2 Hungarian Academy of Sciences, Premium Postdoctoral Research Program, Nádor u. 7, 1051 Budapest, Hungary
3 Department of Social Medicine, University of Amsterdam, Meibergdreef 9, 22660, 1100 DD Amsterdam,
The Netherlands
4 Department of Social Pharmacy and Pharmacoeconomics, Faculty of Pharmacy, Medical University of Sofia, 2, Dunav str., 1000 Sofia, Bulgaria
5 Department of Health Economics, Center for Public Health, Medical University of Vienna, Kinderspitalgasse 15/1, Vienna 1090, Austria
6 Department of Experimental and Clinical Pharmacology, Medical University of Warsaw, Banacha 1b, 02-097 Warsaw, Poland
7 Institute of Mathematics, Physics, and Mechanics, Jadranska 19, 1000 Ljubljana, Slovenia
8 Department of Physics, University of Ljubljana, Jadranska 19, 1000 Ljubljana, Slovenia
9 Doctoral School of Business and Management, Corvinus University of Budapest, Fővám tér 8., 1093 Budapest, Hungary
10 Ludwig Boltzmann Institute Applied Diagnostics, Währinger Gürtel 18-20, Vienna 1090, Austria
Introduction
Cost-of-illness (COI) studies provide information on the economic burden of a specific disease from a societal, pub- lic payer, family or individual perspective. They aim to evaluate not only the disease-related healthcare costs but also the overall costs to society, including both medical and non-medical costs. COI studies can aid the understanding of the importance of a health problem, estimate the main cost components and the cost structure, and, thus, provide valu- able cost estimates for use in full economic evaluations [1].
As a result, COI studies are an important type of health eco- nomic analysis aiming to support health policy and financ- ing decision-making processes [2]. Over the past decade, health technology assessment has been implemented in most Central and Eastern European (CEE) countries, which, in turn, necessitates reliable, local country-specific COI stud- ies [3–5].
There are no gold standard methods for calculating COI estimates [6–8]. Although standardization of the methods used in COI studies is becoming more and more impor- tant to allow comparability, studies apply different designs, methodologies, perspectives, and costing approaches [9, 10].
Until now, several systematic reviews of COI studies have been conducted; however, most of them were focusing on one specific disease. Few reviews targeted a single specific cost item or component, such as informal care, direct medi- cal costs, productivity loss, a specific geographic area, or a specific methodological aspect [10–13]. Nonetheless, COI studies from CEE countries have not been reviewed to date, with the exception of Austria [13].
This review has been undertaken to provide a description of the COI studies in nine CEE countries, namely Austria, Bulgaria, the Czech Republic, Croatia, Hungary, Poland, Romania, Slovakia, and Slovenia, in the past 10 years. The main objectives were to describe study characteristics, meth- odology, and the COI estimates reported. First, we provide an overview of applied methods. Then, we present and com- pare the COI estimates across CE countries.
Methods
Search strategyWe conducted a systematic review following the PRISMA statement [14]. A literature search was performed using Medline, EMBASE, The Cochrane Library, CINAHL, and Web of Science databases to identify studies that report data on the cost of a disease. The search strategy was based on the keyword “cost of illness” and the name of the given CEE country (online Appendix 1). The search was limited to
studies published in the past 10 years (1 January 2006—31 October 2016) and was updated on 30 June 2017 to shorten the time between the end of the search period and publica- tion date. No language restrictions were applied. A com- plementary, non-systematic literature search was conducted in three countries. Three authors (SM, KT, and ZB) hand- searched for further papers in selected, peer-reviewed, non- indexed local journals in Austria, Bulgaria, and Hungary.
The review protocol was not registered.
Study selection
After removing duplicates, titles and abstracts of stud- ies were reviewed independently by ZB, VB, and LG, and were retrieved if at least one of the reviewers considered the study to be relevant. First, abstracts (publication type) and reviews (publication type) were excluded. Full-text papers of the remaining studies were reviewed and included (ZB, VB, and LG). Any disagreement between reviewers was solved by discussions among the authors to reach consensus.
Studies were selected for further analysis if they met the following inclusion criteria: (i) COI data included for a spe- cific disease without major restriction on the patient popula- tion, e.g., by age, co-morbidity, complication, or treatment, (ii) full-text paper, (iii) original research, and (iv) the study population was recruited in Austria, Bulgaria, the Czech Republic, Croatia, Hungary, Poland, Romania, Slovakia, or Slovenia. Studies were not selected for further analysis if they represented clinical trials, reviews, cost-effectiveness studies, budget impact analyses, treatment-related (drug) studies, costs of health programs (e.g., screening), or stud- ies enrolling a patient population with co-morbidities (e.g., diabetic patient with depression).
Data extraction
A Microsoft Excel spreadsheet was developed to extract data from the identified studies, including general characteris- tics of the study (year of publication, geographical location, language, and funding source), methodological details of the study (disease, data collection method, study design, setting, costing year, currency, and perspective and costing methods), and results (direct costs, indirect costs, and total costs in euros). The list of extracted variables was created based on health economic checklists and adjusted by screen- ing of six (10%) random articles [6, 15]. Costs reported in currencies other than euro were converted to euro at a mean annual exchange rate, and all costs were inflated to 2017 prices using the harmonised consumer price index extracted from Eurostat [16]. To facilitate cross-country comparisons, costs were also described as a percentage of 2017 GDP per capita. Diseases were categorised according to the Inter- national Statistical Classification of Diseases and Related
Health Problems 10th Revision (ICD-10 Version:16) [17].
Data extraction was conducted by ZB and respective authors for national languages and double-checked.
Results
Study selectionAs can be seen from Fig. S1 (online Appendix), after remov- ing 246 duplicates, the search in the electronic databases resulted in 607 potentially relevant papers. Of these studies, 55 were not full-text papers and 98 were reviews. Further- more, 282 papers did not report disease-related costs, 54 focused on costs of multiple diseases, and 67 focused on the cost of a certain treatment. Overall, 50 articles from the electronic search fulfilled the inclusion criteria. The sup- plementary local search resulted in another eight relevant articles in non-indexed, peer-reviewed journals (Austria:
n = 2, Bulgaria: n = 5, and Hungary: n = 1).
Altogether, we included 58 articles (involving also multi- country studies) that reported results for Hungary (n = 24), Bulgaria (n = 16), Poland (n = 11), Czech Republic (n = 10), Austria (n = 9), Slovenia (n = 4), Croatia (n = 3), Slovakia (n = 3), and Romania (n = 3).
Thirteen additional COI studies did not meet to our eli- gibility criteria (e.g., involved samples restricted by age, co-morbidity, complication, or treatment), but we found their results worthy of attention, and hence, a summary of their characteristics and main results is presented in online Appendix 1.
Study characteristics
The majority of publications reported costs from one coun- try (74%), but 15 studies presented results from multiple countries, and hence, altogether, 83 country-specific results were provided by 58 studies (Table 1). Three-quarters of the studies were published in English (n = 44), and except for five papers [18–22], all non-English papers had an English abstract. Most of the publications (n = 45, 78%) presented costs in euro. In 37 studies, the national currency was con- verted to euro; of them, 17 (46%) studies stated explicitly exchange rate, 5 (14%) studies reported only the source of exchange rate, and 15 (40%) studies did not mention conver- sion at all. Among countries outside the euro zone, reporting costs in national currency was most common in Romania (67%). Overall, 47 (81%) studies stated the source of fund- ing. The lack of a funding statement was most prevalent in Romania (n = 2, 67%) and in Bulgaria (n = 5; 31%). Only two studies received funds from two different sources, both of them were funded by the European Union (EU) and the local government. Regarding clinical areas, endocrine, nutritional,
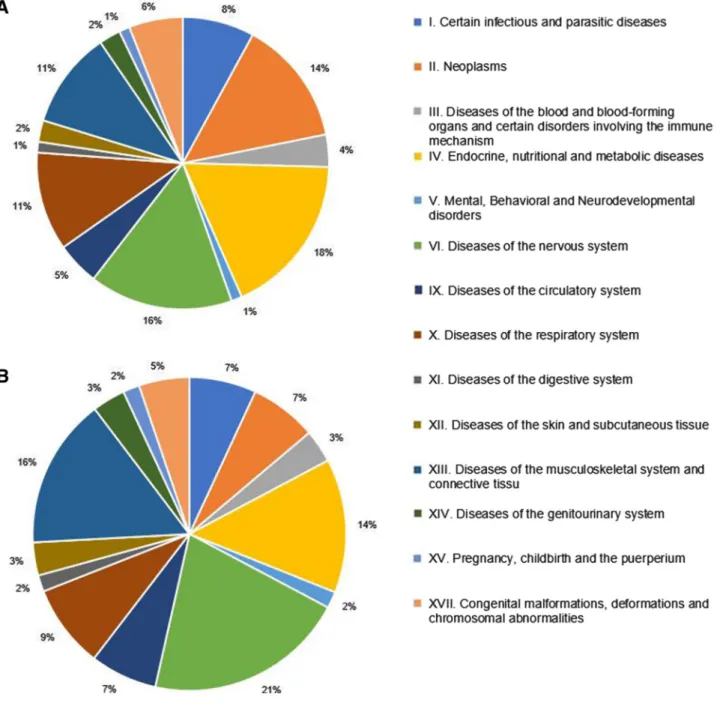
and metabolic diseases were the most common, in which costs were analysed (n = 15 country-specific results), fol- lowed by neoplasms (n = 12), and certain infectious and parasitic diseases (n = 10) (Fig. 1). Altogether 48 different diseases were analysed in the 58 included articles.
Methods
Analyses by countries are presented in Table 1. The most frequently used data source was a retrospective, self-com- pleted resource use questionnaire (48%), followed by retro- spective claims data analysis (14%) and prospective diary (14%). Sample sizes ranged from n = 2 (small cohorts) to n = 127,512 (large population-based study). Of the 58 stud- ies included in the review, 26 (45%) presented aggregated results for each main cost category (i.e., direct medical, direct non-medical, and indirect). The majority of studies applied the societal perspective (52%), followed by the pub- lic payer perspective (17%). If reported, bottom–up (38%) and top–down (21%) methods were used for estimating the costs in the studies. Productivity losses were estimated in 47 (81%) studies; of them, the human capital approach and friction cost method were used in 34 (72%) and 11 (23%) studies, respectively, and the method was not specified in 11 (23%) studies. Studies that reported costs of informal care (n = 29) applied the proxy-good method (17%) or the opportunity cost method (10%), but the name of the applied method was not stated in most of them (69%). Unit costs were not reported at all in 58% of the studies.
Cost‑of‑illness: comparison across countries in one disease
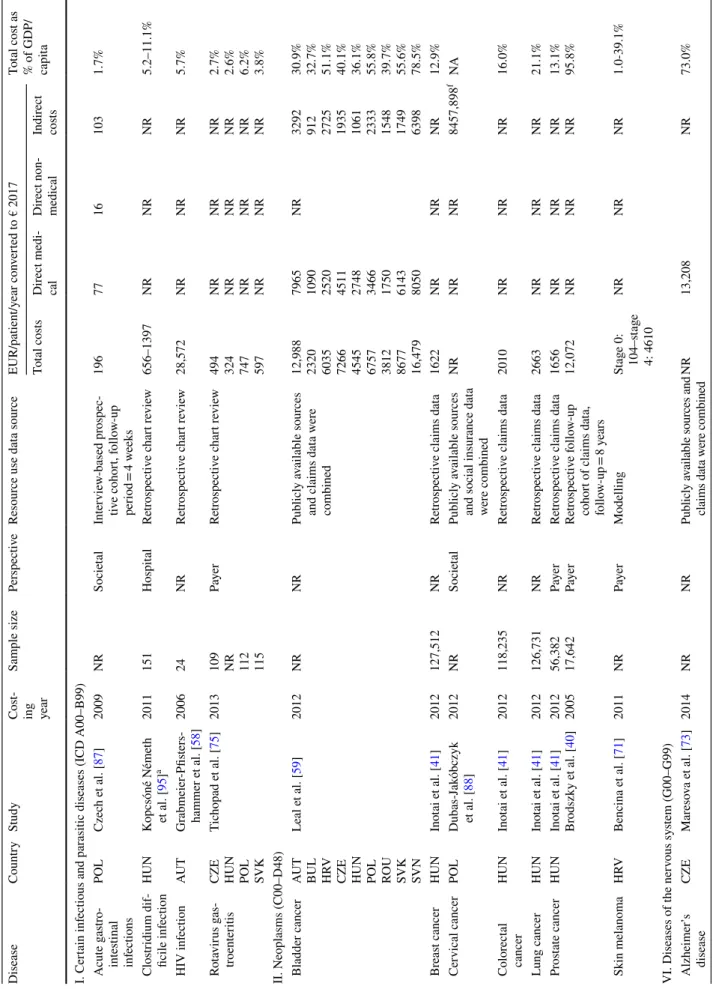
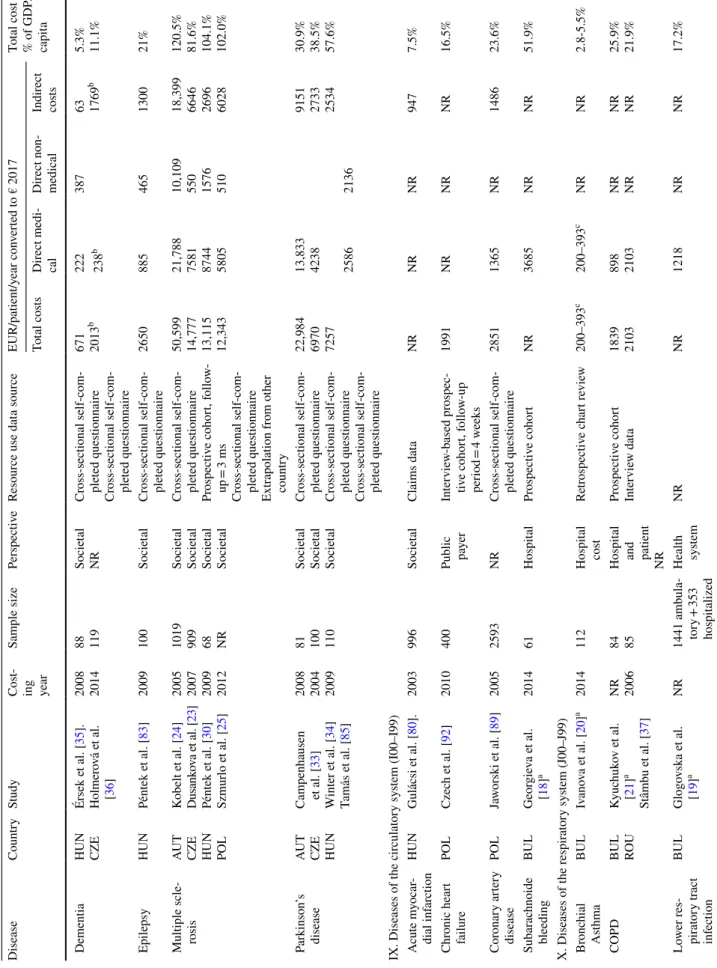
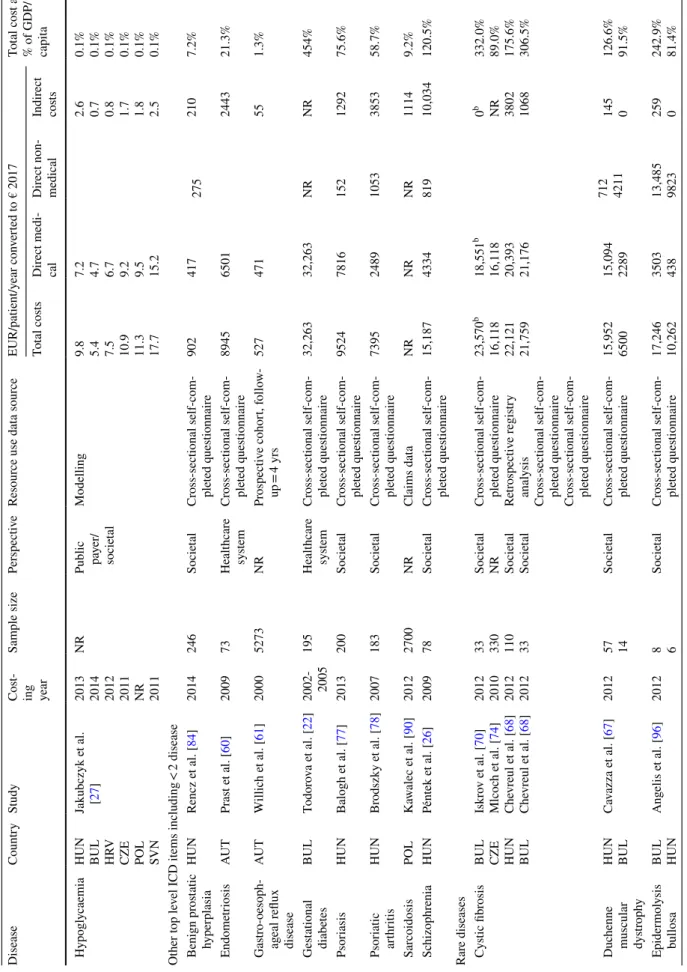
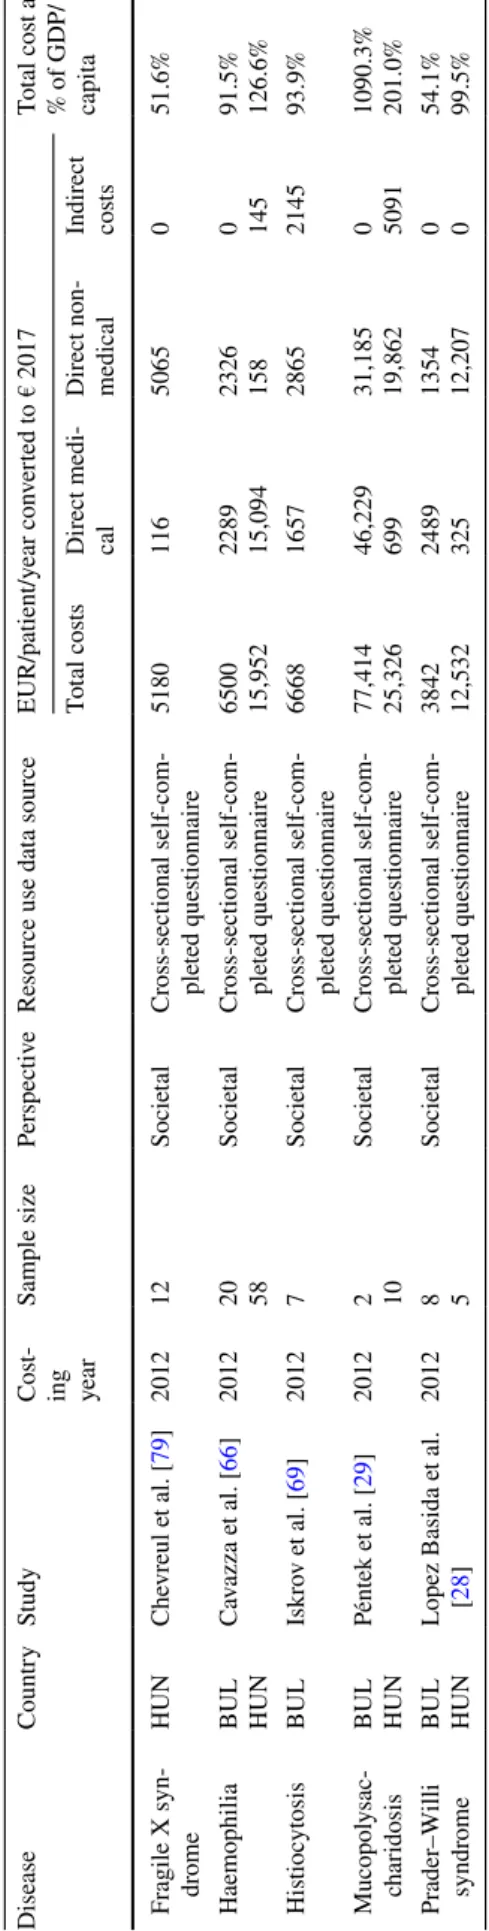
Eighty-three COI estimates were reported for 48 differ- ent diseases. Apart from rare diseases, multiple sclerosis caused the highest economic burden in terms of average total annual cost per patient in three countries (Austria €50,599, the Czech Republic €14,777, and Poland €12,343) [23–25].
In Hungary, schizophrenia (€15,187), and in Bulgaria, ges- tational diabetes (€32,263) were the most costly diseases [22, 26].
Multi-country studies were conducted in nine diagnoses (rotavirus gastroenteritis, pneumonia, bladder cancer, hypo- glycaemia, Duchenne muscular dystrophy, epidermolysis bullosa, Prader–Willi syndrome, cystic fibrosis, and hae- mophilia). One multi-country study (bladder cancer) was conducted in nine countries and another (hypoglycaemia) in six countries. Two studies were conducted (rotavirus gastroenteritis and pneumonia) in four countries and four studies (Duchenne muscular dystrophy, epidermolysis bul- losa, Prader–Willi, and haemophilia) in two countries. The bladder cancer study involving nine countries resulted in
Table 1 Characteristics of cost-of-illness studies CharacteristicNumber of country-specific results: N = 83; Number of papers: N = 581 Totala Austria [24, 33, 58–64]
Bulgaria [18–22, 27–29, 32, 59, 65–70]
Croatia [27, 59, 71]
Czech Republic [23, 27, 34, 36, 59, 72–76]
Hungary [26–30, 35, 41, 59, 65, 67, 68, 75–86]
Poland [25, 27, 59, 75, 76, 87–92]
Romania [37, 59, 93]
Slovakia [59, 75, 76]
Slovenia [27, 31, 59, 94] Total number of studies916310241133458 English511310211113444 National language45003020014 Search Electronic database search711310231133350 Hand-search25NANA1NANANANA8 Currency Euro910310211013345 National currencyNA6003120113 Source of resource use data Retrospective cross- sectional, self-completed questionnaire
690315100028 Retrospective chart review1102210105 Interview-based prospective cohort1201031008 Retrospective claims data0001531108 Combination of various sourcesb1212121136 Modelling0121110012 NR0100000001 Perspective Public payer22222301210 Societal280318400130 Patient2000000002 Hospital0500001006 NR51154422113 Costing method Top–down11011201012 Bottom–up3101316201222 NR55267731224
Table 1 (continued) CharacteristicNumber of country-specific results: N = 83; Number of papers: N = 581Totala Austria [24, 33, 58–64]
Bulgaria [18–22, 27–29, 32, 59, 65–70]
Croatia [27, 59, 71]
Czech Republic [23, 27, 34, 36, 59, 72–76]
Hungary [26–30, 35, 41, 59, 65, 67, 68, 75–86]
Poland [25, 27, 59, 75, 76, 87–92]
Romania [37, 59, 93]
Slovakia [59, 75, 76]
Slovenia [27, 31, 59, 94] Indirect cost calculation method Human capital580318701134 Friction cost11121111111 NR0000200002 N/A37252321211 Informal care monetary valuation Proxy good08101610005 Opportunity cost1103211113 NR20020100020 Other1000000001 N/A57256722329 Funding source EU18009100013 Pharmaceutical industry52138413111 Government10053100013 Other0001000001 None21214300211 NR15000320111 Cost per patient reported Direct medical costs5131420531138 Indirect costs6102621912338 Informal care cost491518311129 Total costs8133723933347 Any unit costs Reported381716521224 NR68238612234 NR not reported, N/A not applicable a Several studies published results for multiple countries. These studies are referred in each relevant country columns in a row, while, in the total column, a study might be referred only once in a row. Therefore, adding numbers in a row results in a larger sum than in the total column b Studies used combination of various sources of data: peer-reviewed published studies, national reports from governmental or professional bodies, extrapolations from similar countries, aggre- gated macrolevel data, claim data, and questionnaire survey
mean total costs of €7421; however, costs differed signifi- cantly among countries, as the total cost was between €2320 (Bulgaria) and €16,479 (Slovenia). The direct medical cost ranged between €1090 (Bulgaria) and €8050 (Slovenia), and indirect cost varied between €912 (Bulgaria) and €6398 (Slovenia). The hypoglycaemia study was conducted in six countries, and the total overall societal cost per patient with diabetes was €11 and ranged between €5 (Bulgaria) and
€18 (Slovenia) [27]. Rotavirus gastroenteritis and pneu- monia studies were conducted in four countries and the average total costs were €541 and €764, respectively. Costs
varied between €494 (Czech Republic) and €747 (Poland) in rotavirus gastroenteritis, and between €472 and €1111 in pneumonia. Duchenne muscular dystrophy, epidermoly- sis bullosa, Prader–Willi syndrome, cystic fibrosis, and haemophilia were studied in two countries (Hungary and Bulgaria) applying the same methodology in a European Commission founded rare disease study (BURQOL-RD pro- ject). Prader–Willi syndrome was the least costly (Bulgaria:
€3842 Hungary: €12,532) and mucopolysaccharidosis was the most costly rare disease (Bulgaria: €77,414; Hungary:
€25,326) [28, 29].
Fig. 1 Distribution of COI studies by ICD classification. a Distribution of country-specific results across clinical areas defined by ICD groups (n = 83). b Distribution of studies between clinical areas defined by ICD groups (n = 58)
Unique studies in more than one country were conducted in eight diagnoses, namely multiple sclerosis, dementia, Par- kinson’s disease, rheumatoid arthritis, osteoporosis, chronic obstructive pulmonary disease (COPD), systemic sclerosis, and diabetes. Multiple sclerosis and diabetes were studied most often (four studies each), while three unique studies in three different countries were conducted in Parkinson’s disease and two unique studies in three different countries were conducted in cystic fibrosis. Two unique studies on both dementia and COPD were conducted in two different countries. In multiple sclerosis, there was a 4.1 times dif- ference in total costs between Austria (€50,599) and Poland (€12,343) [24, 30]. In diabetes, the highest direct cost was observed in Hungary (€1309) and the lowest total cost was observed in Bulgaria (€472) [31, 32]. In Parkinson’s dis- ease, there was a 3.3 times difference in total costs between Austria (€22,984) and the Czech Republic (€6970) [33, 34].
In dementia, we found a 3.5 times difference in total costs between the Czech Republic (€2013) and Hungary (€671) [35, 36]. The costs of COPD were similar in Bulgaria (€1839) and Romania (€2103) [21, 37].
Adjusting costs for GDP per capita level, differences between countries decreased (Table 2). For instance, a 7.1- fold difference in bladder cancer and a 4.1-fold difference in multiple sclerosis were reduced to 2.4- and 1.5-fold, respec- tively. Comparing diseases with available cost estimates from more than one country (Fig. 2), a positive relationship was identified between costs and GDP per capita.
Discussion
A systematic search was conducted to provide a review of the COI studies in nine CEE countries. The diffusion of the new technologies to the health scare systems is enor- mous, prices, and technologies, and professional guidelines are changing; therefore, our search was limited for the past 10 years. The included papers covered a broad range of clini- cal areas and showed notable cross-country differences in terms of methodology and publication standards as well as the average yearly costs per patient.
Study characteristics and methodology
Reporting cost results in euros was dominant over national currencies, suggesting that researchers in the CEE region find it important to make their results available for the international scientific community and allow for com- parability with other studies. To assess study quality, we selected some quality indicators, such as those are used in health economics checklists. Reporting study perspective, reference year, costing method (top–down vs. bottom–up), source of resource use, valuation of informal care, valuation
of productivity loss, and funding source were considered as quality indicators. We find it noteworthy to mention that whilst the source of data on resource utilization and refer- ence year of costing were stated in nearly every paper (98%
and 95%, respectively), other important quality indicators were less often reported. The study perspective was reported in 78%, the approach to valuing indirect costs in 77%, cost- ing method in 64%, at least one unit cost in 42%, and method for valuing informal care in 31% of the studies. A recent review of economic evaluations in Austria found that the study perspective and reference year were not reported by 60% and 25% of the studies, respectively [13]. Differences may be explained by inclusion of non-peer-reviewed or grey literature (e.g., economic evaluation reports from national health technology assessment agencies) and of other forms of economic evaluations in the study by Mayer et al. The review by Mayer et al. included 93 (partial and full) eco- nomic evaluations, 14 of which were cost-of-illness analy- ses. Out of the 93 included studies, 23 were not indexed according to the Journal Citation Reports (Social) Sciences Edition and 12 were non-peer-reviewed reports [13].
Clinical areas
A large variety of diseases was covered by the studies, and most of them occurred in a one study. Each disease was stud- ied by, on average, 1.3 papers. Considering country-specific results by ICD categories, endocrine, nutritional, and meta- bolic diseases (18%), neoplasms (14%), infectious (12%), neurologic (11%), and musculoskeletal diseases (11%) represented the five main fields of COI research in CEE.
It is difficult to judge the drivers of the selection of clinical fields. The public health importance of a disease might be an important factor as, for instance, all the studies in the ‘Endo- crine, nutritional and metabolic diseases’ ICD category were related to diabetes, and among neoplasms studies, the most prevalent malignancies (breast, colorectal, lung, and pros- tate cancer) were present (Table 2). According to the Global Burden of Disease study, the leading three causes of total Disability-Adjusted Life Years (DALY) included ischaemic heart disease, cerebrovascular disease, and lower respira- tory infection, comprising 16% of all DALYs [38]. Leading causes of DALYs were represented only in six (10%) stud- ies (cerebrovascular disease: n = 1, ischaemic heart disease:
n = 2, and lower respiratory infection: n = 3) in our review, questioning public health importance as a driver of topic selection in COI studies. The need for COI data to support decision-making on reimbursement of highly effective but costly new drugs seems to be another relevant issue, and this hypothesis is supported by the relatively high rate of studies in inflammatory rheumatic diseases, where biological drugs were introduced in the CEE countries in the observed period.
Multiple sclerosis is another disorder where biologicals
Table 2 Cost-of-illness in nine CEE countries (€ 2017) DiseaseCountryStudyCost- ing year
Sample sizePerspectiveResource use data sourceEUR/patient/year converted to € 2017Total cost as
% of GDP/ capit
aTotal costsDirect medi- calDirect non- medicalIndirect costs I. Certain infectious and parasitic diseases (ICD A00–B99) Acute gastro- intestinal infections
POLCzech et al. [87]2009NRSocietalInterview-based prospec- tive cohort, follow-up period = 4 weeks
19677161031.7% Clostridium dif- ficile infectionHUNKopcsóné Németh et al. [95]a2011151HospitalRetrospective chart review656–1397NRNRNR5.2–11.1% HIV infectionAUTGrabmeier-Pfisters- hammer et al. [58]200624NRRetrospective chart review28,572NRNRNR5.7% Rotavirus gas- troenteritis
CZE HUN POL SVK
Tichopad et al. [75]2013
109 NR 112 115
PayerRetrospective chart review
494 324 747 597 NR NR NR NR NR NR NR NR NR NR NR NR 2.7% 2.6% 6.2% 3.8%
II. Neoplasms (C00–D48) Bladder cancerAUT BUL HRV CZE HUN POL ROU SVK SVN
Leal et al. [59]2012NRNRPublicly available sources and claims data were combined
12,988 2320 6035 7266 4545 6757 3812 8677 16,479 7965 1090 2520 4511 2748 3466 1750 6143 8050
NR
3292 912 2725 1935 1061 2333 1548 1749 6398 30.9% 32.7% 51.1% 40.1% 36.1% 55.8% 39.7% 55.6% 78.5%
Breast cancerHUNInotai et al. [41]2012127,512NRRetrospective claims data1622NRNRNR12.9% Cervical cancerPOLDubas-Jakóbczyk et al. [88]2012NRSocietalPublicly available sources and social insurance data were combined
NRNRNR8457,898fNA Colorectal cancerHUNInotai et al. [41]2012118,235NRRetrospective claims data2010NRNRNR16.0% Lung cancerHUNInotai et al. [41]2012126,731NRRetrospective claims data2663NRNRNR21.1% Prostate cancerHUNInotai et al. [41] Brodszky et al. [40]2012 2005
56,382 17,642 Payer PayerRetrospective claims data Retrospective follow-up cohort of claims data, follow-up = 8 years 1656 12,072 NR NR NR NR NR NR 13.1% 95.8%
Skin melanomaHRVBencina et al. [71]2011NRPayerModellingStage 0: 104–stage 4: 4610
NRNRNR1.0-39.1% VI. Diseases of the nervous system (G00–G99) Alzheimer’s diseaseCZEMaresova et al. [73]2014NRNRPublicly available sources and claims data were combinedNR13,208NR73.0%
Table 2 (continued) DiseaseCountryStudyCost- ing year
Sample sizePerspectiveResource use data sourceEUR/patient/year converted to € 2017Total cost as
% of GDP/ capit
aTotal costsDirect medi- calDirect non- medicalIndirect costs Dementia
HUN CZE
Érsek et al. [35]. Holmerová et al. [36]
2008 2014 88 119 Societal NRCross-sectional self-com- pleted questionnaire Cross-sectional self-com- pleted questionnaire 671 2013
b222387
63 1769
b
5.3% 11.1%
238b EpilepsyHUNPéntek et al. [83]2009100SocietalCross-sectional self-com- pleted questionnaire2650885465130021% Multiple scle- rosisAUT CZE HUN POL
Kobelt et al. [24] Dusankova et al. [23] Péntek et al. [30] Szmurlo et al. [25]
2005 2007 2009 2012 1019 909 68 NR
Societal Societal Societal Societal
Cross-sectional self-com- pleted questionnaire Prospective cohort, follow- up = 3 ms Cross-sectional self-com- pleted questionnaire Extrapolation from other country
50,599 14,777 13,115 12,343 21,788 7581 8744 5805 10,109 550 1576 510 18,399 6646 2696 6028 120.5% 81.6% 104.1% 102.0%
Parkinson’s diseaseAUT CZE HUN
Campenhausen et al. [33] Winter et al. [34] Tamás et al. [85]
2008 2004 2009 81 100 110
Societal Societal Societal
Cross-sectional self-com- pleted questionnaire Cross-sectional self-com- pleted questionnaire Cross-sectional self-com- pleted questionnaire 22,984 6970 7257 13,833 4238 9151 2733 2534 30.9% 38.5% 57.6%
25862136 IX. Diseases of the circulatory system (I00–I99) Acute myocar- dial infarctionHUNGulácsi et al. [80].2003996SocietalClaims dataNRNRNR9477.5% Chronic heart failurePOLCzech et al. [92]2010400
Public pa yerInterview-based prospec- tive cohort, follow-up period = 4 weeks
1991NRNRNR16.5% Coronary artery diseasePOLJaworski et al. [89]20052593NRCross-sectional self-com- pleted questionnaire28511365NR148623.6% Subarachnoide bleedingBULGeorgieva et al. [18]a201461HospitalProspective cohortNR3685NRNR51.9% X. Diseases of the respiratory system (J00–J99) Bronchial AsthmaBULIvanova et al. [20]a2014112Hospital costRetrospective chart review200–393c200–393cNRNR2.8-5.5% COPD
BUL ROKyuchukov et al. aU[21] Stâmbu et al. [37] NR 2006 84 85
Hospital
and patient NR Prospective cohort Interview data 1839 2103 898 2103 NR NR NR NR 25.9% 21.9%
Lower res- piratory tract infection
BULGlogovska et al. [19]aNR1441 ambula- tory + 353 hospitalized Health systemNRNR1218NRNR17.2%
Table 2 (continued) DiseaseCountryStudyCost- ing year
Sample sizePerspectiveResource use data sourceEUR/patient/year converted to € 2017Total cost as
% of GDP/ capit
aTotal costsDirect medi- calDirect non- medicalIndirect costs Pneumonia
CZE HUN POL SVK
Tichopad et al. [76]2010
258 NR 198 315
NRClaims dataAg
es 50–64/>
65
1194/786 1009/686 714/472 1685/1111
Ages 50–64/age > 65
708/786 686/686 472/472 1190/1111
Ages:50- 64/> 65
486/0 323/0 242/0 495/0 6.6%/4.3% 8.0%/5.4% 5.9%/3.9% 10.8%/7.1%
Streptococcus pneumoniaeROUStoicescu et al. [93]200448,200 Public pa
yerClaims data8.3 million8.3 millionNRNRNA XIII. Diseases of the musculoskeletal system and connective tissue (M00.0–M99.9) Chronic non- specific back pain
AUTWagner et al. [64]a200848 Public pa
yerRetrospective self-com- pleted questionnaire21481687461NR5.1% OsteoporosisSVN AUTDzajkovska et al. [94] Dimai et al. [62]
2003 2008 NR 441/popula
- tion-based
Societal NRPublicly available sources and claims data were combined Publicl
y available sources and retrospective self- completed questionnaire were combined
34,524,727d 827,849,562d24,432,069d 520,419,423d 1
10,092,657d 307,430,139d
NA NA
Osteoarthritis of hip and kneeAUTWagner et al. [63]2008174 Public pa
yerRetrospective self-com- pleted questionnaire321113421869NR7.6% Rheumatoid arthritis
CZE HUN Klimes et al. [72] Péntek et al. [86]
2014 2004 261 255 Societal NRCross-sectional self-com- pleted questionnaire Cross-sectional self-com- pleted questionnaire 9176 5536
7442
1733 3034 50.7% 43.9%
1524978 Systemic lupus erythematosusPOLKawalec et al. [90]20121600NRClaims dataNRNRNR136311.2% Systemic scle- rosis
POL HUN HUN
Kawalec et al. [90] Lopez Basida et al. [28] Minier et al. [82]
2012 2012 2006 500 38 80 NR Socie
tal Societal
Claims data Cross-sectional self-com- pleted questionnaire Cross-sectional self-com- pleted questionnaire
NR 4822 13,769 NR 1272 4724 NR 1184 1330 3394 2366 7716 28.0% 38.3% 109.3%
IV. Endocrine, nutritional and metabolic diseases (E00–E90) Diabetes
BUL POL HUN SVN
Valov et al. [32] Lesniowska et al. [91] Brodszky et al. [78] Nerat et al. [31]
2011 2009 2003 2011 433 NR 480 NR
Payer Societal
NR Payer
Retrospective and prospec- tive cohort, follow- up = 6 ms Claims data Cross-sectional self-com- pleted questionnaire Publicly available sources
472 659 2514 NR NR 287 1309 882 NR 152 1118 NR 6.6% 5.4% 20.0% 4.2%
Table 2 (continued) DiseaseCountryStudyCost- ing year
Sample sizePerspectiveResource use data sourceEUR/patient/year converted to € 2017Total cost as
% of GDP/ capit
aTotal costsDirect medi- calDirect non- medicalIndirect costs Hypoglycaemia
HUN BUL HRV CZE POL SVN
Jakubczyk et al. [27]
2013 2014 2012 2011 NR 2011
NR
Public pa
yer/ societal
Modelling
9.8 5.4 7.5 10.9 11.3 17.7 7.2 4.7 6.7 9.2 9.5 15.2 2.6 0.7 0.8 1.7 1.8 2.5 0.1% 0.1% 0.1% 0.1% 0.1% 0.1%
Other top level ICD items including < 2 disease Benign prostatic hyperplasiaHUNRencz et al. [84]2014246SocietalCross-sectional self-com- pleted questionnaire9024172752107.2% EndometriosisAUTPrast et al. [60]200973Healthcare systemCross-sectional self-com- pleted questionnaire89456501244321.3% Gastro-oesoph- ageal reflux disease AUTWillich et al. [61]20005273NRProspective cohort, follow- up = 4 yrs527471551.3% Gestational diabetesBULTodorova et al. [22]2002- 2005
195Healthcare systemCross-sectional self-com- pleted questionnaire32,26332,263NRNR454% PsoriasisHUNBalogh et al. [77]2013200SocietalCross-sectional self-com- pleted questionnaire95247816152129275.6% Psoriatic arthritisHUNBrodszky et al. [78]2007183SocietalCross-sectional self-com- pleted questionnaire739524891053385358.7% SarcoidosisPOLKawalec et al. [90]20122700NRClaims dataNRNRNR11149.2% SchizophreniaHUNPéntek et al. [26]200978SocietalCross-sectional self-com- pleted questionnaire15,187433481910,034120.5% Rare diseases Cystic fibrosis
BUL CZE HUN BUL
Iskrov et al. [70] Mlcoch et al. [74] Chevreul et al. [68] Chevreul et al. [68]
2012 2010 2012 2012 33 330 110 33
Societal
NR Socie
tal Societal
Cross-sectional self-com- pleted questionnaire Retrospective registry analysis Cross-sectional self-com- pleted questionnaire Cross-sectional self-com- pleted questionnaire
23,570b
16,118 22,121 21,759
18,551b
16,118 20,393 21,176
0b NR 3802 1068
332.0% 89.0% 175.6% 306.5%
Duchenne
muscular dystrophy
HUN BUL
Cavazza et al. [67]2012
57 14 SocietalCross-sectional self-com- pleted questionnaire 15,952 6500 15,094 2289 712 4211
145 0 126.6% 91.5%
Epidermolysis bullosa
BUL HUN
Angelis et al. [96]2012
8 6 SocietalCross-sectional self-com- pleted questionnaire 17,246 10,262 3503 438 13,485 9823 259 0 242.9% 81.4%
![Table 1 Characteristics of cost-of-illness studies CharacteristicNumber of country-specific results: N = 83; Number of papers: N = 581Totala Austria [24, 33, 58–64]Bulgaria [18–22, 27–29, 32, 59, 65–70]Croatia [27, 59, 71]Czech Republic [23, 27, 34, 36](https://thumb-eu.123doks.com/thumbv2/9dokorg/910766.51019/4.892.99.751.82.1082/characteristics-illness-characteristicnumber-specific-austria-bulgaria-croatia-republic.webp)