Automated Recovery and Visualization of Test-to-Code Traceability (TCT) Links:
An Evaluation
NADERA ALJAWABRAH1, TAMÁS GERGELY1, SANJAY MISRA 2,3, (Senior Member, IEEE), AND LUIS FERNANDEZ-SANZ4
1Department of Software Engineering, University of Szeged, 6720 Szeged, Hungary 2Department of Computer Engineering, Atilim University, 06830 Ankara, Turkey
3Department of Electrical and Information Engineering, Covenant University, Ota 112233, Nigeria 4Department of Computer Science, University of Alcalá, 28801 Madrid, Spain
Corresponding author: Sanjay Misra (sanjay.misra@covenantuniversity.edu.ng)
This work was supported in part by the Ministry of Innovation and the National Research, Development and Innovation Office within the framework of the Artificial Intelligence National Laboratory Programme, and in part by the University of Szeged Open Access Fund, Grant No. 5237. The work of Nadera Aljawabrah and Tamás Gergely was supported by the University of Szeged, Hungary. The work of Sanjay Misra was supported by CUCRID, Covenant University, Ota, Nigeria.
ABSTRACT In the software development process, traceability links between unit tests and code are not explicitly maintained, and dependencies in most cases are manually identified. As a result, a large amount of effort and time is required during the comprehension process to establish the links between these artifacts.
Although there are several methods that can infer such links based on different phenomenons, these methods usually produce different set of traceability links. This work expands upon previous traceability link recovery and visualization studies by implementing a combination of traceability recovery methods that automatically retrieve the links, and visualizing them to help developers to overview the links inferred by various recovery techniques, and also to select the right relations for analyses. The results of the usability study show that the visualization model presented herein can effectively support browsing, comprehension, and maintenance of Test-to Code Traceability (TCT) links in a system with enhanced efficiency, as well as visualization of TCT links from multiple sources is better than a visualization of single source of traceability links.
INDEX TERMS Software development, software comprehension, test case, traceability links, visualization.
I. INTRODUCTION
System source code constitutes the main development artifact in agile development; meanwhile, unit tests, code and user stories are usually the artifacts produced during the agile development process itself. As such, creating and visualizing the links between code classes and unit tests can be helpful during software development processes in a number of tasks such as in program comprehension, impact analysis, mainte- nance, and artifact reuse.
Several approaches have been explored to extract the links between test and code [21]. While traceability recovery approaches can be automated, none of them is itself accurate.
On the other hand, manual recovery is a complex, error- prone, and time-consuming task. As a result, a combination of TCT links recovery methods is recently used to improve the quality of the retrieved links [30], [31], [16], [17], [21], [25].
However, the unsolved issue remains is how to efficiently support the comprehension, browsing, and maintenance of
The associate editor coordinating the review of this manuscript and approving it for publication was Fabrizio Messina .
the retrieved links. It is commonly recognised that visual- ization is an efficient method to represent these links in an intuitive and natural way. It effectively supports under- standing test-to-code relations and helps various tasks in the software development life cycle (SDLC) [19]. Though, only a small set of research studies have focused on the importance of visualization of TCT links in comprehension, evolution, refactoring, and maintenance task of a software system.
Previous studies [10], [13], [24] documented traceabil- ity links visualization among different artifacts in software (e.g. source codes, requirements, documents, test cases, etc.).
Recently, a variety of traceability tools were built, provid- ing different views to depict relationships between software artifacts. In [33], for example, a tool is presented to support the establishment and visualization of traceability links in DevOps environments by combining the development level and operational level artifacts of software (source code, requirement, design, and unit test). Different visualization methods are applied by other tools to display traceability links between software artifacts [4], [13]. Several visualiza- tion formats are supported in D3TraceView [4], sunburst,
tree, matrix, list, table, bar, gauge, and radial view. Marcus et al.has shown the importance of visualization in recover- ing, maintaining, and browsing the traceability links between software artifacts [12]. However, to date, no visualization tool seems to exist that focuses on the visualization of TCT traceability links that are recovered from multiple sources.
In this work, our particular focus is on the traceability links between test cases and the related production classes.
The objective of our work is to provide testers with an effi- cient visualization that enables them to understand, brows, and maintain TCT links. We have developed an innovative approach for TCT links’ visualization that combines vari- ous automated test-to-code recovery approaches and supports effective visualization technique.
TCTracVis [1] was a prototype developed with limited fea- tures. The aim of the prototype was to visualize traceability links between test cases and code classes that were manually recovered. In the present work, we have added more func- tionalities that support the automated recovery approaches and the simultaneous visualizations of test and code relations.
The current version of TCTracVis combines different TCT recovery approaches to automatically establish the links between test cases and its classes/methods which, in turn, reduces the effort of manual recovering traceability links.
We further enhanced support for these approaches with a traceability visualization technique to allow visualizing the overall structure of traces and a thorough description of each trace. The visualization will aid the developer and tester to make their decision whether the links are true and which are false positives. We adopted a hierarchical tree-view technique to achieve these goals.
The main idea of using the traceability recovery approaches is to help software engineers to trace the relation- ships between unit test and source code, and automatically extract traceability links at low cost and time, while using visualization aims to identify the disagreement in traceability links inferred from different sources [26]. Besides, visualiza- tion can help to reveal if there has been something wrong with the tests and/or the code (at least their relationship) in a particular system. Our contributions to this exploratory work are the following:
1) Build an informative and generic visualization tool that combines multiple automated sources of traceability links and improves program comprehension, browsing, and maintenance.
2) Examine the tool usability and assessing users’ interest.
3) Display the hierarchical relationships of source code and units test inferred from different sources for better system evolution analysis.
The experimental study is conducted to evaluate the use- fulness and efficiency of our traceability visualization approach. The results of this evaluation show that the visu- alization of traceability link inferred from different sources is more efficient and helpful than using a single source, and our tool can efficiently and effectively support the software
engineers to understand, browse, and maintain the test and code relations in a software system.
The remainder of the article is organized as follows:
Section II discusses the related work, Section III describes our traceability visualization approach, and the architecture of TCTracVis is described in Section IV. The evaluation results are presented in Section V. Section VI presents the threats to the validity of the technique. We draw a conclusion and future work in Section VII.
II. RELATED WORK
In the following subsections, we analyze some of the existing techniques used for TCT links recovery, and we also intro- duce some of the visualization techniques usually used to display the links between software artifacts.
A. TRACEABILITY LINK RECOVERY TECHNIQUES
Only a few specific sets of automated traceability recovery approaches have been proposed that are viable means to display links between production classes and test units. In the most often utilized and discussed work initially proposed by Rompaey and Demeyer [21]; the authors suggested six traceability recovery strategies as sources to extract the links between unit tests and source code, naming conventions, fixture element types, latent semantic indexing (LSI), static call graph, last call before assert and co-evolution. In naming convention [21], [17] traceability links are established if a unit test contains the name of a tested class after remov- ing the word ‘‘Test’’ from the name of a class executing the test case. Naming conventions have been described in several books and tutorials (e.g. [21], [17]) which is an indication of their widespread usage in different contexts.
In this approach, traceability links could not be established if unit tests do not contain the names of the tested classes.
In static call graph (SCG) [17], [21], units under test can be derived by collecting all classes under test that is directly invoked in the test case implementation, and thereafter the most frequently referenced classes are selected. In case there are no dominant production classes, the selected sets would contain a possibly large range of data object and helper types that will, in turn, impact the precision of the retrieved links. To mitigate the drawback in SCG, authors in [21]
proposed the Last Call Before Assert (LCBA) method, which derives test classes by checking the last call invoked right before asserting statements. However, if developers write many assert statements per test unit, many units under test could be retrieved. This problem is referred to as ‘‘Assertion Roulette’’ [3]. The traceability links can be established in the lexical analyses (LA) approach [17], [21] depending on the textual similarity between test cases and the corresponding unit under test, whereas in co-evolution (CV), the starting point of the approach is the Version Control System (VCS) of the software such as CVS, SVN, SourceSafe, or Perforce.
This approach requires that changes to code under test and unit tests are simultaneously fetched into the system. Also,
developers need to practice testing during development; oth- erwise the co-evolution information is not captured in VCS.
TCTracer is an approach that uses a variety of new and traditional TCT recovery techniques [31]. The techniques were combined and applied to both method level and class level. The evaluation results showed that the combination of recovery techniques is more effective than using a single technique. In our approach, we provide visualization support to the combination of recovery techniques to enhance the comprehension of the TCT link.
TCT using slicing and conceptual coupling (SCOTCH) has been proposed in [16]. Herein, traceability links are recovered using dynamic slicing and conceptual coupling techniques.
TCT links are derived using assert statements, then, tested classes are identified in two steps: the first step identifies the started tested sets (STS) using dynamic slicing. In the second step the candidate tested set (CTS) are produced by filtering STS using conceptual coupling between identified classes and the unit test. This approach, however, does not consider the semantics of STS during the coupling conceptual pro- cess [15]. Also, the candidate tested classes identified by dynamic slicing still contain an overestimate of the tested classes [15]. The study findings of using these approaches are unsatisfactory as a result of the low accuracy and manual effort needed by a domain expert to establish the retrieved links [15], [17], [21]. Gergely et al.[29] did not explicitly extract the traceability links of test and code, but they used clustering instead. The clustering is performed with static analysis and dynamic analysis.
Previous research has studied how to use gamifica- tion to enhance the manual maintenance of traceability links [27], [28], however, these studies have not seen any significant concern.
In this work, we combine three of the above techniques, namely: NC, LCBA, and SCG. The reason behinds using these techniques that NC had a high precision [21], [31], LCBA provided a better score of applicability as a result of comparing six traceability recovery approaches [21], while SCG is used to identify the intended class under test by connecting each test with the methods list that may be called by the test [14]. This can help in identifying an error location in a failed test case.
B. TRACEABILITY LINKS VISUALIZATION TECHNIQUES In recent years, research on visualization of traceability links has become very popular. A lot of work has been dedicated to exploiting visualization techniques in terms of matrix, hyperlinks, lists, and graphs due to contexts to help users analyze and understand the traceability information.
1) TRADITIONAL TECHNIQUES
Graph-based visualization. Traceability visualization sys- tems commonly use a graph visualization method as it allows an overview of traceability links between various artifacts in software [32]. In graphs, artifacts are represented as nodes, while edges are represented as relationships between nodes.
Four well-known visualization techniques [matrix, graphs, lists, and hyperlinks] were analyzed and compared in [8] to discover in which context these visualization methods can be properly used. The study demonstrated management tasks are better represented by graphs. A tool, developed by Kamala- balan and Uruththirakodeeswaranet al.[7], traces software artifacts links and displays these link elements as a graph.
A specific graph-based approach called Chain-Graph has been proposed to visualize relationships between require- ments [5]. Another type of graphical representation is Sun- burst [13]; wherein nodes are displayed on adjacent rings representing tree views. Such a graph can show the overall hierarchical structure [4]. Although graphs can visualize the overview of links between artifacts, it is a big challenge to display a large number of traceability links between software artifacts because of scalability issues. As such, the presenta- tion of large sets of data becomes unreadable or difficult to understand.
Matrix-based visualization. A two-dimensional represen- tation in the form of a table is commonly used to visualize software artifacts relationships. It is commonly used in visu- alizing requirement traceability links with other artifacts [32].
Several tools have been presented to support the matrix visu- alization method [24], [4]. Di Thommazoet al.proposed two approaches to automate the generation of the requirement matrix [24]. In this work, visualization of traceability infor- mation using the Requirements Traceability Matrix (RTM) helps in determining requirements dependencies in an effec- tive way. Typically, matrices are selected to visualize a small volume of traceability information. As presented by Li and Maalej [8], the matrix is also appropriate to help in manage- ment tasks. However, due to visual clutter issues, it becomes indecipherable when the set of artifacts gets larger [18].
Visualization by hyperlinks and lists. Traceability links can also be presented as hyperlinks and lists. Hyperlinks are pre- sented to users in tabular format using natural language [20].
This method of visualization allows users to navigate between related artifacts along with the link. Several approaches have proposed hyperlinks as a method for representing traceability information [6], [11]. In testing and implementation activi- ties, hyperlinks are desired over lists [8]. Lists are the least picked methods among other traditional approaches for repre- sentation traceability links [8]. All the information related to each traceability link is presented in list view (source artifacts, target artifacts). Previous work has shown that, just as the techniques above, hyperlinks and lists do not scale well for large data [9], [23].
2) OTHER TECHNIQUES
There are further approaches have been proposed to visualize traceability links. The OrganicViz tool [22] applies a network visualization that shows traceability information evolution in engineering projects. Marcuset al.[12] proposed Traviz, a prototype tool that visualizes traceability links using col- ored and labeled boxes. Traviz supports browsing, recov- ery, and maintaining traceability links of software artifacts.
Multi-Visio Trace [18] hires various approaches of visu- alization involving, graph, matrix, sunburst, and tree view enabling selection of the appropriate view for information depending on the task to be performed. Chenet al.[2] inte- grated two visualization techniques: Treemaps and Hierar- chical Trees to support a through an overview of traceability and provide a detailed overview of each trace. Despite all the techniques above, representing a large set of information is still a big challenge.
There is not much interest in the literature being reviewed in visualizing TCT links, as works on the visualization of test- ing are still practically limited. Developers usually concen- trate more on the development process and activities which are responsible for testing activities. Recently, in more impor- tant projects, developers cannot miss testing. However, they omit traceability because, during the development process, they do not feel the need for it. Therefore, they do not spend effort on it. Moreover, despite the importance of TCT links in practice [19], it is not commonly used, and its scope is highly disregarded in software development. This research is based on these foundations.
III. THE PROPOSED APPROACH
We have developed TCTracVis [1], a traceability visualiza- tion tool, to support the developers to recover, visualize, and understand the TCT links in an efficient way. The tool is developed to recover and show traceability links between test cases and source code. Since it is a difficult task to determine which classes/methods are tested in test cases in a large program, this tool can help to provide significant help for the developers in understanding these relations. We present our traceability recovery techniques and describe the traceability visualization method in the following.
A. TCT LINK RECOVERY
In [1], we presented a prototype of a tool that supports visual- ization of traceability links retrieved using class invocations in test cases. In this paper, we include additional recovery techniques that can automatically establish TCT links.
1) TRACEABILITY LINK RECOVERY USING NC
As mentioned in the related work section, naming conven- tions retrieve links between test cases and units under test by matching the names of unit tests and production classes. The reason behinds using this approach that it performs well in several situations [17], [21].
In addition to NC, we adopt a derivative of the traditional naming convention, namely Naming Convention-Contains (NCC) [31], which replaces the condition that the name of the test unit must exactly match the name of the tested code (e.g.
‘‘Prog’’ -> ‘‘testProg’’ or ‘‘ProgTest’’), with the more flexible condition that the name of the test unit contains the name of the tested code (e.g. ‘‘Prog’’ ->‘‘testProgVariant1’’ or ‘‘Func- tionalityofProgTest’’). Therefore, the tested class is linked to the test class if the name of the test class includes the name of the tested class after removing the term test form test class.
NCC uses NC’s strengths. It establishes N:1 relationships between classes and tests (i.e. many test cases are written to test a production class) as opposed to 1:1 relationships with NC. This approach can perform better if the project does not follow the traditional naming conventions.
link(nt,nc)=
(true, if ncis substring ofnt
false, otherwise (1)
wherentis the name of a test unit andncis the name of a tested code. In the case that the name of a test unit does not exactly match the name of tested code, or it is not a substring of the name of a tested code, then the link (if exists) can not be established by NC or NCC. Thus, other approaches can be used.
2) TRACEABILITY LINKS RECOVERY USING SCG
Static call graph works by inspecting calls of the production class in the implemented test unit. The production class that is referred to most is the most likely to be the unit under test.
In our approach, we search for method invocations in a test method and return the most frequently invoked production class and how many times it is called in each test method.
3) TRACEABILITY LINKS RECOVERY USING LCBA
As a result of comparing six traceability recovery approaches [21], LCBA provides a higher accuracy score in terms of applicability. LCBA attempts to separate helper classes from test classes by capturing the calls of tested classes that were invoked right before asserting statements.
In our approach, the statements in each test method are analyzed and searched for productions classes and methods called by a test method, and then the test method is linked to the production class if it is the last return before an assert statement.
link(tm,pc)
=
(true, if pcis last return before assert intm
false, otherwise (2)
wheretmis the test method, andpcis the production class (i.e. a class under test).
Although the majority of the techniques were performed manually (from scratch), the methods listed in the related work are all able to be automatable.
Still, the issue is that using a single source is not reli- able. As such, our tool supports the combination of more sources/methods to infer test-to-code relations and visualizes them in a way that helps the developer to compare these links and decide which ones to treat as valid.
B. VISUALIZATION OF TCT LINKS
TCTracVis has been developed as a visualization tool that can efficiently offer visualization of relationships between unit tests and test classes/methods. Our goal is to support users to present, navigate, and understand TCT links.
FIGURE 1. Code-to-test dependency graph.
We utilize the hierarchy tree graph to visually represent a thorough overview of traceability links between a node and its related nodes wherein a node can be a production class, method, or test class/method. Once the traceability links of a selected node are established and retrieved, a hierarchical tree graph is built to show links of nodes are linked to the selected node. In our approach, we employ a left-to-right hierarchy tree visualization technique which represents 1:N and/or N:1 relationships. In other words, a single test can evaluate more classes, and more tests can evaluate the same class, resulting in an N:M relation.
As the traceability links have the advantages of being bidirectional, traceability links can be shown in two types of graphs:
1) Code-to-test dependency graph, which shows the traceability links for a specified production class that is inspected by more test classes. In Figure 1, EmployeeClassclass is tested by three tested classes, Employee-GetTest,Employee-SalaryTest, andEmploy- eeClassTest.
2) Test-to-code-based graph, which shows the traceability links for a specified test class with its related tested class and tested methods. For example, in Figure 2, SubtractsClassTest test class has three tested meth- ods which are written to evaluate several methods in DeductionClassclass.
IV. ARCHITECTURE AND DESIGN PRINCIPLES OF TCTrasVis
TCTracVis has been built as a stand-alone desktop applica- tion for MS Windows. It automatically recovers traceability links between unit tests and tested code in a project utiliz- ing three different recovery techniques, and visualizes these links using hierarchy tree graph visualization techniques.
Currently, the tool is designed to find traceability data of the source code created in C# code using Microsoft unit tests. It supports multiple traceability recovery sources to
FIGURE 2. SubtractsClassTestTest class’s traceability links.
FIGURE 3. Architecture of TCTracVis.
extract TCT links; Figure 3 illustrates the architecture of this traceability visualization tool.
The tool requires a solution file as an input. As the tool is designed to find the traceability between source code and test cases of any program, the solution file holds the information about all the projects used in the source program. In the first
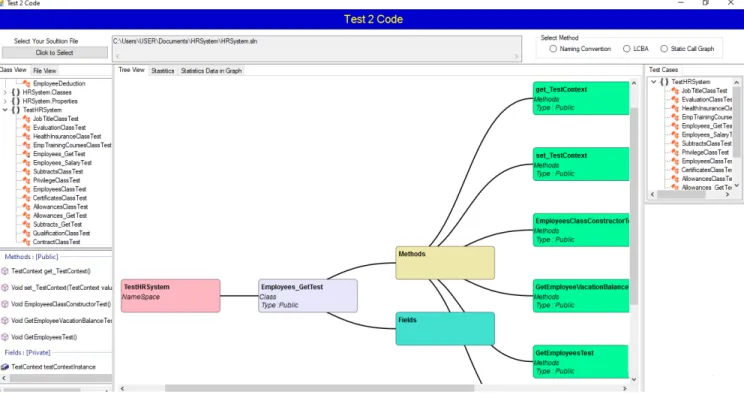
FIGURE 4. TCTracVis user interface.
TABLE 1. Solutions characteristics. This table shows metrics of the C#
projects used in the implementation and evaluation of TCTracVis.
step, the tool reads the solution file and finds the project files (source code and unit test).
Next, the tool searches for C# source code files and test case files. In this step, the tool also finds the path of the assemblies which would be read in the next stage. Then, the tool finds the assemblies and reads them, basically, it reads two assemblies: (1) The assembly created by the source code (name spaces and classes) (2) the assembly created in test cases. Namespaces, classes, and methods are loaded into visualization generator which shows the hierarchy of classes and name spaces using a hierarchical tree visualization tech- nique. Test cases are passed to the traceability recovery mechanism which includes three approaches to retrieve links between test cases and the related production classes. The retrieved links are then passed to the visualization generator and displayed using hierarchical trees. The tool also provides some metrics about the traced solution, which are visualized using bar charts.
A. USAGE EXAMPLES
Figure 4 shows the user interface of TCTracVis tool. Classes and test cases of two solutions written in C# are used in
the experiment, HRsystem,1 which is a human resources information system developed by ITG2with enough unit tests for implementation and evaluation purposes; and UnitTes- tExample3; which is an open-source Windows forms appli- cation that is served by several small classes that are used in unit testing. Table 1 shows the characteristics of the two C# solutions. The table displays how many lines of code are in each system, the number of production classes, number of methods, number of test classes and test methods which written to test the production classes and methods.
Once the tool reads the solution file, all files of a project (i.e. production classes, base methods, and unit tests) will be displayed on the right part of the screen (see figure 4).
In a class view, a double click on a class shows a hierarchy tree graph for a selected class and all its related methods and fields. When a user right-clicks on the class item in the Class View, a popup menu appears as ‘‘Base Class to TestCase Dependency’’. When the popup menu is clicked, a tree-view appears in the ‘‘Tree View’’ panel showing the dependency graph for the selected base class (i.e. test classes that call the selected class). In test case view, a user can ini- tially select one traceability recovery approach (e.g. LCBA), a double click on the test case shows the details in the ‘‘Tree View’’ panel as a hierarchy tree graph. A click on a test class in a hierarchy tree graph expands it to show subsequent items related to a selected test class (i.e. base classes and test methods).
1https://github.com/rayyad79/HRSystem.git
2Integrated Technology Group (ITG) https://www.itgsolutions.com/
3https://github.com/situ-pati/UnitTestExample
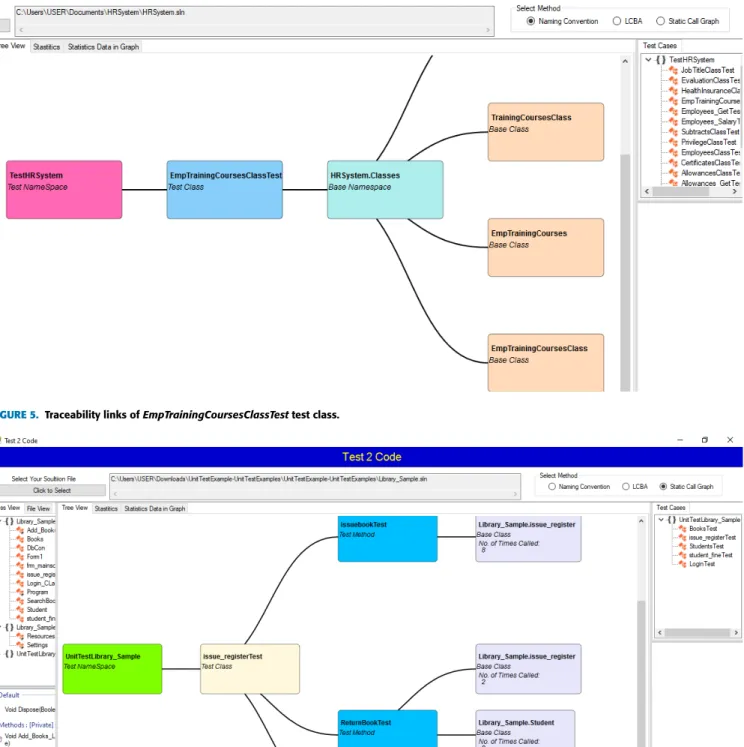
FIGURE 5. Traceability links ofEmpTrainingCoursesClassTesttest class.
FIGURE 6. Traceability links ofissue-registerTestusing SCG.
Figures 5, 6, and 7 show examples of the visualiza- tion of TCT links for the ‘‘issue-registerTest’’ test case using NC/NCC, SCG, and LCBA, respectively. In Figure 5, EmpTrainingCoursesClassTest test class is connected to a
number of tested classes whose names are matched the test class’ name (e.g. EmpTrainingCoursesClassclass) or they are substring of its name (e.g. TrainingCoursesClass and EmpTrainingCoursesclasses). As we mentioned before, if the
FIGURE 7. Traceability links ofissue-registerTestusing LCBA.
name of a tested class does not match the name of a test class or it’s not a substring of the name, the link cannot be established by using NC or NCC methods. Furthermore, if a link is found by NC/NCC, the other approaches can still be used to validate or invalidate this link.
The SCG strategy is used in Figure 6 to establish the links of the issue-registerTest test class. The visualization shows the production classes that are invoked most in the implementation of the test class and the number of times called in each test method. Finally, Figure 7 provides a visu- alization of the traceability links of issue-registerTesttest class using the LCBA strategy. The figure shows a set of tested classes which are called byissue-registerTesttest class in the statements performed right before asserting statements inissuebookTesttest method. It can be clearly observed that the test class has several test methods where each method test is written to check one or more methods under test.
Moreover, in each node of the tested method, the name of the tested class which includes the tested method can be shown.
As shown in Figures 5, 6, and 7, the links between code classes, methods, and unit tests from different sources are displayed which, in turn, provide a clearer picture of what is taking place within these tests. Furthermore, a hierarchical tree view presents a detailed overview of method-level trace- ability links.
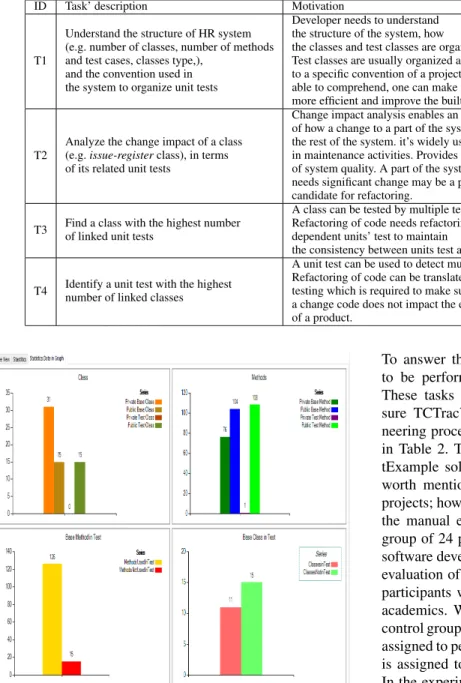
Further features in TCTracVis include some metrics about the traced solution (e.g. no. of base classes, no. of test classes, no. of classes not tested) (see Figure 8). These information are visualized using barcharts (see Figure 9). The metrics provide
FIGURE 8. Statistics data of HRsystem.
a quick overview of artifacts of the traced solution, which can help to better extract valuable information with less effort.
For example, one can reveal classes of the code which are not exercised by a set of test cases. This insight enhances the improvement of testing by creating new test cases for the untested classes (i.e. creating more links) which, in turn, improving the quality of the code, increasing code coverage, facilitating maintenance, and reducing costs.
TABLE 2. Evaluation tasks.
FIGURE 9. Statistics data of HRsystem in a graph view.
V. EVALUATION
The main target of this experiment is to develop an under- standing of the effectiveness and usability of our visualization traceability approach in order to justify the effort and the time spent in the design of the TCTracVis tool. We conducted a usability study to answer the following questions:
• To what extent the visualization of links from multiple sources better helps testers to find solutions for their problems than visualizing links from a single source?
• To what extent the use of the traceability visualization approach and its implementation help to enhance the overall browsing, comprehension, and maintenance of TCT links of a system?
To answer the questions above, we defined a set of tasks to be performed using our traceability visualization tool.
These tasks have also been performed manually to mea- sure TCTracVis added value to traditional software engi- neering processes in manual tracing. These tasks are shown in Table 2. The solution used in this study is the UnitTes- tExample solution mentioned in the previous section. It is worth mentioning that our tool is robust to support large projects; however, we selected the UnitTestExample to make the manual evaluation much easier for the participants. A group of 24 participants, with varying levels of expertise in software development and unit testing, were assigned for the evaluation of our tool and performing the tasks. Among the participants were 17 students, 3 from industry, and 4 from academics. We divided the participants into two groups: a control group and an experimental group. The former group is assigned to perform the tasks manually, while the latter group is assigned to perform the tasks using the TCTracVis tool.
In the experimental group, the participants were 8 students, 2 academics, and 2 participants from industry. While the con- trol group had 9 students, 2 academics, and 1 participant from industry. Among 24 participants, 5 had more than 10 years of development experience, 6 had fewer than 10 years but more than 5 years, and 9 had an experience between 2-5 years, and 4 had less than 2 years. In the beginning, we provided the participants with a brief introduction to help them to get familiar with our approach and tasks. After the tasks’
completion, a set of questions on our tool have been answered by the participants.
During the execution of the tasks, we recorded the time needed and the number of steps performed to complete each task in each group as illustrated in Figures 10 and 11, respec- tively. It is to be noted that the time factor of the evaluation process was managed by using a stopwatch, as the time needed to understand the tasks was taken into consideration.
FIGURE 10. Average time to complete tasks.
FIGURE 11. Number of steps to perform the tasks.
As shown in Figure 10, the average time to complete all tasks using our tool varying from 5 minutes to 10 minutes.
While the same tasks were completed manually 35 minutes on average. The time varies depending on the participants’
experience in software development. For the experimental group, it also depends on how frequently they use traceability tools.
7 of the 12 participants in the experimental group com- pleted the first task in less than 5 minutes, 3 spent 8 minutes, and 2 participants took 10 minutes to complete the task. As we observed, the participants who spent 8 and 10 minutes prac- ticed a little to get familiar with the tool before carrying out the four tasks. The participants managed to easily understand how the system is structured by using the ‘‘statistics’’ infor- mation and charts. Moreover, they easily defined the specific conventions used to organize the unit tests by browsing the
‘‘class view’’ and looking at the NC approach. In contrast, in the control group, the participants spent around one hour to complete the first task.
In the second task, we asked 4 participants in the experi- mental group to use only a single link source to perform the task, they used ‘‘base code to test dependency’’. While the other participants were asked to use all sources. The moti- vation behind this is to evaluate the efficiency of visualizing traceability links inferred from multiple sources compared to a single source. In the experimental group, the second task
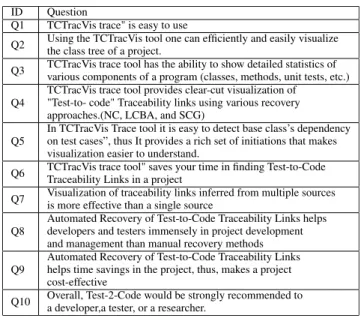
TABLE 3.Questionnaire used in the experiment.
TABLE 4.Distribution of questions over tasks. This table shows what questions were addressed in the different tasks in the evaluation.
was performed with times varying from 1 to 3 minutes, as the participants became more familiar with our tool, whereas, in the control group, the participants took 48 minutes on aver- age to complete their task. We observed that in the manual evaluation, the participants made great efforts in analyzing the change impact of the production class and detecting its related test cases.
The third task was completed within 5 and 10 minutes by the experimental group, while the average time in the manual evaluation was 48 minutes. In the experimental group, the participants easily found a class in a ‘‘class view’’ and identified the number of its linked test cases using ‘‘base class-to-test case dependency’’ graph in the tool. This took around 1 minute to complete for a single class. On the other hand, in the control group, as the developer of UnitTestEx- ample followed a specific naming convention, this helped the participants to identify the test cases that linked to the classes.
Nonetheless, this task was tedious for the participants and required a great effort for being completed.
Task 4 was as hard as task 3 in the control group. The participants took 45 min on average to complete the task.
Whereas in the experimental group, this task was performed easier and faster. It was completed in around 5 minutes on average. In the latter, the participants selected the LCBA method to recover the test case links with the classes and managed to easily identify test cases, display the hierarchical tree of their links, and then identify the number of their linked classes. In Figure 11, it can be seen that the number of steps needed to perform the tasks manually is much more than the
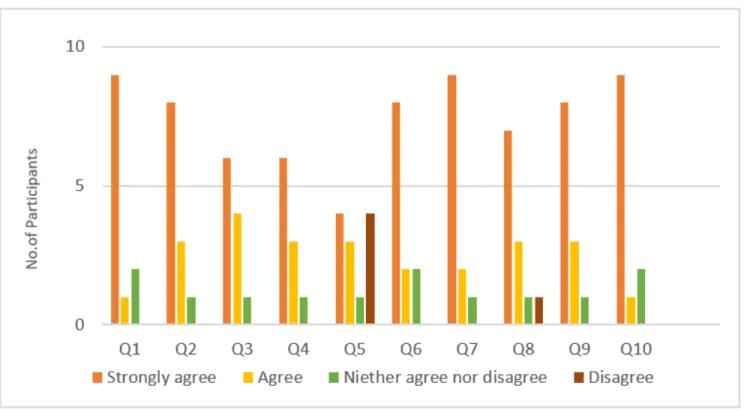
FIGURE 12. Evaluation results.
number of steps required to perform the tasks using our tool.
The participants in the control group took more steps in per- forming the four tasks compared to the experimental group.
During the manual evaluation, participants often switched between the source code files and the test cases files to read and perform the task and write down the notes.
After the evaluation, the analysis of the main outcomes performed was on several questions answered by the partic- ipants in the experimental group, based on their experience of using our tool. The ten questions are shown in Table 3.
The main purpose of the questions is to assess the tasks performed by the participants. Table 4 shows the distribution of the questions over the four tasks. Questions 1, 3, and 4 aim to assess the first task. In the first task, where the goal is to understand system and test structure, we asked questions about the usability, information content and visualization property of the tool. The second task is assessed by questions 5 and 7. The goal in this task is to determine which tests should be checked after the code changes. We asked questions about the effectiveness of combining and visualizing differ- ent recovery approaches. Questions 2 and 5 assess the third task. Questions 7 and 8 are concerned with the fourth task.
The third and fourth tasks concern defining a class with the highest number of linked unit tests and a unit test with the highest number of linked classes respectively. The questions on these tasks were on the efficiency of the visualization property of the tool and how it can support the developers and testers in project development and management. Ques- tions 9 and 10 aim to investigate the usefulness and the importance of our approach from the participants’ point of view.
The results of the evaluation questions are shown in Figure 12. The questions are shown on the x-axis, while the y-axis displays the number of participants and their responses based on the Likert scale (Strongly disagree, disagree, neither agree nor disagree, strongly agree). The most interesting result that the majority of the provided responses was pos- itive. 9 participants (strongly) agreed that the tool is easy to use, the visualization of multi-sources links is better than visualizing single source links. They highly recommended our tool to developers, testers, and researchers. 6 of them also (strongly) agreed that they could easily visualize the traced solution in an efficient way, the tool can help them to save time needed to find traceability links, and it could make a project more cost effective. Furthermore, 6 participants (strongly) agreed that the visualization of traceability links was clear, and they were able to show the statistical data of the program components easily using the tool. Several partic- ipants gave the answer ‘‘agree’’ and in each question around 1 or 2 participants answered ‘‘neither agree nor disagree’’.
4 participants (strongly) agreed that they could easily detect the base code to test dependency and 3 agreed to this ques- tion, but 4 participants answered ‘‘disagree’’. They responded that they did not figure out that they should right-click on a class to show the dependency diagram; they commented that this feature should be more prominent in the interface.
7 participants (strongly agree) that the automated recovery approaches are better than manual methods, whereas one par- ticipant answered (disagree) to this question. They justified the answer that the manual methods cannot be avoided during project development; it is often required to confirm vulnerabilities.
Overall, the results revealed that the participants strongly agreed that the visualization of traceability link inferred from different sources is more efficient and helpful than using a single source, and that, the results showed that the visualiza- tion tool can efficiently support understanding, browsing, and maintaining of TCT links in a software system.
VI. THREATS TO VALIDITY
Some threats potentially affect the validity of our evaluation results. We have exerted reasonable efforts to identify these threats and attempted to alleviate some of them.
The first threat is that only one system has been used in the usability evaluation. The main reason for using one system is manual evaluation. We mentioned before that our tool is a generic tool and supports C# solutions of varying sizes.
The second threat concerning the extent to which the results of our study can be generalized; to alleviate this threat, we introduced the tool and the problem to different partic- ipants (evaluators) with varying levels of experience. Our evaluators included students, academics, and experts from the industry who have familiarity with the necessary software development skills.
The third threat is that some of the participants were unfamiliar with the concept of traceability or visualization.
To overcome this threat, we provided the participants with a precise description of the traceability and visualization, ran a demo, and explained the tool. We allowed the participants sufficient time to understand the functionality or usability of the tool and practice visualization exercises on some sample sets of problems before presenting the real problem to solve.
VII. CONCLUSION AND FUTURE WORK
In this paper, we introduced a novel traceability visualization approach and its implementation that extends our previous work. We combined different traceability recovery methods that automatically retrieve the links, we also provide visual- ization support to these links using a hierarchical tree visu- alization technique. A usability study has been conducted to evaluate the usability and usefulness of our traceability visualization tool.
Based on our evaluation results, we observed that TCTracVis tool can provide the participants with the follow- ing features and functions:
• Directly identify a specific item in a traced program to show its related links.
• Visualize a class/method hierarchy tree of a program.
• Detect and visualize a class dependency on test cases.
• Retrieve the traceability links for a specific test case from multiple sources automatically and visualize the retrieved links in an efficient way.
• Support an overall overview of the program components by providing detailed statistics and visualization of these components.
• Save time needed in finding TCT links in a project efficiently and make the project cost-effective.
Based on the results presented in this work, there are potential areas of future work as follows:
• Visualization system can be extended to support further programming languages such as Java, C++, Python.
• Implement our approach with further TCT links recov- ery approaches.
• Extend our visualization system to include one overall overview visualization of all traceability links for the whole project which, in turn, may need to support other types of visualization techniques.
REFERENCES
[1] N. Aljawabrah and A. Qusef, ‘‘TCtracVis: Test-to-code traceability links visualization tool,’’ inProc. 2nd Int. Conf. Data Sci., E-Learn. Inf. Syst., 2019, pp. 1–4, doi:10.1145/3368691.3368735.
[2] X. Chen, J. Hosking, and J. Grundy, ‘‘Visualizing traceability links between source code and documentation,’’ in Proc. IEEE Symp. Vis.
Lang. Hum.-Centric Comput. (VL/HCC), Sep. 2012, pp. 119–126, doi:10.
1109/VLHCC.2012.6344496.
[3] A. Van Deursen, L. Moonen, A. Van Den Bergh, and G. Kok, ‘‘Refactoring test code,’’ inProc. 2nd Int. Conf. Extreme Program. Flexible Processes Softw. Eng. (XP), 2001, pp. 92–95.
[4] A. A. G. Filho and A. Zisman, ‘‘D3TraceView: A traceability visual- ization tool,’’ inProc. 29th Int. Conf. Softw. Eng. Knowl. Eng. (SEKE).
Pittsburgh, PA, USA: Wyndham Pittsburgh Univ. Center, Jul. 2017, doi:
10.18293/SEKE2017-038.
[5] P. Heim, S. Lohmann, K. Lauenroth, and J. Ziegler, ‘‘Graph-based visual- ization of requirements relationships,’’ inProc. Requirements Eng. Visual- izat., Sep. 2008, pp. 51–55, doi:10.1109/REV.2008.2.
[6] H. Kaindl, ‘‘The missing link in requirements engineering,’’ACM SIG- SOFT Softw. Eng. Notes, vol. 18, no. 2, pp. 30–39, Apr. 1993, doi:10.
1145/159420.155836.
[7] K. Kamalabalan and T. Uruththirakodeeswaran, ‘‘Tool support for trace- ability of software artefacts,’’ inProc. Moratuwa Eng. Res. Conf. (MER- Con), Apr. 2015, pp. 318–323, doi:10.1109/MERCon.2015.7112366.
[8] Y. Li and W. Maalej, ‘‘Which traceability visualization is suitable in this context? A comparative study,’’ inRequirements Engineering: Foundation for Software Quality(Lecture Notes in Computer Science: Lecture Notes in Artificial Intelligence (LNAI) Lecture Notes in Bioinformatics), vol. 7195.
Berlin, Germany: Springer, 2012, pp. 194–210, doi:10.1007/978-3-642- 28714-5_17.
[9] J. Lin, C. Chou Lin, J. C. Huang, R. Settimi, J. Amaya, G. Bedford, B. Berenbach, O. B. Khadra, C. Duan, and X. Zou, ‘‘Poirot: A distributed tool supporting enterprise-wide automated traceability,’’ inProc. 14th IEEE Int. Requirements Eng. Conf. (RE), Sep. 2006, pp. 356–357, doi:10.
1109/RE.2006.48.
[10] A. De Lucia, F. Fasano, R. Oliveto, and G. Tortora, ‘‘ADAMS re-trace:
A traceability recovery tool,’’ inProc. 9th Eur. Conf. Softw. Maintenance Reeng., 2005, pp. 32–41, doi:10.1109/CSMR.2005.7.
[11] G. Marchionini and B. Shneiderman, ‘‘Finding facts vs. Browsing knowl- edge in hypertext systems,’’Computer, vol. 21, no. 1, pp. 70–80, Jan. 1988, doi:10.1109/2.222119.
[12] A. Marcus, X. Xie, and D. Poshyvanyk, ‘‘When and how to visualize traceability links?’’ inProc. 3rd Int. Workshop Traceability Emerg. Softw.
Eng. (TEFSE), CA, USA, 2005, pp. 56–61.
[13] T. Merten, D. Juppner, and A. Delater, ‘‘Improved representation of trace- ability links in requirements engineering knowledge using Sunburst and Netmap visualizations,’’ inProc. 4th Int. Workshop Manag. Requirements Knowl., Aug. 2011, pp. 17–21, doi:10.1109/MARK.2011.6046557.
[14] P. Bouillon, J. Krinke, and N. Meyer, ‘‘EzUnit: A framework for associat- ing failed unit tests with potential programming errors,’’ inProc. 8th Int.
Conf. Agile Process. Softw. Eng. Extreme Program., Como, Italy, 2007, pp. 101–104.
[15] R. M. Parizi, S. P. Lee, and M. Dabbagh, ‘‘Achievements and challenges in state-of-the-art software traceability between test and code artifacts,’’
IEEE Trans. Rel., vol. 63, no. 4, pp. 913–926, Dec. 2014, doi:10.1109/
TR.2014.2338254.
[16] A. Qusef, G. Bavota, R. Oliveto, A. D. Lucia, and D. Binkley,
‘‘SCOTCH: Slicing and coupling based test to code trace hunter,’’ in Proc. 18th Work. Conf. Reverse Eng., Oct. 2011, pp. 443–444, doi:
10.1109/WCRE.2011.68.
[17] A. Qusef, R. Oliveto, and A. D. Lucia, ‘‘Recovering traceability links between unit tests and classes under test: An improved method,’’ in Proc. IEEE Int. Conf. Softw. Maintenance, Sep. 2010, pp. 1–10, doi:10.
1109/ICSM.2010.5609581.
[18] A. Rodrigues, M. Lencastre, and G. A. D. A. C. Filho, ‘‘Multi- VisioTrace: Traceability visualization tool,’’ inProc. 10th Int. Conf.
Qual. Inf. Commun. Technol. (QUATIC), Sep. 2016, pp. 61–66, doi:10.
1109/QUATIC.2016.019.
[19] G.-C. Roman and K. C. Cox, ‘‘Program visualization: The art of mapping programs to pictures,’’ inProc. Int. Conf. Softw. Eng., 1992, pp. 412–420.
[20] S. Winkler and J. von Pilgrim, ‘‘A survey of traceability in requirements engineering and model-driven development,’’Softw. Syst. Model., vol. 9, no. 4, pp. 529–565, Sep. 2010, doi:10.1007/s10270-009-0145-0.
[21] B. V. Rompaey and S. Demeyer, ‘‘Establishing traceability links between unit test cases and units under test,’’ inProc. 13th Eur. Conf. Softw.
Maintenance Reeng., 2009, pp. 209–218, doi:10.1109/CSMR.2009.39.
[22] T. Stanković, M. Štorga, I. Stojić, and T. Savšek, ‘‘Traceability visualisa- tion toolkit,’’ inProc. Int. Design Conf., vol. 70, 2012, pp. 1617–1626.
[23] J. H. Hayes, A. Dekhtyar, and S. K. Sundaram, ‘‘Advancing candidate link generation for requirements tracing: The study of methods,’’IEEE Trans.
Softw. Eng., vol. 32, no. 1, pp. 4–19, Jan. 2006, doi:10.1109/TSE.2006.3.
[24] A. D. Thommazo, G. Malimpensa, T. R. D. Oliveira, G. Olivatto, and S. C. P. F. Fabbri, ‘‘Requirements traceability matrix: Automatic generation and visualization,’’ inProc. 26th Brazilian Symp. Softw. Eng., Sep. 2012, pp. 101–110, doi:10.1109/SBES.2012.29.
[25] H. M. Sneed, ‘‘Reverse engineering of test cases for selective regression testing,’’ inProc. 8th Eur. Conf. Softw. Maintenance Reeng. (CSMR), Mar. 2004, pp. 69–74.
[26] N. Aljawabrah, T. Gergely, and M. Kharabsheh, ‘‘Understanding test- to-code traceability links: The need for a better visualizing model,’’
in Computational Science and Its Applications—ICCSA 2019 (Lec- ture Notes in Computer Science: Lecture Notes in Artificial Intelli- gence (LNAI) Lecture Notes in Bioinformatics), vol. 11622. Cham, Switzerland: Springer, 2019, pp. 428–441, doi: 10.1007/978-3-030- 24305-0_32.
[27] R. M. Parizi, A. Kasem, and A. Abdullah, ‘‘Towards gamification in software traceability: Between test and code artifacts,’’ inProc. 10th Int.
Conf. Softw. Eng. Appl., Jul. 2015, pp. 393–400.
[28] R. M. Parizi, ‘‘On the gamification of human-centric traceability tasks in software testing and coding,’’ inProc. IEEE 14th Int. Conf. Softw. Eng.
Res., Manage. Appl. (SERA), Towson, MD, USA, Jun. 2016, pp. 193–200, doi:10.1109/SERA.2016.7516146.
[29] T. Gergely, G. Balogh, F. Horváth, B. Vancsics, Á. Beszédes, and T. Gyimóthy, ‘‘Differences between a static and a dynamic test-to-code traceability recovery method,’’Softw. Qual. J., vol. 27, no. 2, pp. 797–822, Jun. 2019.
[30] A. Kicsi, L. A. Vidcs, V. Csuvik, F. Horváth, A. Beszédes, and F. Kocsis,
‘‘Supporting product line adoption by combining syntactic and textual feature extraction,’’ inProc. Int. Conf. Softw. Reuse. Cham, Switzerland:
Springer, 2018, pp. 148–163.
[31] R. White, J. Krinke, and R. Tan, ‘‘Establishing multilevel test-to-code traceability links,’’ in Proc. ACM/IEEE 42nd Int. Conf. Softw. Eng., Jun. 2020, pp. 861–872.
[32] D. A. Meedeniya, I. D. Rubasinghe, and I. Perera, ‘‘Traceability establish- ment and visualization of software artefacts in DevOps practice: A survey,’’
Int. J. Adv. Comput. Sci. Appl., vol. 10, no. 7, pp. 66–76, 2019.
[33] I. Rubasinghe, D. Meedeniya, and I. Perera, ‘‘Automated inter-artefact traceability establishment for DevOps practice,’’ inProc. IEEE/ACIS 17th Int. Conf. Comput. Inf. Sci. (ICIS), Jun. 2018, pp. 211–216, doi: 10.
1109/ICIS.2018.8466414.
NADERA ALJAWABRAH received the mas- ter’s degree in software engineering from The Hashemite University, Jordan. She is currently pursuing the Ph.D. degree with the Department of Software Engineering, Szeged University, Hun- gary. Her doctoral research investigates the visu- alization of software testing. She authored the articles Understanding TCT Links: The Need for a Better Visualizing Model and TCtracVis: TCT Links Visualization Tool and coauthored the arti- cles Visualizing Testing Results for Software Projects and Towards a Com- prehensive Survey of the Requirements Elicitation Process Improvements.
TAMÁS GERGELYreceived the Ph.D. degree in computer science from the University of Szeged, in 2011. He is currently an Assistant Professor with the Department of Software Engineering, University of Szeged. He has been teaching for more than 20 years, including testing of CTFL, Agile FL, ATM, ATA, ATTA, and CPRE FL, for more than ten years. His research interests include software quality, software testing, and test quality.
He has more than 35 publications and participated in many academic-industrial projects in these fields.
SANJAY MISRA(Senior Member, IEEE) received the M.Tech. degree in software engineering from the Motilal Nehru National Institute of Technol- ogy, India, and the Ph.D. degree in information and knowledge engineering (software engineer- ing) from the University of Alcalá, Spain. He is currently a Full Professor of computer engineering with Covenant University (400–500 ranked Uni- versity by THE) Ota, Nigeria. He has 25 years of vast experience in academic administration and research in various universities in Asia, Europe, and Africa. As per SciVal (SCOPUS-Elsevier) analysis, he is the most productive researcher in whole Nigeria, from 2012 to 2017, from 2013 to 2018, from 2014 to 2019, and from 2015 to 2020 (in all disciplines/subjects), in computer science No. 1 in the whole country and No. 4 in the whole continent. He has published more than 400 articles (SCOPUS/Web of Science) with more than 300 coauthors around the world (-102 in JCR/SCIE journals) in the core and application area of software engineering (SQA, SPI, and SPM), Web engineering, health informatics, cyber security, and intelligent systems. He received several awards for outstanding publications, including the 2014 IET Software Pre- mium Award (U.K.), and from the TUBITAK-Turkish Higher Education, and Atilim University. He has delivered more than 90 keynote speeches/invited talks/public lectures in reputed conferences and institutes around the world (travelled around 60 countries). He edited (with colleagues) 49 LNCS and nine IEEE proceedings, and several books. He was the Editor-in-Chief of the book seriesIT Personnel and Project Management, theInternational Journal of Human Capital and Information Technology Professionals (IJHCITP) (IGI Global), and of three journals (IJ) and an editor of various SCIE journals.
LUIS FERNANDEZ-SANZ received the degree in computing from the Polytechnic University of Madrid (UPM), in 1989, and the Ph.D. degree in computing, with a special award, from the University of the Basque Country, in 1997. With more than 20 years of research and teaching expe- rience with the UPM, the Universidad Europea de Madrid, and the University of Alcalá (UAH), he has also been engaged in the management of the main Spanish Computing Professionals Asso- ciation, as the Vice President. He is currently an Associate Professor with the Department of Computer Science, UAH. He is also the Chairman of the ATI Software Quality Group. His general research interests include software quality and engineering, accessibility, eLearning, and ICT professionalism and education. He has held the vice president position of the Council of Euro- pean Professional Informatics Societies (CEPIS), from 2011 to 2013 and since 2016.