Ecocycles 4(1): 1-9 (2018)
ISSN 2416-2140 DOI: 10.19040/ecocycles.v4i1.84
ORIGINAL ARTICLE
Sustainable development deficit in Europe: modelling, ranking, and classification of countries
Otepka P.
1, Grynenko V.
1, 21Department of Sustainable Development, Slovak University of Agriculture in Nitra, 949 76, Hlinku 2, Nitra, Slovak Republic
2Department of Business Administration and Regional Development, O.M. Beketov National University of Urban Economy in Kharkiv, 61002, vul. Revolutsii 12, Kharkiv, Ukraine
E-mail addresses: pavol.otepka@uniag.sk and vvgrynenko@gmail.com
Abstract – The paper focuses on evaluation of progress of European and neighbouring countries in sustainable development using the system of environmental, social and economic indicators. The task of the research is to identify the problem (deficit) points of countries from the sustainable development point of view. The system of indices which characterize deficit in different sustainable development dimensions has been evaluated. The ranking of European and some neighbouring countries on sustainability problems level has been developed. The counties under consideration have been classified on significance and nature of their sustainable development problems. It is shown that the level of sustainable development is not related with the level of economic development, some of the most economically developed European countries have deep sustainability problems and, in contrast, it is possible to reach good progress toward sustainable development despite economic difficulties.
Keywords – sustainable development, deficit, indices, ranking, Europe Received: November 3, 2017 Accepted: December 2, 2017
————————————————————————————————————————————————
Introduction
Sustainable development is defined as the intersection of economic, social and environmental dimensions where the lack or deficit in any of them means the absence of sustainability as it is shown on the classical Venn diagram of Sustainable Development (Lozano 2008).
Therefore, sustainable development of a country depends on successful parallel implementation of proper economic, social and environmental policies. Any shortfall like economic problems, or social well-being, or deficit of basic vital resources for human life puts sustainable development of a country under the question.
How to measure these shortfalls for a country? The concept of deficit is very close to the poverty problem (Francis 2001) which is defined generally as means deprivation, shortage in one or several basic essential needs (Adams 2004, Kakwani & Silber 2008, Nussbaum, 2000, Sen 1985; Atkinson & Bourguignon, 1999;
Bossert, D’Ambrosio & Peragine 2007, Mont & Braith- waite 2009). Key sustainable development dimensions belong to the primary determinants of human well-being (economic wealth; social values, benefits and rights;
vital environmental resources) and, definitely, any deficit in this sphere may be considered, investigated and evaluated in terms of poverty (Iceland 2005, Grosse, Harttgen & Klasen 2008). Thus, we propose to apply
methodology of poverty measurement in evaluation of sustainable development deficits of European and neighbouring countries.
The problem of poverty in the context of sustainable development is a complex, multidimensional pheno- menon (Chakravarty 1983, 2008, Calvo 2008, Zeumo, Tsoukiàs & Somé 2014) which can be considered from different points. There are such specific issues, as water availability (Jemmali 2017), immigration (Liu, Shuai &
Zhou 2017), energy poverty (Sadath & Acharya 2017), demography (Mohsena M., Goto R. & Mascie-Taylor C.G.N. 2017), methodological aspects of sustainability deficit evaluation like integration of sustainable development indicators (Mauro V., Biggeri M. &
Maggino F. 2016), convergence of sustainability poverty evaluations with sustainable development goals (Kosmowski F. 2016), (Minujin A., Ferrer M. 2016);
relationships between sustainability and poverty (Ozturk 2017); ethics (Donaldson & Blackorby 1980).
The corner stone of poverty or deficits analysis is identification of minimal poverty threshold. Persons, regions or countries whose income (or direct consum- ption of any commodity or value) is under this threshold are considered as poor (Iniguez-Montiel 2014) and the value under the threshold (it can be economic, social or
2
environmental value) are considered to be deficit. The threshold (line) itself is a matter of endless discussions and dependent on prices level and living standards in the society under consideration. The poverty threshold used in the European Union is a level of income ordinarily established at 60% of the median household income, or individuals who fall into the bottom 20% of the income distribution might be considered poor. Countries are considered to be poor or not on the basis of such indicators as incomes or gross domestic product (GDP).
But the national sustainable development depends not only on incomes but on numerous social, environmental factors, like availability of natural resources, quality of governance and may be endangered in long time run with shortage in any of these factors (Pérez-Ortiz at al.
2014) in regards to current level of development, so evaluation of sustainable development deficits should also be multidimensional.
The aim of this paper is to evaluate the level of sustainable development deficits in Europe using adapted system of multidimensional poverty indices at the national level and to identify the nature of these deficits. The tasks are to select the dimensions for evaluation which are relevant for sustainability analysis, to find weights of each dimension, to calculate multidimensional sustainable development deficit index and to rank countries by this index.
Material and Methods
Alkire & Foster (2011), Alkire (2017) provided general definitions and descriptions of unidimensional and multidimensional methodologies for measuring poverty, including FGT (Foster–Greer–Thorbecke) (Foster at al.
1984) indices and proposed the multidimensional method for identifying the poor that uses two forms of cut-offs and combines traditional intersection and union approaches. To construct FGT class poverty index the distribution of a given resource (say income) and a poverty line are needed. Every income is considered to be either poor, if it is below poverty line, or no. Then, each poor income is replaced with 1 and each non poor income is replaced with 0. The distribution of replaced incomes is called deprivation vector which identifies the poor. The normalized gap vector replaces each poor income with the normalized gap (relative income deviation of poverty line). If income is non-poor the normalized gap is assigned as 0. The normalized gap shows how deep the poverty of any person is. Such indexes are widely used, but only for micro-level evaluation, for households and individuals.
Adaptation of FGT methodology to the sustainable development deficits evaluation requires the system of environmental, economic and social indicators that characterize well-being in a country in the context of sustainable development. This system can be described as a pyramid of factors of sustainable well-being of a country which determine wellbeing of a nation and
which shortages can be defined as poverty or deficit: i) environmental resources; ii) production of values; iii) consumption of values; iv) life of a human beings (quality of life, duration of life) as the final result development process.
Required data has been collected among World Development indicators (WDI). (Source: The World Bank, https://www.data.worldbank.org, see Table 1).
This database is suitable for international comparisons since it contains already comparable data, evaluated with the same methodology for every country, measured in the same units etc. Information was taken on September, 1, 2017. It is rational to select for the group of “natural resources” factors those, which availability is vital for every nation like food, water and healthy space for living of current and future generations. We selected the indicators of agricultural area, which includes arable land, permanent crops and permanent pastures (sq. km), forest area (sq. km) and renewable internal freshwater resources (cubic meters). Forests may be seen as less important resource than agricultural land and fresh water but from sustainability point of view it is a reserve of numerous other kinds of resources. Production level depends on the factors of production which are described below.
Monetary factors – investments and reserves have enormous role in development of economies. Money and gold reserves are the most important and liquid financial assets for all countries, banks, organizations and individuals. Indicators of investments, and money and gold reserves per capita should be included into the system. To disclosure the influence of these factor on well-being level we used the indicators of gross national income (GNI), GDP (both evaluated through purchasing power parity, in current international US$) and the indicator “total reserves in months of imports”.
Factor “labour” participates in wealth generation in two ways: 1) as a quantity of used labour. Used labour and productivity of labour per capita are presented as two the most generalizing indicators: a part of employed population per capita and GDP per capita. A part of employed population is calculated using the indicator
“unemployment, % of total labour force”.
The system of indicators should take into consideration the importance of an every factor and an every group of factors. The most important factor is human life (right to life) itself. Right to life is presented with two indicators, which are widely used: 1) population size (quantity of human lives), 2) average life expectancy (quality of life, what reflects achievements in medicine, safety, living conditions etc.). It is proposed to take into consideration the influence of population size in indirect way, using other indicators, calculated per capita.
The consequent in priority level is human life quality.
The most universal are the following indicators per
3
capita: 1) incomes indicator – adjusted net national income (as full sum of primary incomes) per capita; 2) indicators of consumption. There are the following the most important consumption indicators: electric power consumption (kWh), fossil fuel energy consumption (%
of total), renewable energy consumption (% of total), final consumption expenditure (current US$), general government final consumption expenditure (current US$), household final consumption expenditure (current US$). And, finally, the indicator of average life expectancy is taken to evaluate resulting effectiveness of development of a country.
The poverty thresholds have been computed according to EU standard where incomes considered poor being below 60% of median income. It is possible to spread this rule and for country-level multidimensional evaluation based on sustainable development indicators using EU aggregates of selected indicators. The only
exception is life expectancy threshold where EU average of life expectancy is applied as poverty line directly, without 60% correction.
Multivariate statistical techniques were used to provide insight in the relationships between the indicators. The validity of the system of preliminary selected indicators for multidimensional poverty evaluation has been tested using principal components analysis (PCA) technique which allowed the examination of the interrelationships between tested indicators. The aim is to simplify the system by exclusion of indicators, which affect the system in similar way. Such indicators may be eliminated without significant loss of information about well-being dimensions trends. PCA is widely used for data reduction. Data reduction allows the formation of a new set of variables which explain most of the variation in all of the original variables. Positive or negative loadings indicates the contribution of variables that Table 1. The system of indicators for sustainability poverty evaluation
№ Indicator Type Unit of measurement Abbreviation
1 2 3 4 5
Environmental resources
1 Agricultural area Env. hectares per capita AGR
2 Forest area Env. hectares per capita FRT
3 Renewable internal freshwater resources Env. cubic meters per capita WATER Production of values
4 GDP, purchasing power parity Econ. current international, thousands
$, per capita GDP
5 GNI, purchasing power parity Econ. current international, thousands
$, per capita GNI
6 Unemployment Econ. % of total labour force UNEMP
7 Adjusted net national income Econ. current US$, thousands, per
capita INCOME
8 Total reserves Econ. months of imports RESERV
Consumption of values
9 Final consumption expenditure Social constant 2010 thousands US$
per capita Fin.con
10 Government consumption expenditure Social constant 2010 thousands US$
per capita
Gov.con
11 Household consumption expenditure Social constant 2010 thousands US$
per capita Hous.con
12 Electric power consumption Social kWh per capita ELECTR
13 Fossil fuel energy consumption Social % of total FUEL
14 Renewable energy consumption Social % of total R.ENER
15 Life expectancy at birth Social total (years) Life
4
increase or decrease with increasing loadings in any dimension, respectively. The terms ‘strong’, ‘moderate’, and ‘weak’, as applied to principal component loadings, refer to absolute loading values of >0.75, 0.75–0.5 and 0.5–0.3, respectively (Liu et al., 2003). The results of this test allowed us to identify and to elucidate redundant indicators. The number of principal components or factors kept was based on the Kaiser criterion, for which only the components with eigenvalues greater than 1 were retained (Kaiser, 1958). The PCA performed in the present study has been supported by the software package Statistica 8.0.
Due to PCA results, redundant indicators were identified and eliminated. Final system of indicators for multidimensional sustainability poverty evaluation on national level consists of 10 (ten) components which represent four dimensions of well-being: available natural resources (forest area, renewable internal freshwater resources); effectiveness of production (employment (EMP), GDP, adjusted net national income, total reserves) and consumption (final consumption expenditure, electric power consumption, renewable energy consumption) and quality of human life itself which results in life expectancy indicator. The indicator of employment (EMP) is obtained with transformation of unemployment indicator (UNEMP).
Thus, the system of sustainable development indicators for multidimensional evaluation of country-level sustainable development deficits may be defined as the following vector:
i=(FRT, WATER, GDP, EMP, INCOME, RESERV, Fin.con, ELECTR, R.ENER, Life) (2)
Actually, all these indicators are already considered as factors of efficient sustainable development. However until now their influence is not taken into account in multidimensional evaluation of sustainable development deficits on national level.
The system of selected sustainable development indicators results in the multidimensional index of sustainable development deficits (MISD).
The problem of multidimensional valuation is defining weights of partial indicators into integral multidimen- sional indicator. We propose to create a balance of indicators, to balance the resources for human life (environmental resources and produced values) with the results of usage of these resources (consumed values and average time of life). All indicators are subdivided into two groups with equal weight: 50%. Such balancing of two parts of any balance (used resources and use of these resources) fully corresponds with world practice and theory of the use of all balances and budgets of the countries, all balances and accounts of accounting, and also the system of national accounts (SNA of UN).
Environmental resources are primary, initial for all produced values in the process of sustainable development. Because of awareness of significance of resources for sustainable development and fundamental impossibility of elimination of them in every type of the production, it is rational accordingly to a probability theory to subdivide all resources and production (50%) into two equal parts: 1) the resources - 25%; 2) the use of these resources (production) - 25%. These two parts are balance of resources: the resources for production (25%)
= the production (25%). All results of the use of resources (50%) are subdivided into two parts: 1) consumption - 25%; 2) the use of consumed values for providing of amount of lives of people and average time of life - 25%. The weighs of specific indicators within groups are taken equal (see Table 2).
The weights form congruent vector w:
w=(WFRT,WWATER,WGDP,WEMP,,WINCOME,WRESERV,Wfin.con, WELECTR,WR.ENER,WLIFE,) (3)
Multidimensional index of sustainable development deficits (MISD) is evaluated as weighted arithmetic average of normalized poverty gaps of partial indicators.
Poverty gap is a difference between the factual value of any partial indicator used for multidimensional poverty evaluating and its poverty threshold in the case if this value is below the threshold. If the value is higher the poverty gap is considered to be equal zero.
if Gi<0 (4) where:
Gi – poverty gap;
I – factual value of partial indicator i;
Ithreshold – poverty threshold for this indicator, which is based on EU aggregate for this evaluation.
Normalized (relative) poverty gap is a ratio of poverty gap over its threshold:
(5) Therefore,
(6) Where
GNi – normalized poverty gap of partial indicator i from vector of indicators i;
Wi - weight of partial indicator I from vector of weights w.
Gi=I−Ithreshold
GNi= −Gi Ithreshold
MISD=
∑
i=1 n
( GNiWi )
∑
i=1 nWi
5
Results and discussionsMultivariate statistical treatment of the national socio-economic and environmental data
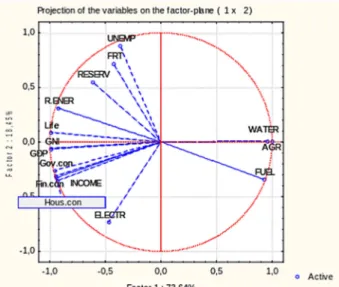
PCA method is applied for final selection of indicators (Patil & Taillie 2004).The strong positive correlation (Pearson criterion, r > 0.75) was found between all tested indicators (see Table 2) in EU aggregates which are applied as a base of comparison for poverty evaluation.
The results of the PCA revealed that due to Kaiser Criterion two principal components were identified with cumulative eigenvalue 92.1% of variance. The strong linear correlation of GDP and GNI, agricultural land and renewable fresh water, consumption indicators suggests the common origin of these components (Figure 1).
Figure 1. PCA plot for preliminarily selected indicators Due to obtained data indicators of GNI, agricultural land, fossil fuel consumption, government and household consumption were eliminated from the dataset. GNI indicator has the component loading which is equivalent
with GDP one, agricultural land is related with water in the same way, fossil fuel energy consumption percentage loading is directly opposite to renewable energy indicator and all kinds of consumption expenditures also have very similar components loadings.
Thus, the indicators of GDP and final consumption expenditure were selected for the following analysis as the most general. Renewable fresh water was selected as primary indicator towards agriculture. And renewable energy consumption percentage was preferred as one of the most important sustainable development indicators, which is also primary towards fossil energy consumption. As a result of data reduction the quality of representation (cumulative eigenvalue) was cut to 89.7%
what is satisfactory level.
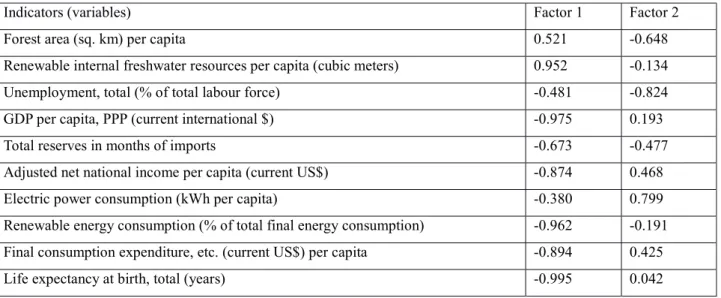
The factor analysis revealed two main groups of the studied components associated with Factor 1 and Factor 2 (Table 3).
Therefore, four major groups of the components were identified: natural resources consumption with strong positive correlation to factor 1; financial indicators related to incomes, GDP and consumption together with life expectancy with strong negative correlation to factor 1; unemployment level with strong negative correlation to factor 2; and electricity usage with positive correlation to factor 2.
All the operations with the data including extraction, cleaning, transformation, evaluation of indexes of forests poverty and fuelwood production intensity, ranking of EU countries and regression modelling have been performed with Python scripts (Khwaldeh 2013) using NumPy, Pandas and SciPy libraries (Oswald & Putka 2017). The scripts have been coded specially for this research.
Table 2. Balance of indicators
Indicator Balances of indicators Abbreviation
Initial Transitional Final
1 2 3 4 5
1. Resources for human life 50%
1.1. Environmental resources 25%
FRT 12.5% WFRT
WATER 12.5% WWATER
1.2 Produced values 25%
GDP 6.25% WGDP
EMP 6.25% WEMP
INCOME 6.25% WINCOME
RESERV 6.25% WRESERV
2. Results of usage of resources 50%
2.1 Consumed values 25%
Fin.con 8.3% WFin.con
ELECTR 8.3% WELECTR
R.ENER 8.3% WR.ENER
2.2 Life 25% 25% WLIFE
6
Multidimensional integration of the national socio- economic and environmental data
To test the proposed method of multidimensional evaluation of sustainable development deficits on national level we calculated MISD index for 41 European and neighbouring countries for the 1997-2016 period years and developed rating for countries by this parameter (see Table 4).
MISD index is measured in percentage and displays, respectively the percentage of sustainable development deficits which is calculated as average of normalized poverty gaps of selected sustainable development indicators. Therefore, the countries which have many deep deficits have high positions into this rating and, in contrast, the countries where no sustainable development indicators are under the deficit threshold (these are France, Sweden and Norway) are in the bottom of the ranking with zero MISD values.
The rating shows that MISD values vary with no direct relationship with the level of economic development.
Due to this index the country may be considered sustainable only if high level of economic well-being is combined with efficient social, environmental policies which result in high average life expectancy and with availability of reserves of living space for people.
The most problem countries have deep problems in at least several dimensions and among them are such economically and socially developed as Netherlands and Belgium which are well known with their progress toward sustainable development. It might seem strange, but it is shown with MISD that, for an example, despite all the achievements the sustainability of Netherlands is endangered with such inherent problems as deficit of living space and fresh water which are additionally deepened with financial problems (low level of reserves) and low level of alternative energy use. The similar
situation is Belgium and, partly, in Germany which significantly improved its positions in recent years by successful implementation of alternative energy technologies. At the same time Greece, despite current economic circumstances, stays a very successful country with low level of multidimensional poverty and good development perspectives. Greece is well provided with vital resources, effectively transforms economic values into high quality of life and moves toward sustainability goals by implementing green technologies. The positions of countries of the Central Europe are different but tend to be in the middle of the ranking. It is natural since they have neither deep inherent problems of some Western European countries nor their economic, social and technological advances. In general it shown that the dependence between economic development and sustainability is ambiguous. The most sustainable countries are rich, but not all rich counties are sustainable. Poor countries can’t be sustainable even if they have all necessary natural resources. But any country has possibilities to improve its perspectives by creating conditions for long and healthy human life and by implementing new green technological advances.
Uncertainty of the evaluation
Proposed method of multidimensional sustainability poverty evaluation is based on usage of limited number of indicators. Thus, the majority of recognized with UN and EU sustainable development indicators have been excluded from the analysis in order to underline exceptionally the most significant problems which endanger the country under consideration. The risks of an incomplete view on a country’s sustainability are reduced with selection of the most general indicators and testing the whole system with the PCA method. Validity of developed final system of indicators has been tested for Europe and its application to the countries with substantially different environmental, economic and social conditions requires additional checks.
Table 3. Factor coordinates of the variables, based on correlations between components (EU data), also for each country separately
Indicators (variables) Factor 1 Factor 2
Forest area (sq. km) per capita 0.521 -0.648
Renewable internal freshwater resources per capita (cubic meters) 0.952 -0.134
Unemployment, total (% of total labour force) -0.481 -0.824
GDP per capita, PPP (current international $) -0.975 0.193
Total reserves in months of imports -0.673 -0.477
Adjusted net national income per capita (current US$) -0.874 0.468
Electric power consumption (kWh per capita) -0.380 0.799
Renewable energy consumption (% of total final energy consumption) -0.962 -0.191 Final consumption expenditure, etc. (current US$) per capita -0.894 0.425
Life expectancy at birth, total (years) -0.995 0.042
7
ConclusionsIn this paper we have proposed a method of identification of weaknesses of countries in their progress toward sustainability which is based on the concept of sustainability deficits and on multidimen- sional evaluation of sustainability deficits. It is presumed that a country may be sustainable in long time run only if it has access to vital environmental resources, which are effectively transformed through production process into the values needed for healthy and happy life of human beings. The shortages in any of four determinants (environmental resources, production, consumption and social system) endanger sustainable development of a country. Therefore, sustainability deficit means shortages in one or several dimensions which determine sustainability (of a country, as in the paper, or a region, city, local community etc.). It is proposed to use the system of FGT indices for evaluation of sustainability poverty and to integrate them into multidimensional index of sustainability deficit (MISD). We used for evaluation cleaned data from respected international statistics sources. Validity of the system of preliminarily
selected indicators has been tested with PCA method and all redundant data has been excluded. The weights of partial indicators into integral multidimensional index have been defined using balance approach where resources and production are balanced with consumption and human lives as final result of development.
Designed multidimensional index of sustainability poverty was calculated for European countries for the last 27 years and it is found that sustainable development of countries is related with economic development only in indirect way. It is expected to use obtained results for identification of optimal country-level sustainable development strategies, which are, in turn, the basis for local and enterprise-level strategies.
Acknowledgments
The work has been supported by the National Scholarship Programme of the Slovak Republic and by the projects: No. IEE/10/470/SI2.593725 “Promotion to Regional Bioenergy Initiatives – PromoBio”, implemented within the EU program “Intelligent Energy – Europe” and No. 2017-1-SE01-KA203-034570 Table 4. Rating of countries by Multidimensional Index of Sustainable Development Deficits (MISD)
Rank Country MISD, % Rank Country MISD, %
1 Moldova 39.88 22 Estonia 9.08
Azerbaijan 35.99 23 Slovak Republic 9.06
3 Ukraine 29.96 24 Ireland 8.83
4 Armenia 28.49 25 Poland 8.38
5 Netherlands 26.38 26 Germany 6.94
6 Georgia 22.15 27 Latvia 6.93
7 Serbia 18.68 28 Czech Republic 6.83
8 Albania 18.11 29 Croatia 6.45
9 Belgium 17.71 30 Lithuania 5.42
10 Bosnia and Herzegovina 17.14 31 Slovenia 4.84
11 Belarus 16.61 32 Greece 3.71
12 Macedonia, FYR 16.55 33 Italy 2.48
13 Hungary 15.35 34 Switzerland 2.44
14 Cyprus 14.91 35 Finland 1.97
15 Russian Federation 14.87 36 Spain 1.67
15 Turkey 13.29 37 Austria 1.23
17 United Kingdom 12.99 38 Portugal 0.13
18 Bulgaria 12.7 39 France 0
19 Romania 12.69 40 Sweden 0
20 Luxembourg 10.66 41 Norway 0
21 Denmark 10.5
8
„Sustainable Management of Cultural Landscape”
implemented within Erasmus plus Strategic Partnership Programme.
References
Adams, R. (2004). Economic Growth, Inequality and Poverty: Estimating the Growth Elasticity of Poverty.
World Development, 32, 1989-2014.
DOI: 10.1016/j.worlddev.2004.08.006
Alkire, S., & Foster, J. (2011). Counting and multidimensional poverty measurement. Journal of Public Economics, 95, 476-487.
DOI: 10.1016/j.jpubeco.2010.11.006
Alkire, S., & Foster, J. (2011). Understandings and misunderstandings of multidimensional poverty measurement. The Journal of Economic Inequality, 9, 289-314.
DOI: 10.1007/s10888-011-9181-4
Alkire, S., & Santos, M. (2011). Acute multidimensional poverty: A new index for developing countries. UNDP Human Development Research Paper 2010/11.
http://hdr.undp.org/en/content/acute-multidimensional- poverty
Alkire, S., & Santos, M. (2014). Measuring Acute Poverty in the Developing World: Robustness and Scope of the Multidimensional Poverty Index. World Development, 59, 251-274.
DOI: 10.1016/j.worlddev.2014.01.026
Alkire, S., & Seth, S. (2015). Multidimensional Poverty Reduction in India between 1999 and 2006: Where and How? World Development, 72, 93-108.
DOI: 10.1016/j.worlddev.,2015.02.009
Alkire S., Roche J.M., Vaz A. (2017) Changes Over Time in Multidimensional Poverty: Methodology and Results for 34 Countries. World Development, 94, pp.
232-249.
DOI: 10.1016/j.worlddev.2017.01.011
Atkinson, A. B., & Bourguignon, F. (1999). Poverty and inclusion from a world perspective. In Paper presented for the ABCDE Europe conference, Paris.
Bossert, W., D’Ambrosio, C., & Peragine, V. (2007).
Deprivation and social exclusion. Economica, 74 (296), 777–803.
DOI: 10.1111/j.1468-0335.2006.00572.x
Mont, D., & Braithwaite, J. (2009). Disability and poverty: A survey of World Bank Poverty Assessments and implications. ALTER - European Journal of Disability Research / Revue Européenne de Recherche sur le Handicap, 3, 219-232.
DOI: 10.1016/j.alter.2008.10.002
Calvo, C. (2008). Vulnerability to Multidimensional Poverty: Peru, 1998–2002. World Development, 36, 1011-1020.
DOI: 10.1016/j.worlddev.2007.10.001
Chakravarty, S. (1983). A New Index of Poverty.
Mathematical Social Sciences, 6, 307-313.
Chakravarty, S., Deutsch, J., & Silber, J. (2008). On the Watts Multidimensional Poverty Index and its Decomposition. World Development, 36, 1067-1077.
DOI: 10.1016/j.worlddev.2007.10.003
Donaldson, D., & Blackorby, C. (1980). Ethical Indices for the Measurement of Poverty. Econometrica, 48, 1053-1060.
Iceland J. (2005). “Measuring poverty: theoretical and empirical considerations.” Measurement: Interdiscipli- nary Research and Perspectives 3: 199–235.
DOI: 10.1207/s15366359mea0304_1
Jemmali H. (2017) Mapping water poverty in Africa using the improved Multidimensional Index of Water Poverty. International Journal of Water Resources Development, 33 (4), pp. 649-666.
DOI: 10.1080/07900627.2016.1219941
Francis, T. (2001). The causes and impact of poverty on sustainable development in Africa. “Poverty and Sustainable Development” Action Centre for Rural Community Development, 237.
Foster, J.E., Greer, J., Thorbecke, E., 1984. A class of decomposable poverty measures. Econometrica 52, 761–
766.
Grosse, M., Harttgen, K., & Klasen, S. (2008) Measuring Pro-Poor Growth in Non-Income Dimensions. World Development, 36, 1021-1047.
DOI: 10.1016/j.worlddev.2007.10.009
Iniguez-Montiel, A. (2014). Growth with Equity for the Development of Mexico: Poverty, Inequality, and Economic Growth (1992–2008). World Development, 59, 313-326.
DOI: 10.1016/j.worlddev.2014.01.011
Kaiser H.F. (1958): "The varimax criterion for analytic rotation in factor analysis." Psychometrika 23: 187–200.
Kakwani, N., & Silber, J. (2008). Introduction: multidi- mensional Poverty analysis: Conceptual Issues, Empi- rical Illustrations and Policy Implications. World Deve- lopment, 36, 987-991.
DOI: 10.1016/j.worlddev.2007.10.004
Kana Zeumo, V., Tsoukiàs, A., & Somé, B. (2014). A new methodology for multidimensional poverty
9
measurement based on the capability approach. Socio- Economic Planning Sciences, 48, 273-289.
DOI: 10.1016/j.seps.2014.04.002
Khwaldeh Ali at al. (2013). Atomic Data Mining Numerical Methods, Source Code SQlite with Python, Procedia - Social and Behavioral Sciences, Volume 73, 2013, Pages 232-239, ISSN 1877-0428.
DOI: 10.1016/j.sbspro.2013.02.046
Klasen, S. (2008). Economic Growth and Poverty Redu- ction: Measurement Issues using Income and Non- Income Indicators. World Development, 36, 420-445 DOI: 10.1016/j.worlddev.2007.03.008
Kosmowski F. (2016) Do Sustainable Development Goals converge in the identification of poor households?
An empirical comparison in Northern Benin [Les Objec- tifs de développement durable convergentils dans l'iden- tification des ménages pauvres? Une comparaison empirique au Nord Bénin] Mondes en Developpement, 174 (2), pp. 117-133.
Liu Y., Shuai C., Zhou H. (2017) How to identify poor immigrants? - An empirical study of the Three Gorges Reservoir in China. China Economic Review, 44, pp.
311-326.
DOI: 10.1016/j.chieco.2017.05.004
Lozano R. (2008). Envisioning sustainability three- dimensionally, Journal of Cleaner Production, Volume 16, Issue 17, 2008, Pages 1838-1846, ISSN 0959-6526.
DOI: 10.1016/j.jclepro.2008.02.008
Mauro V., Biggeri M., Maggino F. (2016) Measuring and Monitoring Poverty and Well-Being: A New Approach for the Synthesis of Multidimensionality Social Indicators Research, pp. 1-15.
Minujin A., Ferrer M. (2016) Assessing Sustainable Development Goals from the standpoint of equity for children. Journal of International and Comparative Social Policy, 32 (2), pp. 98-115.
DOI: 10.1080/21699763.2016.1200111
Mohsena M., Goto R., Mascie-Taylor C.G.N. (2017) Socioeconomic and demographic variation in nutritional status of under-five Bangladeshi children and trend over the twelve-year period 1996-2007. Journal of Biosocial Science, 49 (2), pp. 222-238.
DOI: 10.1017/S0021932016000328
Nussbaum, M. C. (2000). Women and human develop- ment: The capabilities approach. Cambridge University Press.
Oswald Frederick L. & Putka Dan J. (2017) Big data methods in the social sciences, Current Opinion in Behavioral Sciences, Volume 18, 2017, Pages 103-106, ISSN 2352-1546.
DOI: 10.1016/j.cobeha.2017.10.006
Ozturk I. (2017). The dynamic relationship between agricultural sustainability and food-energy-water poverty in a panel of selected Sub-Saharan African Countries.
Energy Policy, 107, pp. 289-299.
DOI: 10.1016/j.enpol.2017.04.048
Patil, G., & Taillie, C. (2004). Multiple indicators, parti- ally ordered sets, and linear extensions: Multi-criterion ranking and prioritization. Environmental and Ecological Statistics, 11, 199-228.
DOI: 10.1023/B:EEST.0000027209.93218.d9
Pérez-Ortiz, M., de la Paz-Marín, M., Gutiérrez, P.A., &
Hervás-Martínez, C. (2014). Classification of EU countries’ progress towards sustainable development based on ordinal regression techniques. Knowledge- Based Systems, 66, 178-189.
DOI: 10.1016/j.knosys.2014.04.041
Sadath, Anver C., Acharya, Rajesh H. (2017). Assessing the extent and intensity of energy poverty using Multidimensional Energy Poverty Index: Empirical evidence from households in India, Energy Policy, Volume 102, 2017, Pages 540-550, ISSN 0301-4215.
DOI: 10.1016/j.enpol.2016.12.056
Sen, A. (1985). Commodities and capabilities. Am- sterdam: North-Holland.