Gender, Work and Employment in Ten Candidate Countries of Central and Eastern
Europe.
Final Report. Country: Hungary
Authors: Éva Berde and Judit Nosztrai
Introduction.
The Hungarian media shows very contradictory pictures of women today: Successful career women enjoying material well-being is one picture, while the careful mother not working outside the home, keeping together the family is another one. Between these two contradictory poles there are almost no other female actors in the media. Life produces something different. In spite of the fact that there was a big loss of jobs in 1990s, and women’s activity rate decreased while the unemployment rate increased compared to before the 1990s, woman with duel roles are still accepted and common. The first female task is looking after the family and the second one is working outside the home and earning money. In many cases there is a third role: studying in distant or evening courses.
In the next chapters we go deeper into this topic. We analyse the different aspects of female labour market positions, and show some relevant characteristics of governmental parental benefits and childcare support, and examine how the new pension system effects women. We also have a quick look at trade unions and show their lack of activity around gender issues.
In the labour market analysis of the position of women we use labour force surveys, institution-based labour statistics, and unemployment registers. The Appendix 1 contains short descriptions of these data sources.
Economic, Demographic and Employment Background.
GDP, Economic Development and Structure.
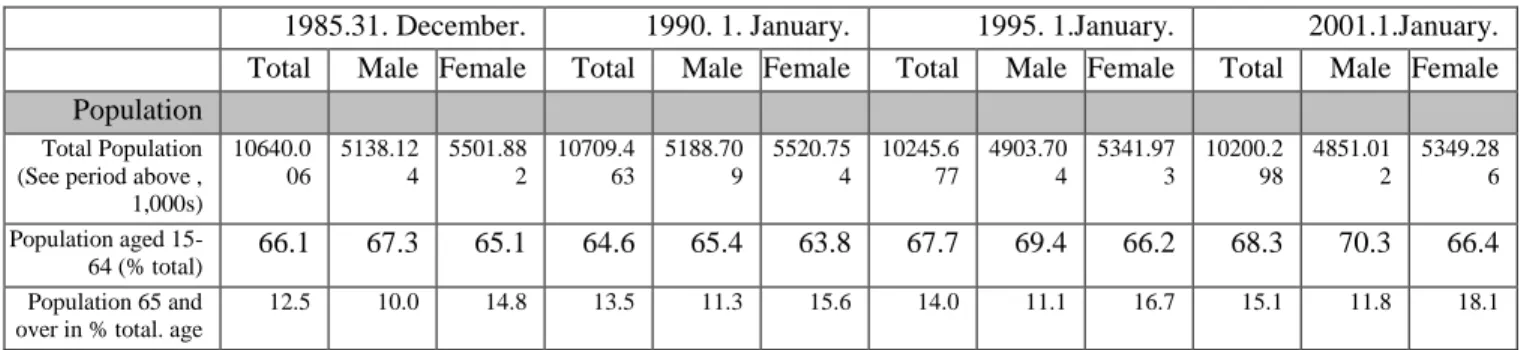
The labour market position of Hungarian women after the transition cannot be analysed without knowing the general state of the Hungarian economy. In less than 15 years the whole structure of the Hungarian economy has changed. New branches have been born and others disappeared. Figure 1 shows changes in GDP during this period. In Table 1 the per capita GDP numbers can be seen.
Figure 1. Gross domestic product per capita after the transition.
Hunfig01.doc
Source: National accounts Hungary, relevant years. Central Statistical Office, Hungary
Table 1. Gross Domestic Product, Absolute per-capita and Growth rate 1985 - 2001
1985 1990 1995 2001
GDP per capita $ *
1 950 3 187 4 325 5 087
GDP per capita PPP**
5 140 7 719 8 976 13 447
GDP growth rate
- 0.3 % - 3.5 % + 1.5 % + 3.8 %
*GDP in current prices and exchange rates, expressed in USD.
** GDP in current prices and PPPs, expressed in USD.
Source: Calculation by the experts of the Central Statistical Office, Hungary.
GDP in Hungary fell significantly after the economic and political changes. In 2001, it was only about 8% greater, and in 2002 by about 11% greater than in 1989. During this time the GDP increase in the EU was 29%, the gap between the EU countries and Hungary has widened. GDP declined until 1993, and then began to grow again.
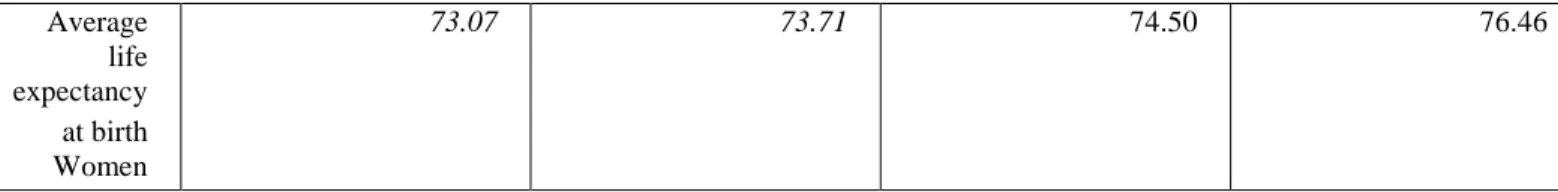
During the transition the whole economy changed. The economy became much more modernised, and production became more efficient. In the second part of the period, GDP increases were not accompanied by severe imbalances in foreign trade. The cost of these changes was suffered by the population, which can be seen by analysing real wage changes in Table 2 and Figure 2. Income inequality increased over the transition. The difference between the highest and lowest tenth of incomes doubled during this period.
Source: Employment and Earnings 1998-2001. Central Statistical Office, Hungary.
Figure 2. Relative real salaries.
Hunfig02.doc
Source: Employment and Earnings 1998-2001. Central Statistical Office, Hungary.
Most the income of the population comes from work-related income, in which wages and salaries represent the biggest share. Four-fifths of the active workforce is an employee.
Real salaries decreased until 1996, but even by 2001 they were still about 5% less than in 1989. The 57% increase in the minimum wage in 2001 explains a great part of increase in that year.
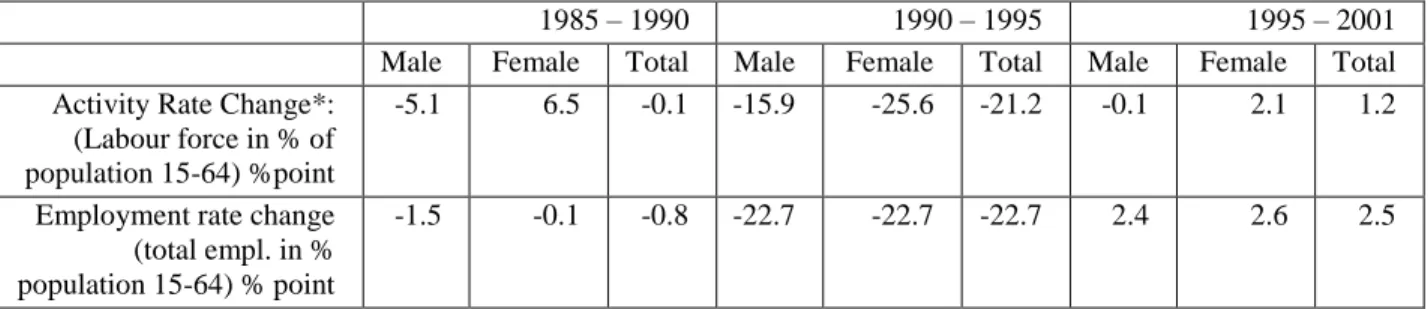
Foreign trade decreased significantly at the beginning of the 1990s, principally owing to the cessation of old trade relationships, which were determined in the field of certain commodities before 1990. Loss or narrowing of old markets was felt especially in exports. There was an increase in exports in 1992 followed by a decline the next year. In 1994 exports increased again, and the rise has continued. (See Table 3.) However, imports were always greater than exports, and as a result the shortage of external trade balance increased (Figure 3). In 2001, exports increased 2.6-fold and imports increased 3-fold in comparison with 1989.
Table 3. Export Growth Rates
1985 1990 1995 2001
Export growth rate (% change on previous year
105.2 95.9 108.4 107.8
Import growth rate (% change on previous year)
107.4 92.5 96.1 104.0
Source: Statistical Yearbooks, Central Statistical Office, Hungary
Figure 3. Balance of External Trade.
Hunfig03.doc
Source: Statistical Yearbooks, Central Statistical Office, Hungary
The volume of exports and imports had decreased in the first quarter of the period, and the structure of foreign trade has changed. The whole period was characterised by the import surplus.
Population.
Economic changes came at the same time as a decrease in the population. (See Table 4.) The decrease began in the early 1980s, but became more profound over the decade and into the next.
Table 4. Population.
1985.31. December. 1990. 1. January. 1995. 1.January. 2001.1.January.
Total Male Female Total Male Female Total Male Female Total Male Female Population
Total Population (See period above , 1,000s)
10640.0 06
5138.12 4
5501.88 2
10709.4 63
5188.70 9
5520.75 4
10245.6 77
4903.70 4
5341.97 3
10200.2 98
4851.01 2
5349.28 6 Population aged 15-
64 (% total) 66.1 67.3 65.1 64.6 65.4 63.8 67.7 69.4 66.2 68.3 70.3 66.4
Population 65 and over in % total. age
12.5 10.0 14.8 13.5 11.3 15.6 14.0 11.1 16.7 15.1 11.8 18.1
Source: Demographic Yearbooks, Central Statistical Office, Hungary
Births fluctuated to some extent, but decreased since 1985, resulting in a drop in the population. (See Table 5.) By 2001, the population shrunk by 1.7% since 1990. The migration into Hungary slightly mitigated the natural decrease of population.
The share of women was greater at the end of the period than at the beginning due to the ageing of the population and the shorter life expectancy of men. The share of those above 65 has continuously increased, with a more rapid increase for over 65 women. The life expectancy of men initially decreased in the period, but later increased. The female life expectancy increased slightly and at the end of the period reached more than 76 years.
Table 5. Annual Birth and Life expectancy rates.
Rate 1985 1990 1995 2001
Birth rate (live births per 1000 population)
12.3 12.1 10.8 9.5
Average life expectancy at birth Women
73.07 73.71 74.50 76.46
Employment and Unemployment.
Due to the importance of work in life and living standards of Hungarians, the position of women can be characterised by their labour market opportunities. Table 6 below shows basic labour market indicators, which provide a starting point for examining women’s position.
Table 6. Employment, Activity rate, Employment rate and Unemployment (LFS and registered).
1985 1990* 1995 2001
Total Male Female Total Male Female Total Male Female Total Male Female Employment
LFS Labour force (Employed+unemployed 1,000s)
5372.
9 2912.
3
2460.6 5108.
2 2823.
8
2427.6 4095.
3 2311.
1
1784.2 4092.
4 2273.
3
1819.1
% Labour force who are M &
F
100 54.2 45.8 100 55.3 45.7 100 56.4 43.6 100 55.5 44.5 Activity Rate** (Labour force
in % of total, M & F populations, 15-64)
80.1 88.9 69.4 80.0 83.8 75.9 58.8 67.9 50.3 60.0 67.8 52.4
Total employment (LFS, 1,000s, 2nd quarter***)
5372.
9 2912.
3
2460.6 5227.
2 2809.
6
2417.6 3665 2042.
6
1622.4 3849.
8 2127.
5
1722.3
% Employed who are M &
F***
100.0 54.2 45.8 100.0 53.7 46.3 100.0 55.7 44.3 100.0 55.3 44.7 Employment rate (total empl.
in % of total, M & F populations, 15-64)
76.4 84.2 68.7 75.6 82.7 68.6 52.8 60.0 45.9 55.3 62.4 48.5
Employment in agriculture (%
total, M & F employment
****
18.9 (in 1980)
21.4 15.7 15.5 19.1 10.9 8.1 11.0 4.7 6.2 8.4 3.5
-Industry (% a above) 41.2 (in 1980)
44.8 36.5 37.9 42.4 32.2 33.1 39.8 24.8 34.2 41.3 25.5
-Service (% as above) 39.9 (in 1980)
33.9 47.8 46.6 38.5 56.9 58.8 49.2 70.6 59.6 50.3 71.0
Unemployment Total unemployed 1000s LFS ILO definition
0 0 0 24.2 14.2 10.0 410.6 264.1 146.5 229.9 141.9 88
% unemployed who are M &
F
- - - 100 58.7 41.3 100 64.3 35.7 100 61.7 38.3
LFS Unemployment rate unemployed as % LF total, M
& F, 2nd quarter
- - - 2.4
(averag e)
2.6 (averag
e)
2.1 (average)
10.1 11.4 8.3 5.6 6.3 4.9
Youth unemployment rate unemployed as % LF, 2nd
quarter 15-19
- - - n.a. n.a. n.a. 29.3 31.9 25.3 18.0 17.5 18.6
Youth unemployment rate unemployed as % LF, 2nd
quarter 20-24
- - - n.a. n.a. n.a. 15.1 17.7 11.2 9.2 10.0 8.1
Elderly unemployment rate unemployed as % LF, 2nd
quarter 55-59).
- - - n.a. n.a. n.a. 5.5 5.7 5.0 2.8 3.6 1.3
Elderly unemployment rate unemployed as % LF, 2nd
quarter 60-74).
- - - n.a. n.a. n.a. 4.1 3.8 4.7 2.1 2.1 2.3
Long term unemployed (% of total unemployed, 2nd quarter) (more than 12 months)
- - - n.a. n.a. n.a. 44.2 46.5 43.2 41.1 42.3 39.2
Registered unemployment rate (2nd quarter
0 0 0 0.46
(averag e)
0.50.
(averag e)
0.41 (average)
12.1 (averag
e)
12.3 (averag
e)
11.8 (average)
8.4 (averag
e)
8.3 (averag
e)
8.5 (average)
* In 1990 unemployed are registered unemployed. In this year practically all unemployed persons were registered. In other years unemployed persons fit to ILO definition.
Sources: Employment and Earnings 1998-2001, and Labour Force Survey 1992-2001.
Statistical Yearbook 1985.
** Activity rate of the working-age population, which changed over time as follows: In all period, the 0-14 population is excluded. Men over 60 years are excluded until 1999, and over 61 years in 2000 and 2001, and over 62 years from 2002 on. Women over 55 are excluded until 1996, over 56 years between 1997- 1999, and over 57 years in 2000 and 2001.
***In 1985 and 1990 from Labour Force Balance, 1st January. Other years Labour Force Survey
**** For 1985 and 1990 calculations are based on data from Living Standard 1988-1997. There are not appropriate data for 1985, because classification was different, and the reclassification was done only for 1980.For 1995 and 2001 data are from Labour Force Surveys.
***** Unemployment for 1985 is zero (the law prohibited nonemployment), and unemployment for 1990 is from census. Data are taken from Living Standard (1988-1997) and Employment and Earnings 1998- 2001, Central Statistical Office, Hungary. Unemployment in 1995 and 2001 are ILO unemployment from Labour Force Surveys.
Between 1989 and 1992 about 1.3 million people lost their jobs. Job losses then slowed down, and between 1995 and 2001, the number of working people increased by 180,000.
labour force was women, and in 1995 only 43.6%. (See Table 6.) The loser of this process was definitely women, as the female activity rate dropped by 25%point from 1990 to 1995, while the male activity rate dropped by only 15.9%pont. Some of these decreases are explained by a change in the measurement of the activity rate. In 1990, the denominator was the working age population, and the retirement age was 55 for women and 60 for men. In 1995 and 2001, the denominator is the number of the age group 15-64.
The broadening of the denominator results in some decrease in the activity rate.
Nevertheless, the drop in the activity rate of women is larger than from men.
The labour force in 2001 was still about 1.5 million less than in 1989. The lowest level of employment occurred in 1996-97, but by 2001, it was 6% higher. The source of the increase was women, since their activity rate increased more significantly than activity rate of men. The male activity rate in 1995 was 67.9% and in 2001 was marginally lower at 67.8%, whereas women’s activity rate increased from 50.3% to 52.4% over the same time period. Table 7 shows changes of activity rates and employment rates five year averages.
Table 7. Total % Changes: Activity Rates and Employment Rates Labour Force Surveys
1985 – 1990 1990 – 1995 1995 – 2001
Male Female Total Male Female Total Male Female Total Activity Rate Change*:
(Labour force in % of population 15-64) %point
-5.1 6.5 -0.1 -15.9 -25.6 -21.2 -0.1 2.1 1.2
Employment rate change (total empl. in % population 15-64) % point
-1.5 -0.1 -0.8 -22.7 -22.7 -22.7 2.4 2.6 2.5
*Activity rate in 1985 and 1990 from working-age population.
See sources of the data and explanation below Table 6.
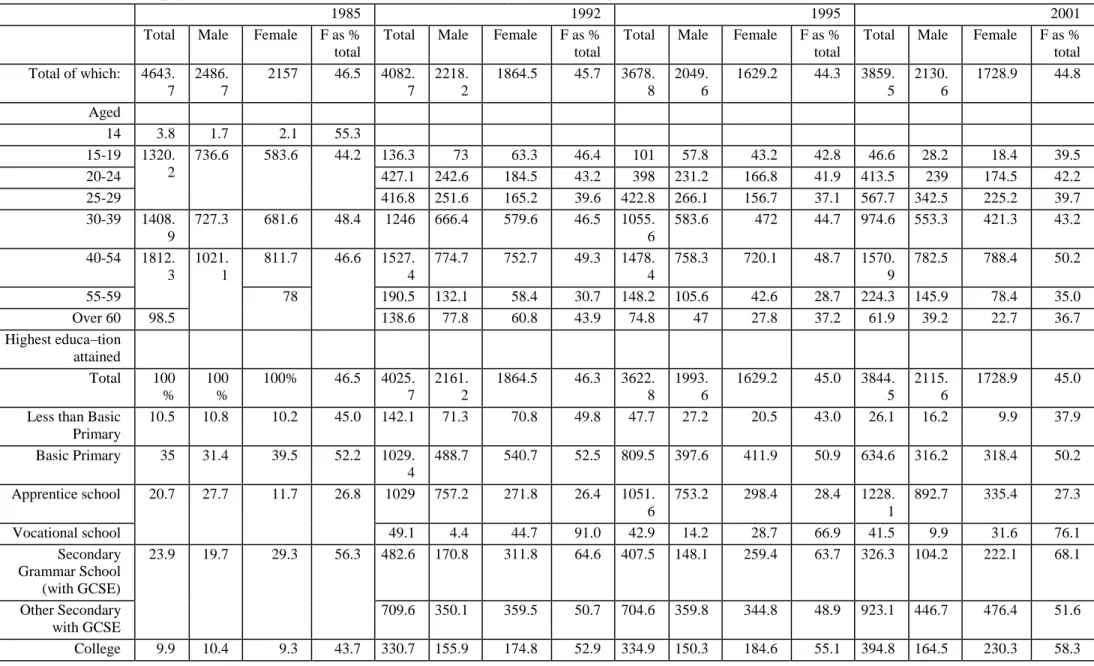
Lower female activity rates were accompanied by lower unemployment rates for women (See Figure 4.), which is unusual compared to some other countries. It shows partly that women who wanted to work were ready to accept "whatever job" exists, and it is partly due to the consequences of a changing economy. Women work in high percentages in education, health care, and services (see later), where unemployment rates are lower than in other sectors of the economy.
Figure 4. Unemployment Rate by Sex
Hunfig04.doc
Source: Employment and Earnings 1998-2001, Central Statistical Office, Hungary
Employment and unemployment by gender as total numbers can hide some important relationships. Examining these indicators by Age Band and Highest Educational Attainment (Table 8a.and Table 9.) indicates these relationships.
Table 8a. Employees*, Men and Women, Labour Force Surveys by Age Bands and Highest Educational Attainment, Thousands and Female as % Total
1985 1992 1995 2001
Total Male Female F as % total
Total Male Female F as % total
Total Male Female F as % total
Total Male Female F as % total Total of which: 4643.
7
2486.
7
2157 46.5 4082.
7
2218.
2
1864.5 45.7 3678.
8
2049.
6
1629.2 44.3 3859.
5 2130.
6
1728.9 44.8 Aged
14 3.8 1.7 2.1 55.3
15-19 1320.
2
736.6 583.6 44.2 136.3 73 63.3 46.4 101 57.8 43.2 42.8 46.6 28.2 18.4 39.5
20-24 427.1 242.6 184.5 43.2 398 231.2 166.8 41.9 413.5 239 174.5 42.2
25-29 416.8 251.6 165.2 39.6 422.8 266.1 156.7 37.1 567.7 342.5 225.2 39.7
30-39 1408.
9
727.3 681.6 48.4 1246 666.4 579.6 46.5 1055.
6
583.6 472 44.7 974.6 553.3 421.3 43.2 40-54 1812.
3
1021.
1
811.7 46.6 1527.
4
774.7 752.7 49.3 1478.
4
758.3 720.1 48.7 1570.
9
782.5 788.4 50.2
55-59 78 190.5 132.1 58.4 30.7 148.2 105.6 42.6 28.7 224.3 145.9 78.4 35.0
Over 60 98.5 138.6 77.8 60.8 43.9 74.8 47 27.8 37.2 61.9 39.2 22.7 36.7
Highest educa–tion attained
Total 100
% 100
%
100% 46.5 4025.
7
2161.
2
1864.5 46.3 3622.
8
1993.
6
1629.2 45.0 3844.
5 2115.
6
1728.9 45.0 Less than Basic
Primary
10.5 10.8 10.2 45.0 142.1 71.3 70.8 49.8 47.7 27.2 20.5 43.0 26.1 16.2 9.9 37.9
Basic Primary 35 31.4 39.5 52.2 1029.
4
488.7 540.7 52.5 809.5 397.6 411.9 50.9 634.6 316.2 318.4 50.2 Apprentice school 20.7 27.7 11.7 26.8 1029 757.2 271.8 26.4 1051.
6
753.2 298.4 28.4 1228.
1
892.7 335.4 27.3
Vocational school 49.1 4.4 44.7 91.0 42.9 14.2 28.7 66.9 41.5 9.9 31.6 76.1
Secondary Grammar School (with GCSE)
23.9 19.7 29.3 56.3 482.6 170.8 311.8 64.6 407.5 148.1 259.4 63.7 326.3 104.2 222.1 68.1
Other Secondary with GCSE
709.6 350.1 359.5 50.7 704.6 359.8 344.8 48.9 923.1 446.7 476.4 51.6 College 9.9 10.4 9.3 43.7 330.7 155.9 174.8 52.9 334.9 150.3 184.6 55.1 394.8 164.5 230.3 58.3
University 253.2 162.8 90.4 35.7 224.1 143.2 80.9 36.1 270 165.2 104.8 38.8
*January-December average
Sources: Labour Force Survey 1992-2001 and Statistical Yearbook 1985. Central Statistical Office, Hungary.
The total number by age bands (e.g. 4082.7 thousand in 1992) and the total number by educational attainment (e.g. 4025.7 thousand in 1992) in Table 8 have slight differences, the cause of which is that data are based on labour force surveys and then approximated to total population. The difference in the two approximations does not cause problems in relative numbers.
In the age band 40-54 there are almost as many female workers as male. (In 2001 when there was slight increase in women participation rate the employees women took the 50.2
% of that age group employees.) This is the age group which shows the big flexibility of women. Those between 40 and 54 were educated under the previous system and have more difficulty finding work in the market economy. Women still could find jobs more easily. Later we will see that they are paid less, which is partly the cause of their relatively high employment rate.
On average, women have a higher level of education than men with the exception of apprentice school and university levels. In vocational apprentice schools, manual professions are taught, which are male dominated. Even at college level the share of women is greater, and it has increased during that period. At the university level the women's share has also increased, but still has not reached 40% in 2001. This is the consequence of the presence of older generations, where female educational attainment really was lower than that of males. One can analyse the educational attainment from a different perspective using Table 8b.
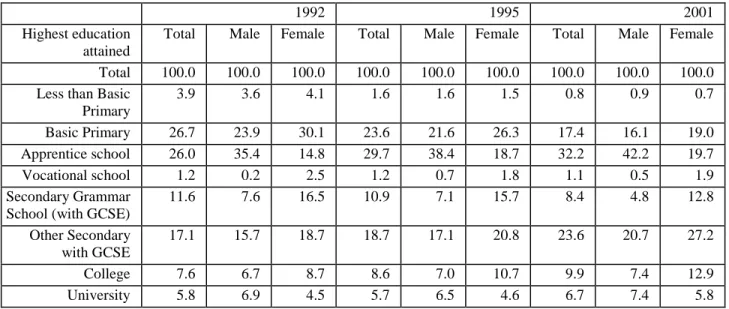
Table 8b. Distribution by Educational Attainment of Active People by Gender (%)
1992 1995 2001
Highest education attained
Total Male Female Total Male Female Total Male Female Total 100.0 100.0 100.0 100.0 100.0 100.0 100.0 100.0 100.0 Less than Basic
Primary
3.9 3.6 4.1 1.6 1.6 1.5 0.8 0.9 0.7
Basic Primary 26.7 23.9 30.1 23.6 21.6 26.3 17.4 16.1 19.0
Apprentice school 26.0 35.4 14.8 29.7 38.4 18.7 32.2 42.2 19.7
Vocational school 1.2 0.2 2.5 1.2 0.7 1.8 1.1 0.5 1.9
Secondary Grammar School (with GCSE)
11.6 7.6 16.5 10.9 7.1 15.7 8.4 4.8 12.8
Other Secondary with GCSE
17.1 15.7 18.7 18.7 17.1 20.8 23.6 20.7 27.2
College 7.6 6.7 8.7 8.6 7.0 10.7 9.9 7.4 12.9
University 5.8 6.9 4.5 5.7 6.5 4.6 6.7 7.4 5.8
Table 8b shows that there was no significant gap between the educational attainment of women and men even in 1992, and after the transition the female educational attainment has become even closer to the male educational attainment. Examining the gender breakdown of recent higher degree recipients reinforces these statistics. In 2001, for example, 63.4% of those who received a college degree, and 53.7% of those who received a university degree were women.
The increasing educational attainment of women indicates a better labour market position in the future, because the higher the educational attainment, the lower the probability of being unemployed. See Table 9.
Table 9. Unemployment Rate*, Men and Women, by Age Band and Highest Educational Attainment
1992 1995 2001
Men
%
Women% Men
%
Women% Men
%
Women%
Total of which:
10.7 8.7 11.3 8.7 6.3 5.0
Aged
15-19 28.2 25.4 33.3 28 20.1 22.7
20-24 16.2 10.9 16.8 11.7 10.4 8.2
25-29 11.8 11.4 11.0 9.7 7.1 6.7
30-39 10.1 8.5 10.7 9.0 5.7 5.0
40-54 8.3 6.5 8.9 6.3 5.0 3.6
55-59 6.6 5.7 5.9 5.5 3.9 1.4
60-74 4.0 4.9 4.5 6.1 2.0 2.2
Highest education attained Less than Basic Primary
19.1 15.9 26.9 25.2 20.2 19.5
Basic Primary
15.9 12.0 18.2 12.1 13.3 8.0
Apprentice school
12.0 10.4 13.0 10.4 6.3 6.4
Vocational school
8.3 12.4 12.9 9.2 8.3 6.8
Secondary Grammar School (with GCSE)
6.8 7.3 7.9 7.2 4.2 4.5
Other Secondary with GCSE
8.0 6.0 6.7 7.0 4.3 3.8
College 3.9 1.7 4.3 3.0 1.6 1.9
University 2.4 2.6 1.7 2.4 0.9 1.0
*Average year data
Sources: Labour Force Surveys
Unfortunately in the future, college and university degrees are not expected to provide such a high level of safety against unemployment as present because of increased participation in higher education. Currently, Hungary is experiencing a brand new phenomenon: unemployment of new higher education graduates.
Structure of Economy.
To understand more about the labour market position of Hungarian women we must analyse the structure of the economy. Table 10 shows how the ownership structure changed in the 1990s.
Table 10. Changing Structure of Public and Private Sectors, in percentage of total employment.
1985 1992 1995 2000
Private sector 4.2 30.5 41.7 57.4
Mixed 0 8.7 12.2 6.5
Public sector 95.8 60.8 46.1 36.1
Source: Monitoring statistics, TARKI 2000. December.
Although in 1985 only 4.2% of total employment was in the private sector, by 2000, that number rose to 57.4%. We will see later that women are more dominant in public sector employment such as education and health care. Now Table 11 shows the changing structure of the economy by sectors.
Table 11. Changing Structure of Economy: Employed by NACE as percentage Total Workers Employed in civil sector of Economy pre- and post-transition
NACE % All in civil sector of economy1985
% All in civil sector of economy 1992
% All in civil sector of economy 1995
% All in civil sector of economy 2001
Total 100 100 100 100
1.+2 Agriculture et al + Fishing et al.
12.5 11.3 8.0 6.2
3. Mining 1.3 0.9 0.4
4. Manufacturing 34.0 (3.+4.) 25.8 23.1 24.8
5. Electricity, Gas, Water Supply
1.2 (some parts are in 4.)
2.6 2.6 2.1
Industry(3, 4, 5) sub-total
35.2 29.7 26.7 27.2
6. Construction 7.0 5.3 5.9 7.1
7. Wholesale &
Retail Trade an repairing
11.4 11.8 12.5 14.2
8. Hotels and Restaurants
(put in other categories, basically in 9.)
2.8 3.2 3.7
9. Transport, storage and communications
9.7 8.5 8.7 8.1
10. Financial Intermediation
(put in other categories, basically in 11.)
1.7 2.2 2.0
11. Real estate, renting, business
3.7 3.4 3.6 5.7
Services (7, 8, 9, 10, 11) sub-total.
24.9 28.2 30.1 33.7
12. Public administration, defence;
compulsory social security
(put in other categories, basically in 15.)
7.2 8.6 7.5
13. Education Put into 14. 7.6 9.1 8.0
14. Health and Social Work
14.7 5.8 6.3 6.1
15. Other community, social and personal service activities
5.8 4.9 5.2 4.3
Public Sector services (12, 13, 14, 15) sub-total.
20.4 25.5 29.3 25.9
Source: Calculations upon the data in Statistical Yearbook 1985;
Labour Force Surveys
During the time period studied, employment in industry had decreased as a share of total employment, while the public sector and services had increased. Particular sectors which had shrunk as a percentage of total employment include Agriculture et al.; Mining; and Manufacturing. The sectors which had grown during this period include Public Sector Services; Financial Intermediation; Transport, Storage and Communication; and Wholesale and Retail Trade and Repairing.
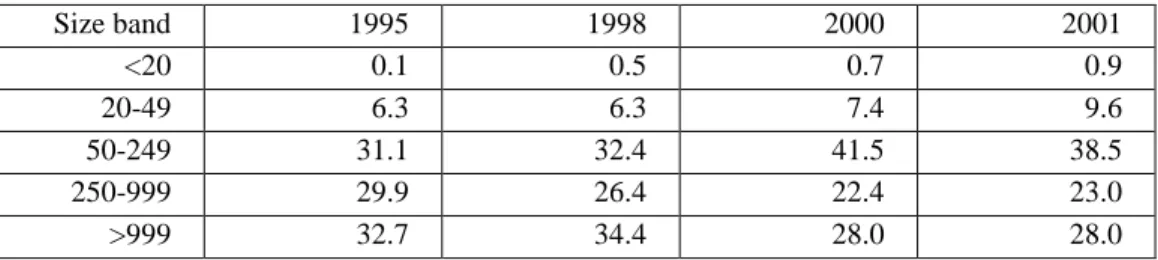
The changing structure of the economy also can be seen through the changes of firm size (Table 12a.)
Table 12 Changing Structure of Economy by firm size, % of employees.
Size band 1995 1998 2000 2001
<20 0.1 0.5 0.7 0.9
20-49 6.3 6.3 7.4 9.6
50-249 31.1 32.4 41.5 38.5
250-999 29.9 26.4 22.4 23.0
>999 32.7 34.4 28.0 28.0
Source FH BT, their own calculations.
Table 12b shows the number of the firms by different size.
Table 12b. Changing Structure of Economy by firm size. Number and % of firms by size.
Size band 1990 1995 2001
Number % Number % Number %
Total n.a. 1046539 100.0 923571 100.0
<10 n.a. 1014013 96.9 882535 95.6
10 – 20 16465 n.a. 16358 1.6 18490 2.0
20 – 100 4129 n.a. 9184 0.9 12972 1.4
>100 7068 n.a. 6984 0.7 9574 1.0
Source: Central Statistical Office, Hungary. Monthly Statistical Bulletins.
After the transition more than 95% of firms had 10 or fewer employees. Most of the time the owner is the only worker in the firm. The average firm size is 3.6 persons, compared to an average firm size of 6 persons in the EU. These small firms are very vulnerable.
There is no significant difference between the shares of women and men working in different firms by size.
Gender Segregation.
Segregation by Industry.
The share of women in the workforce has decreased slightly after 1992, as shown in Table 13, but this has not dramatically changed sectoral concentration. Those sectors where female concentration was high before transition remained so after the transition, and those sectors where female concentration was low remained low. Sectors with a high concentration of women are: Education; Health and social work; and Financial and banking services. Sectors with low concentration of women are Agriculture et al. and Fishing et al.; Mining; Electricity, gas, water supply; Construction; and Transport, storage and communications.
Table 13. Composition of Employment Sectors by Gender: percentage of each sector who are men and women.
1992 1995 2001
NACE %
Men
% Women
% Men
% Women
% Men
% Women
Total 54.3 45.7 55.7 44.3 55.2 44.8
1.+2 Agriculture et al +
Fishing et al. 68.8 31.2 74.3 25.7 74.9 25.1
3. Mining 86.3 13.7 84.7 15.3 88.2 11.8
4. Manufacturing 56.1 43.9 58.6 41.4 58.3 41.7
5. Electricity, Gas,
Water Supply 70.9 29.1 74.3 25.7 75.8 24.2
Industry(3, 4, 5) sub-
total 58.7 41.3 61.0 39.0 60.0 40.0
6. Construction 85.0 15.0 90.1 9.9 92.1 7.9
7. Wholesale & Retail
Trade an repairing 41.8 58.2 45.2 54.8 49.1 50.9
8. Hotels and
Restaurants 42.1 57.9 44.9 55.1 51.0 49.0
9. Transport, storage
and communications 70.2 29.8 74.5 25.5 72.5 27.5
10. Financial
Intermediation 24.0 76.0 28.7 71.3 30.8 69.2
11. Real estate, renting,
business 48.8 51.2 52.5 47.5 55.4 44.6
Services (7, 8, 9, 10,
11) sub-total. 44.2 55.8 47.1 52.9 45.5 54.5
12. Public administration, defence; compulsory social security
65.3 34.7 63.3 36.7 54.2 45.8
Public Sector services (12, 13, 14, 15) sub- total.
41.1 58.9 41.4 58.6 35.8 64.2
Source: Labour Force Survey 1992-2001. KSH
In spite of the relative stability of concentration, in some sectors the share of women increased, in others, it decreased. Sectors where the share of women has changed a lot during the last decade are: Electricity, gas, water supply (decrease); Construction (large decrease); Wholesale and retail trade and repair (large decrease); Financial intermediation (decrease); Public administration, defence, compulsory social security (large increase);
Other community social and personal services (small increase). In the Public Sector services as a whole, the high share of women became even higher.
Next Table 14 shows the percentage of workforce in different sectors, which also can be used as an indicator of gender segregation.
Table 14. Distribution of Male and Female Workforce across sectors (what percentage of men, what percentage of women, work in each sector)
1992 1995 2001
NACE %
Men
% Women
% Men
% Women
% Men
% Women
Total 100.0 100.0 100.0 100.0 100.0 100.0
1.+2 Agriculture et al + Fishing et al.
14.3 7.7 10.7 4.7 8.4 3.5
3. Mining 2.1 0.4 1.4 0.3 0.6 0.1
4. Manufacturing 26.6 24.8 24.3 21.6 26.2 23.0
5. Electricity, Gas,
Water Supply 3.5 1.7 3.5 1.5 2.8 1.1
Industry(3, 4, 5) sub-
total 32.1 26.9 29.2 23.5 29.5 24.2
6. Construction 8.3 1.7 9.5 1.3 11.8 1.2
7. Wholesale & Retail
Trade an repairing 9.0 15.0 10.2 15.5 12.6 16.1
8. Hotels and
Restaurants 2.2 3.6 2.6 3.9 3.4 4.1
9. Transport, storage
and communications 11.0 5.5 11.6 5.0 10.6 4.9
10. Financial
Intermediation 0.7 2.8 1.2 3.6 1.1 3.2
11. Real estate, renting,
business 3.1 3.9 3.3 3.8 5.7 5.7
Services (7, 8, 9, 10,
11) sub-total. 26.0 30.8 28.8 31.8 33.5 34.0
12. Public administration, defence; compulsory social security
8.6 5.5 9.8 7.2 7.4 7.7
13. Education 3.4 12.7 4.2 15.3 3.3 13.9
14. Health and Social
Work 2.7 9.5 2.7 10.8 2.6 10.4
15. Other community, social and personal service activities
4.6 5.2 5.0 5.5 3.6 5.1
Public Sector services (12, 13, 14, 15) sub- total.
19.3 32.9 21.7 38.8 16.8 37.1
Source Labour Force Survey 1992-2001. Central Statistical Office, Hungary.
Segregation by Occupation.
One source of gender segregation in employment is the sectoral distribution of jobs.
Another one is composition of occupational status of employment. The latter can be seen in Table 15.
Table 15. Composition of each Occupation (ISCO-88) and Status of Employment by gender.
Indicator % Each Indicator who are men and women
1994 1995 2001
ISCO-88 M F M F M F
1.Legislators, senior officials and managers
63.2 36.8 66.2 33.8 65.6 34.4
2.Professionals 43.3 56.7 44.6 55.4 42.7 57.3
3.Technicians and Associated professionals
35.5 64.5 36.4 63.6 35.5 64.5
4.Clerks 8.8 91.2 8.1 91.9 7.4 92.6
5.Service workers and shop and market sales workers
43.2 56.8 44.3 55.7 45.3 54.7
6.Skilled agricultural and fishery workers
68.7 31.3 71.2 28.8 71.7 28.3
7. Craft and related trade workers
78.7 21.3 79.2 20.8 82 18
8. Plant and machine operators and assemblers
78.9 21.1 80.3 19.7 71.3 28.7
9.Elementary occupations
42.9 57.1 43.1 56.9 45.6 54.4
0. Armed forces 94.4 5.6 94.8 5.2 90.8 9.2
Members of producers co-
operative
68.4 31.6 68.8 31.2 67.8 32.2
Member of partnership
61.7 38.3 70 30 71.6 28.4
Self-employed 65 35 69.3 30.7 69.1 30.9
Unpaid family workers
31.4 68.6 33.7 66.3 35 65.0
Source Labour Force Survey 1992-2001. Central Statistical Office, Hungary.
The first year, when this type of data were collected in a comparative way was 1994.
There are no big changes in the share of employees in ISCO-88 categories, the biggest one being the 7.6% point increase of female's share in category 8. However some occupational categories became even more female or male dominated during the time period for which there are data. In category 1, there are many more men than women, and during the analysed period the difference increased. In the second category, the situation is just the opposite. This category is female dominated, and this majority increased during the time period. The first and second employment category needs the same education level, but both in terms of power and pay, the first is higher than the second. High-level managers are in the first category.
Women dominate other jobs. Female-dominated jobs are market sales and clerks (4);
technicians and associated professionals (3); and service workers and shop and market sales workers (5). Male-dominated jobs include: craft and related trade workers (7); plant and machine operators and assemblers (8); armed forces (0); and skilled agricultural and fishery workers (6). Finally in elementary occupations (9) there are relatively more women than men.
The bottom part of Table 16 indicates ‘status in employment.’ Women are much less likely to be self-employed than men, and much more likely to be unpaid family workers.
Unpaid family work often leads women into a dependency situation with few prospects of fulfilling their own aims. All the above trends are also represented in the next table.
Table 16 below indicates the distribution of women and men by occupational and employment status.
Table 16. Distribution of Male and Females Workforce across Occupations (what percentage of men and what percentage of women work in each occupation in each year)
Percentage Male and Female Job Holders in Each Indicator
ISCO-88 1994 1995 2001
%Men %Women %Men %Women %Men %Women
1.Legislators, senior officials and managers
7.4 5.2 6.9 4.4 8.0 5.2
2.Professionals 8.1 12.8 8.6 13.5 9.0 14.9
3.Technicians and Associated professionals
7.7 17.1 8.2 18.0 8.6 19.2
4.Clerks 1.4 17.1 1.2 16.4 0.9 13.8
5.Service workers and shop and market sales workers
10.9 17.3 11.3 17.9 12.8 19.0
6.Skilled agricultural and fishery workers
4.4 2.4 4.5 2.3 4.5 2.2
7. Craft and related trade workers
32.6 10.7 32.0 10.6 32.2 8.7
8. Plant and machine operators and assemblers
15.0 4.8 15.4 4.7 15.4 7.6
9.Elementary occupations
7.5 12.1 7.1 11.8 6.2 9.1
0. Armed forces 5.0 0.4 4.8 0.3 2.4 0.3
Status in employment 1992 1995 2001
Employees 76.1 83.6 78.3 87.0 82.4 89.8
Members of producers cooperative
7.1 3.8 2.9 1.6 1.0 0.6
Member of partnership 7.4 5.3 5.9 3.1 4.0 2.0
Self-employed 8.7 5.4 12.2 6.6 12.2 6.6
Source: Labour Force Survey. Central Statistical Office, Hungary.
Gender and Pay.
Distribution by occupational status is only half of the picture. The other half is the pay structure of these jobs. See Table 17 below.
Table 17 Gross Average Monthly Pay, Men and Women, 1994 – 2001, by Industry (NACE).
NACE Gross average pay 1994
Gross average pay 1996
Gross average pay 2001 M F F as
% M
M F F as
% M
M F F as
% M Total 3926
8 3183
2
81.1 5316 8
4199 9
79.0 1147 32
9191 1
80.1 1Agriculture et al 2741
7 2290
3
83.5 3755 4
3297 8
87.8 7659 6
6657 5
86.9 2. Fishing et al. 2601
5 2655
3
102.1 4409 7
4139 4
93.9 6477 6
6270 5
96.8 3. Mining 4943
2 3383
7
68.5 6231 9
5235 7
84.0 1221 63
1209 07
99.0 4. Manufacturing 3986 2878 72.2 5607 4005 71.4 1189 8557 72.0
Industry (3, 4, 5) average 4130 1
2934 2
71.0 5822 9
4116 8
70.7 1218 43
8753 7
71.8 6. Construction 3410
8 3280
9
96.2 4241 3
4104 3
96.8 8378 0
8644 1
103.2 7. Wholesale & Retail Trade an
repairing 4032
2 3122
1
77.4 5290 5
4111 9
77.7 1022 80
8351 1
81.6 8. Hotels and Restaurants 3704
1 2776
8
75.0 4918 8
3637 0
73.9 9163 4
6710 4
73.2 9. Transport, storage and
communications 3906
6 3467
1
88.7 5490 7
4941 9
90.0 1183 14
1081 97
91.4 10. Financial Intermediation 7555
3 5355
4
70.9 1154 28
7726 8
66.9 2963 68
1745 16
58.9 11. Real estate, renting, business 4265
0 3621
3
84.9 5480 1
5116 7
93.4 1317 87
1097 28
83.3 Services (7, 8, 9, 10, 11) average. 4166
6 3595
8
86.3 5673 2
4973 8
87.7 1211 20
1040 31
85.9 12. Public administration, defense;
compulsory social security 4494
8 3443
3
76.6 5290 1
4308 8
81.5 1488 09
1114 30
74.9 13. Education 3950
6 3146
3
79.6 4649 7
3744 6
80.5 1033 77
8199 0
79.3 14. Health and Social Work 3816
1 2905
3
76.1 4651 9
3633 1
78.1 9340 4
7826 1
83.8 15. Other community, social and
personal service activities 4328
8 3394
1
78.4 5386 6
4500 4
83.5 1088 24
8969 0
82.4 Public Sector services (12, 13, 14,
15) average.
4117 5
3162 2
76.8 4959 3
3927 6
79.2 1160 01
8886 9
76.6 Source: Employment and Earnings in the National Economy, referred year data. Central Statistical Office, Hungary.
In each sector women earned about 20% less gross pay on average than men. The only exception is construction where women represent a very low share. The special character of construction work entails that women work there basically only in positions of higher rank, where they receive relatively higher pay.
Women receive less than 80% of male's pay in Manufacturing and in Public
Administration et al. In the latter, the share of women has increased. The lowest pay relative to men is in Financial Intermediation where women earn less than 60% of men’s pay. This declined from just over 70% at the beginning of the period studied. At the same time the high share of women in this sector shrunk. Men replaced women in higher level management with higher pay, and women remained in lower-paid employment in this sector. Table 18 shows the pay differences by occupation.
Table 18. Gross Average Monthly Pay, Men and Women, 1994 – 2001 , by Occupation (ISCO-88).
Gross average pay 1994 Gross average pay 1997 Gross average pay 2001
ISCO-88 M F F
as
% M
M F W
as
% M
M F F
as
% M average 39268 31832 81.
1
64486 51442 79.
8 11473
2
91911 80.
1